-
-
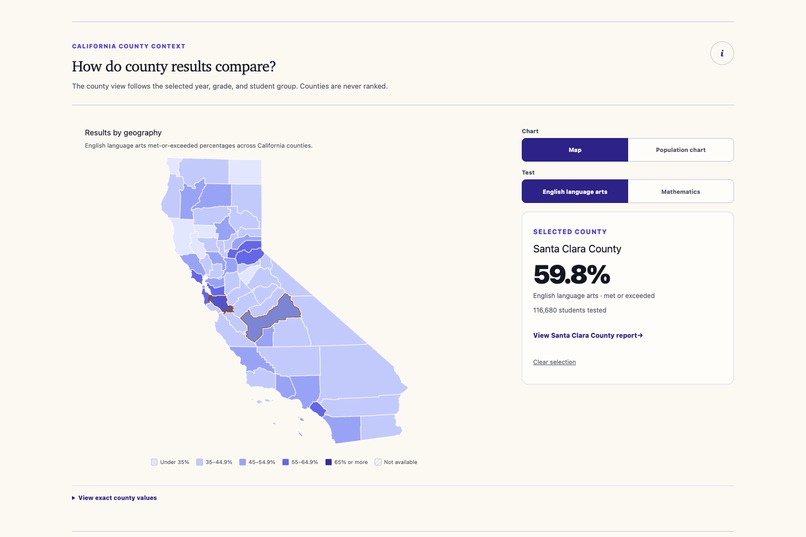
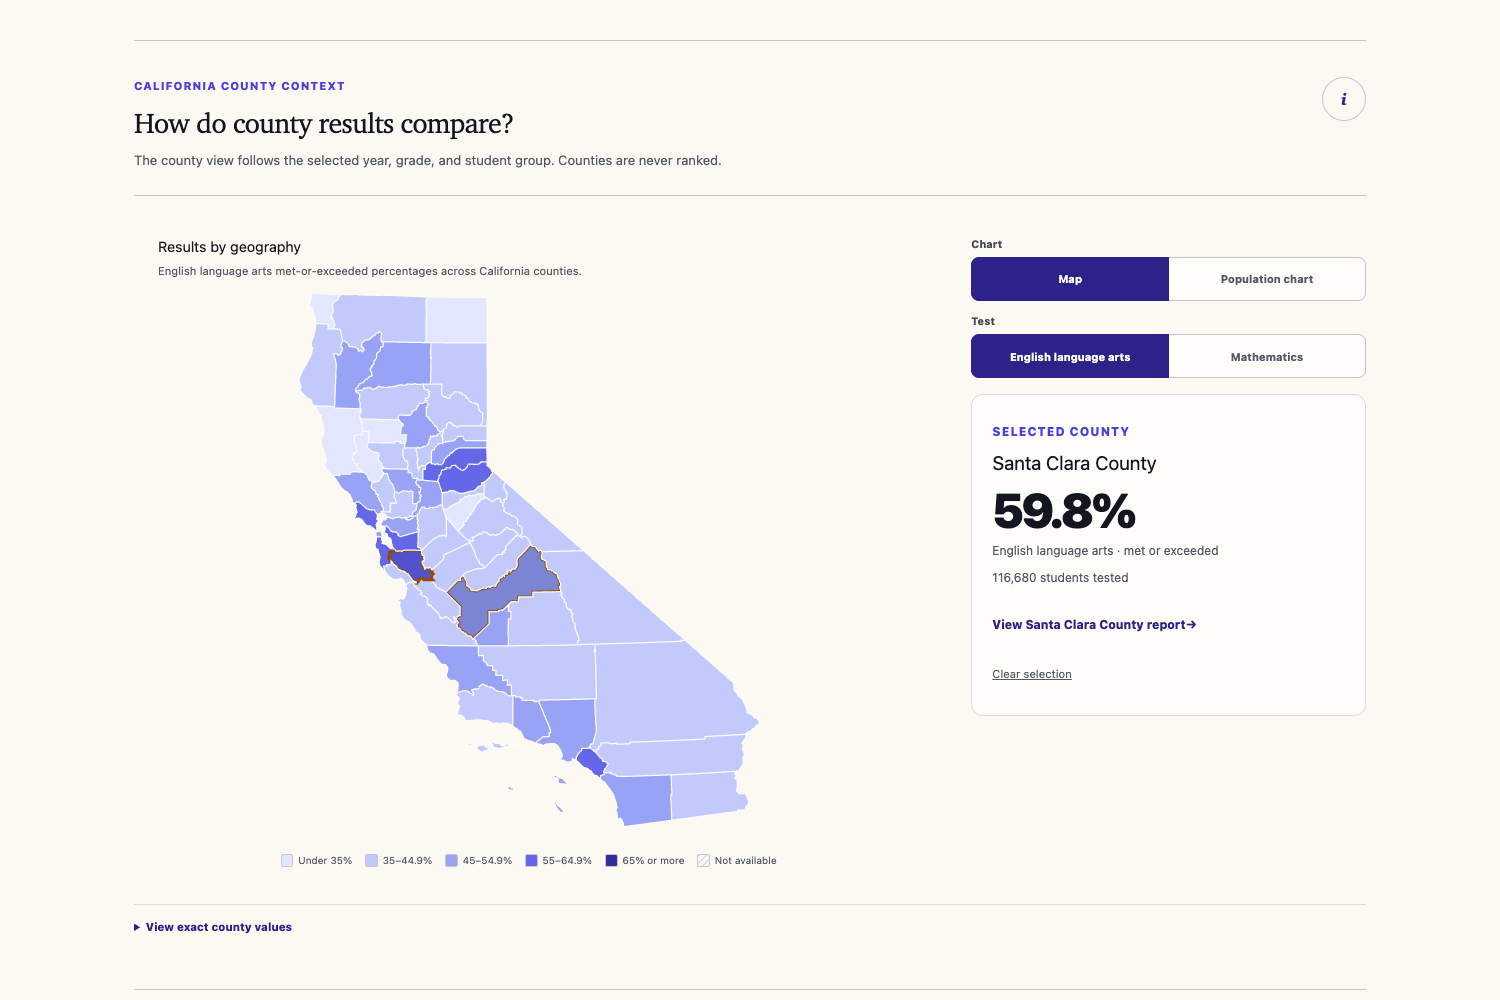
County map
-
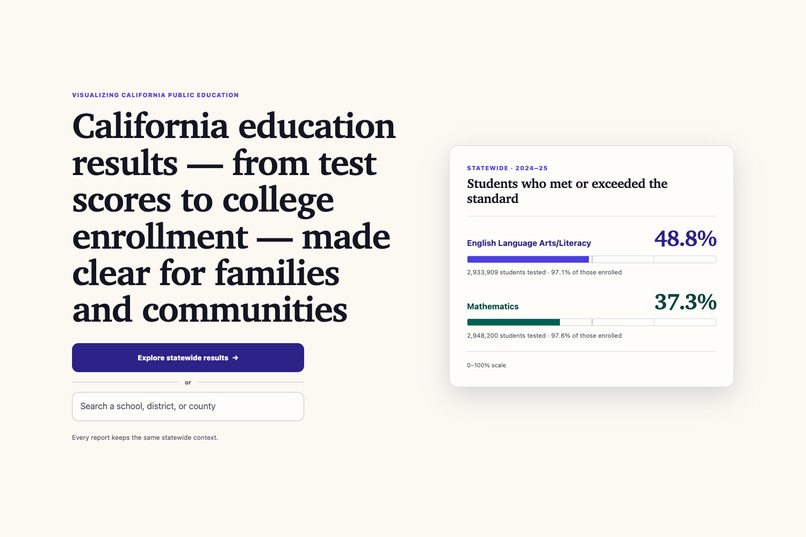
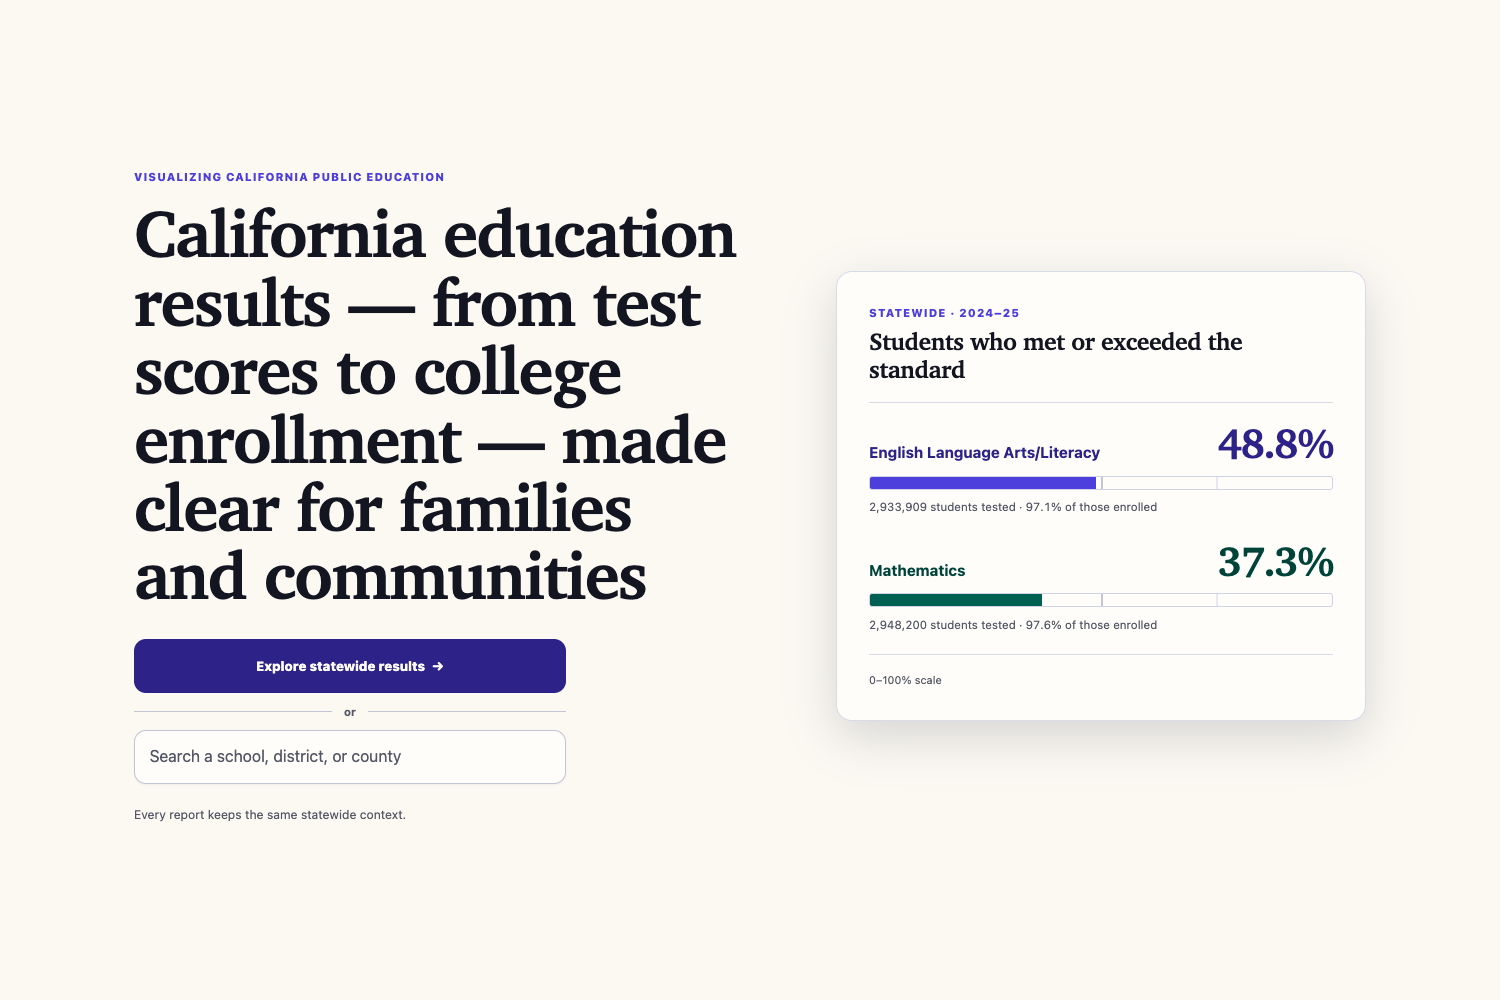
Langing page
-
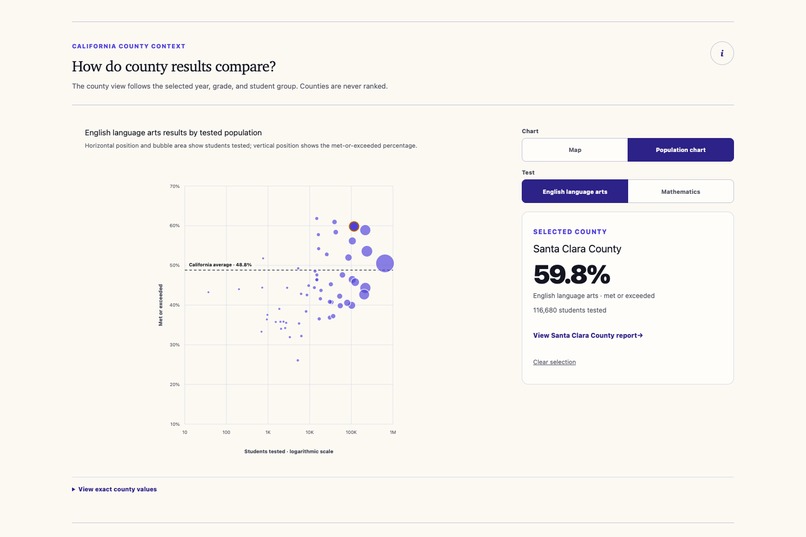
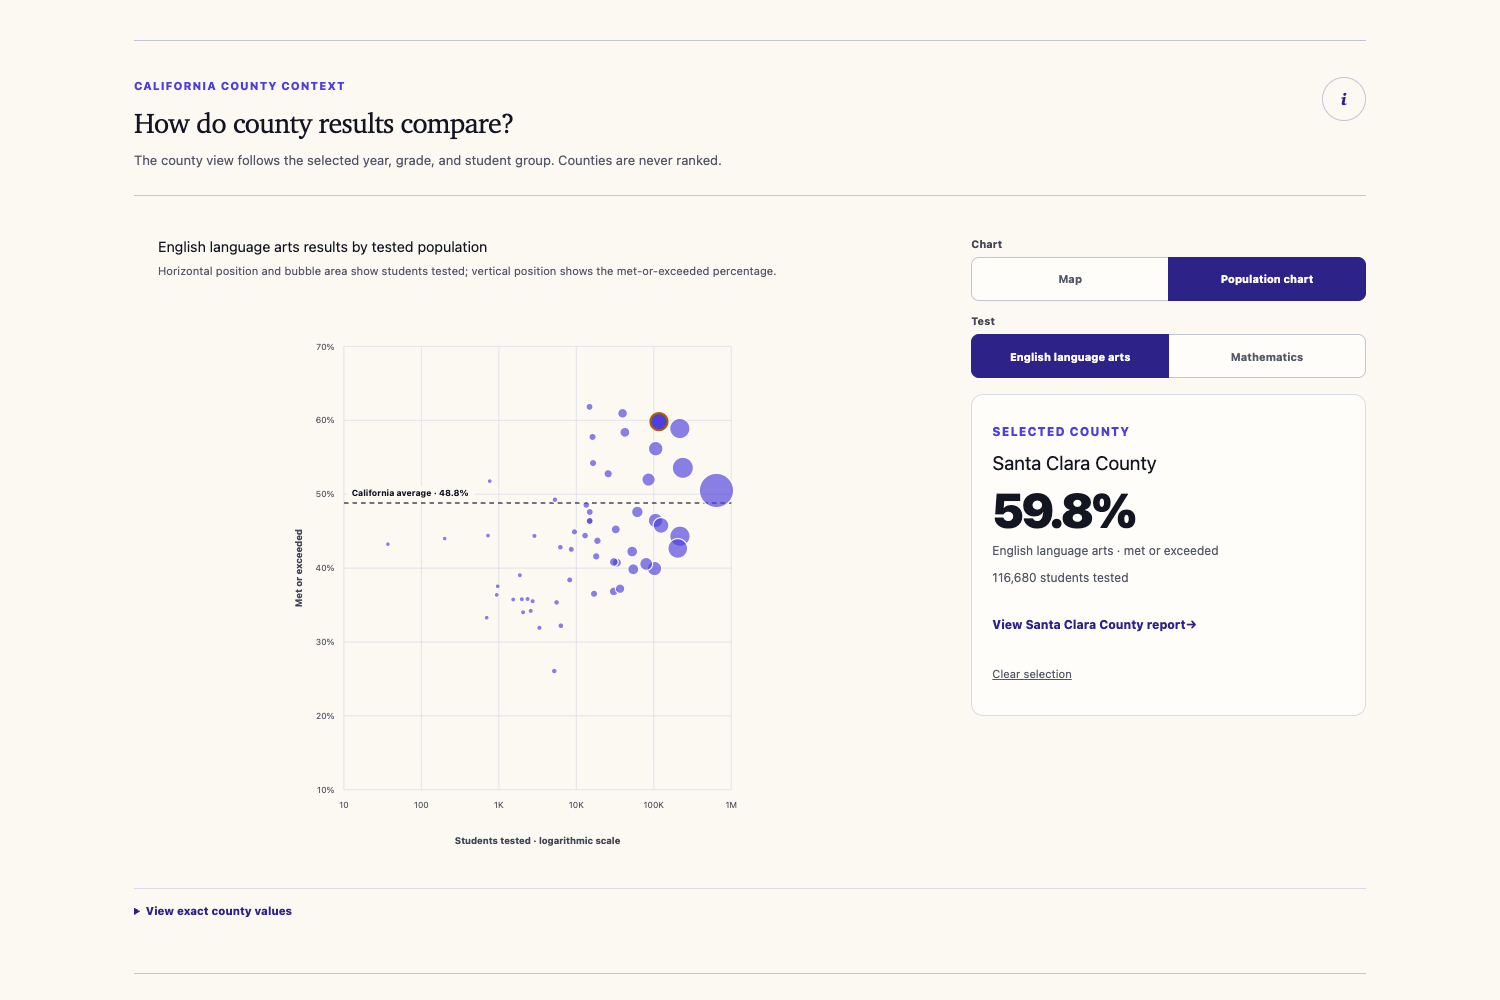
Student population and achievement chart
-
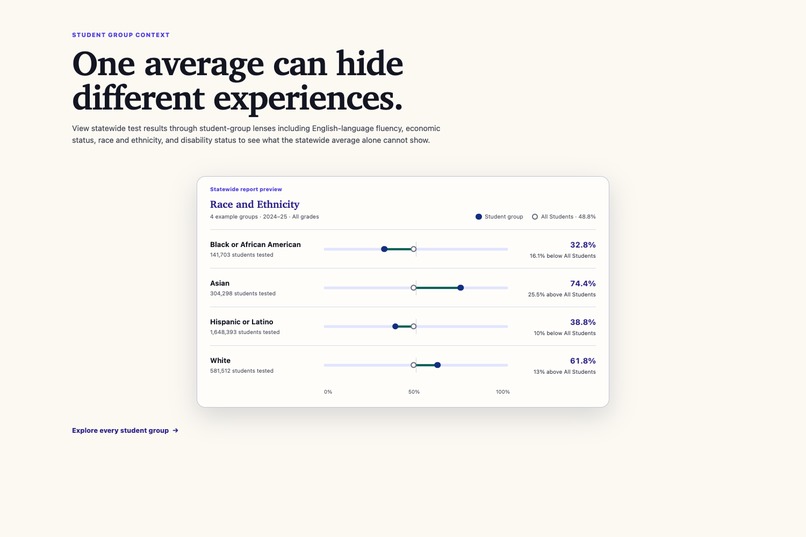
Student group/demographics
-
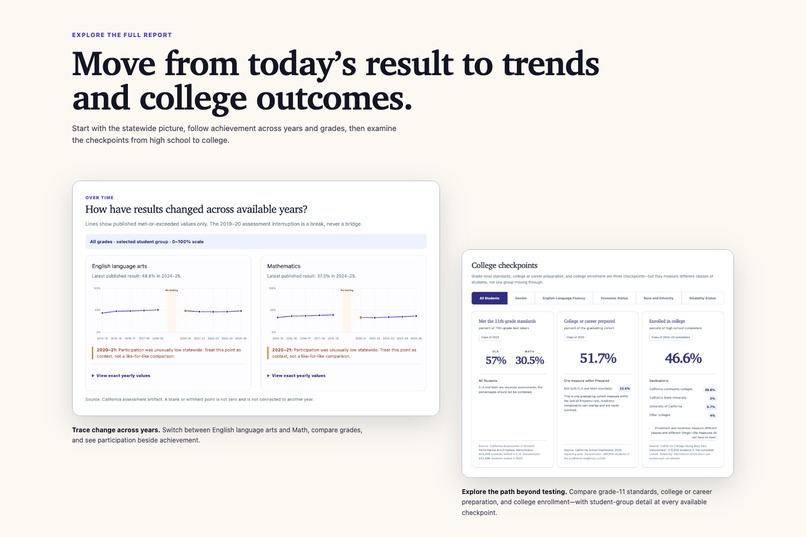
Trends and checkpoints
-
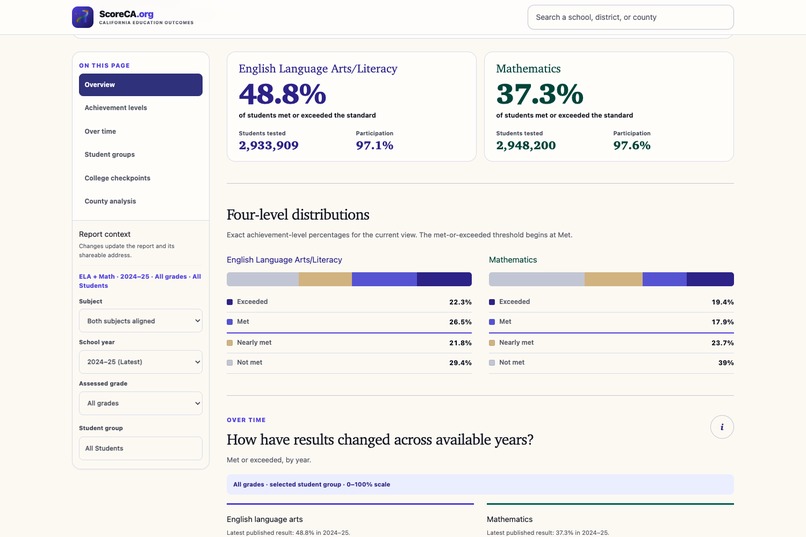
State overview
-
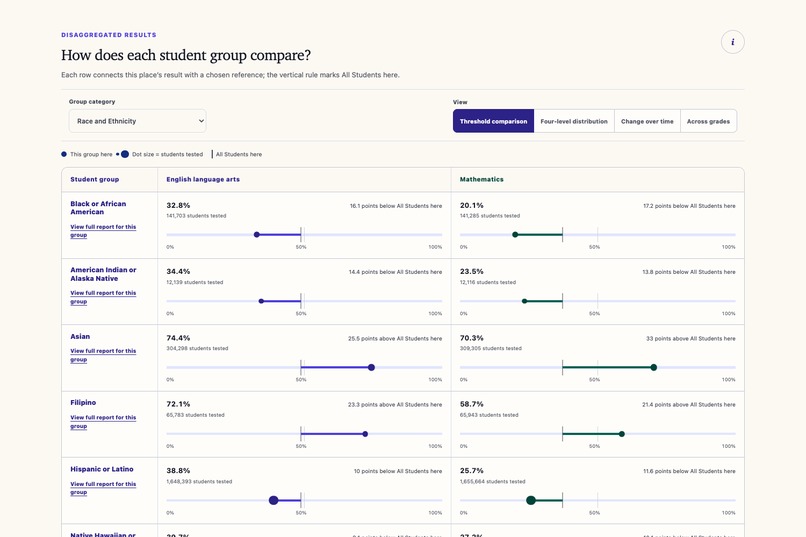
Student group comparison
-
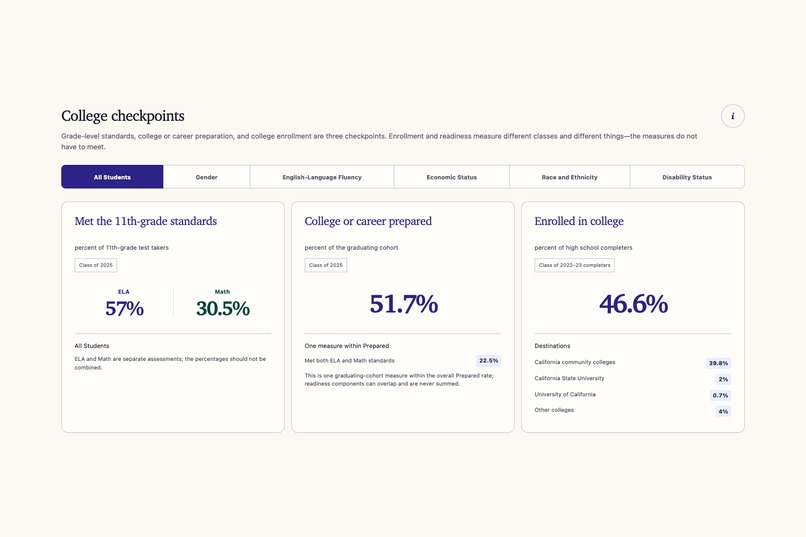
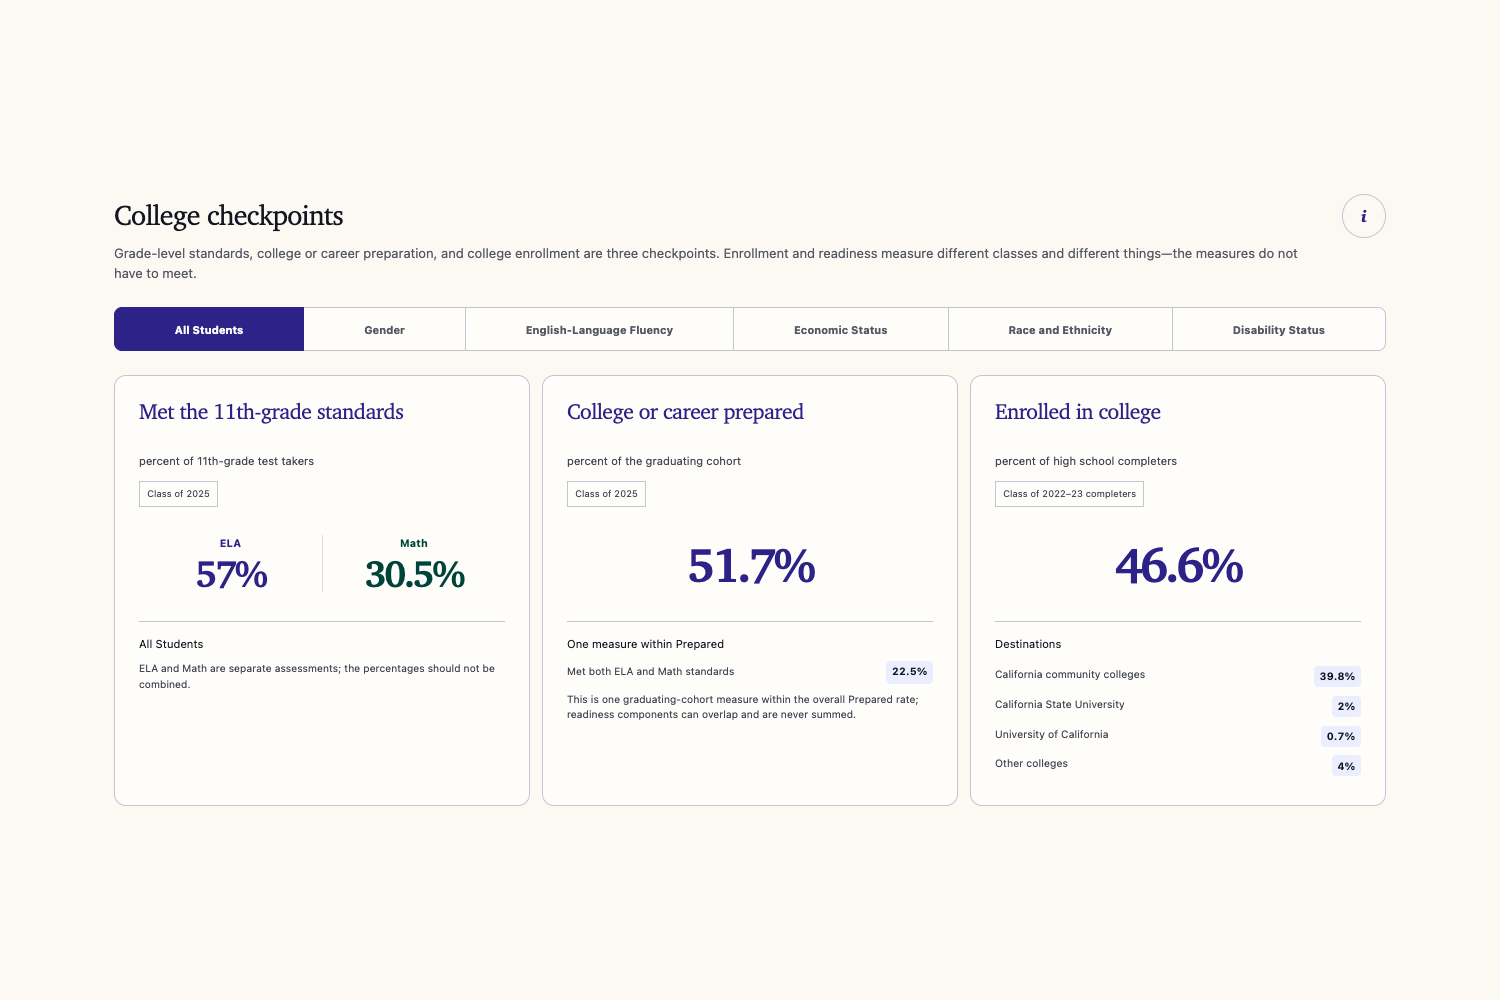
College readiness checkpoints
-
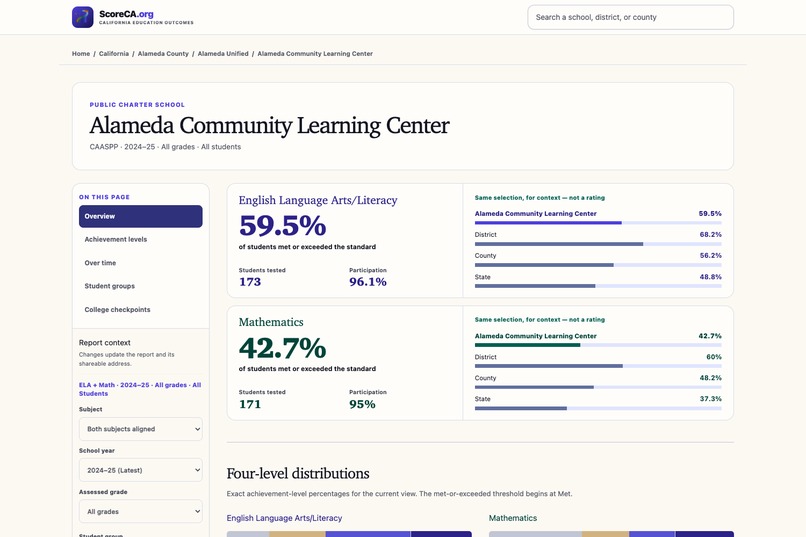
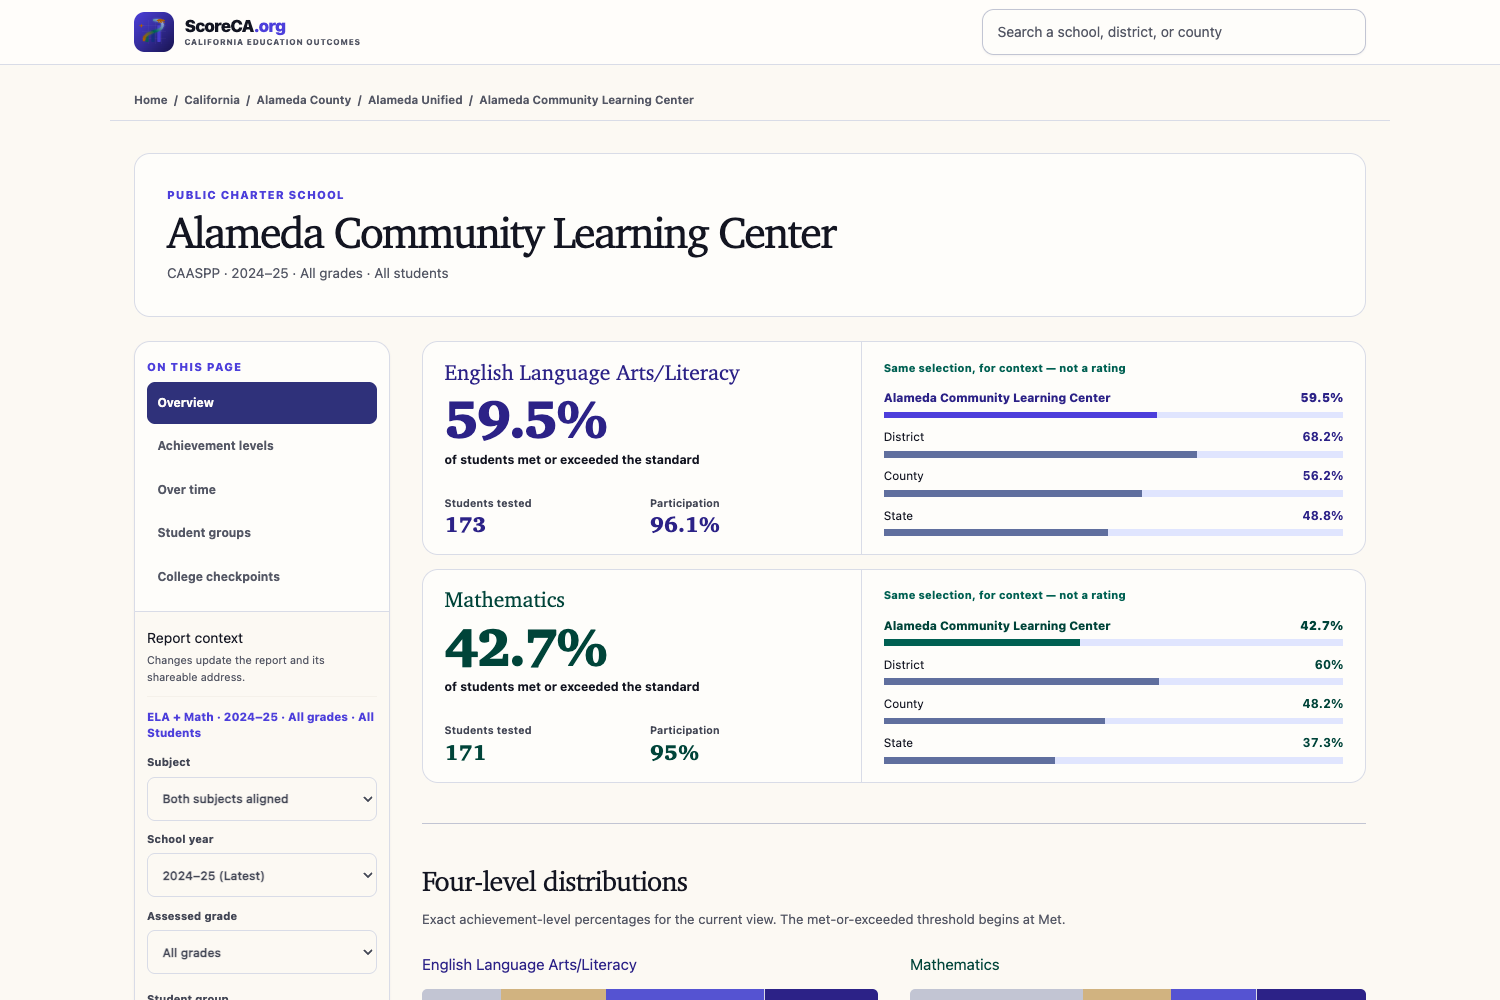
School report
Inspiration
Every year, the State of California publishes millions of data points on its public schools' proficiency, college-or-career readiness, and college enrollment. However, they are buried in sprawling, caret-delimited flat files and massive spreadsheets that the average citizen cannot open, let alone interpret. We wanted to build a public utility to show the official record in charts that the parents, educators, and researchers can read.
What it does
ScoreCA.org is a public data explorer for California education outcomes. Visitors can search for a county, district, or school and explore official published results with plain-language context, intuitive charts, accessible tables, and transparent source notes.
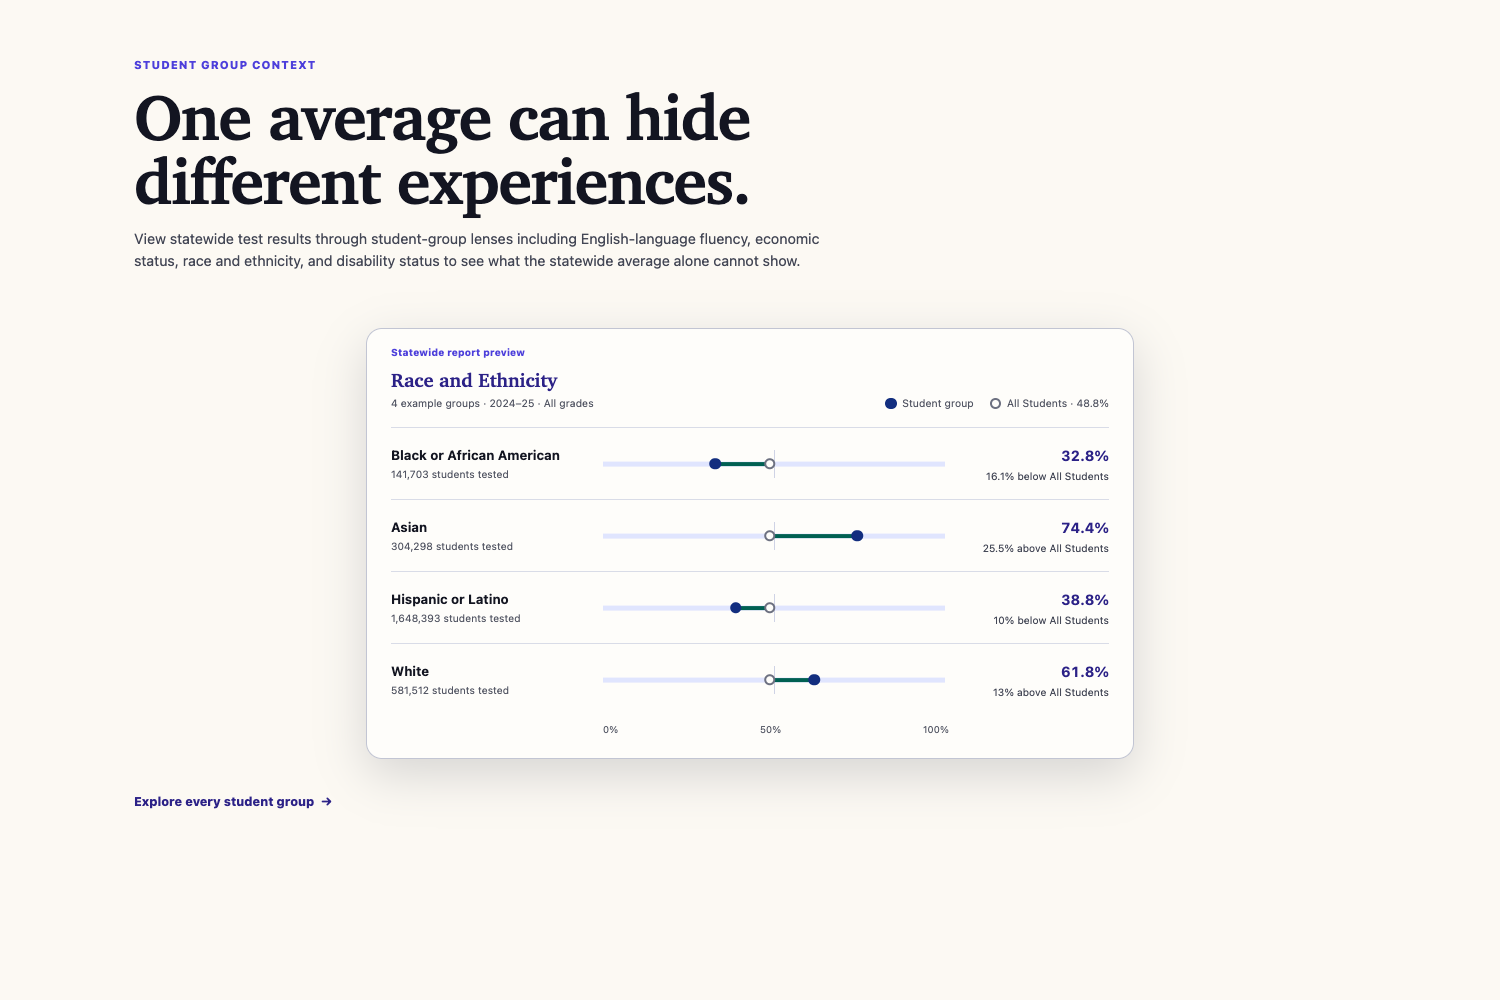
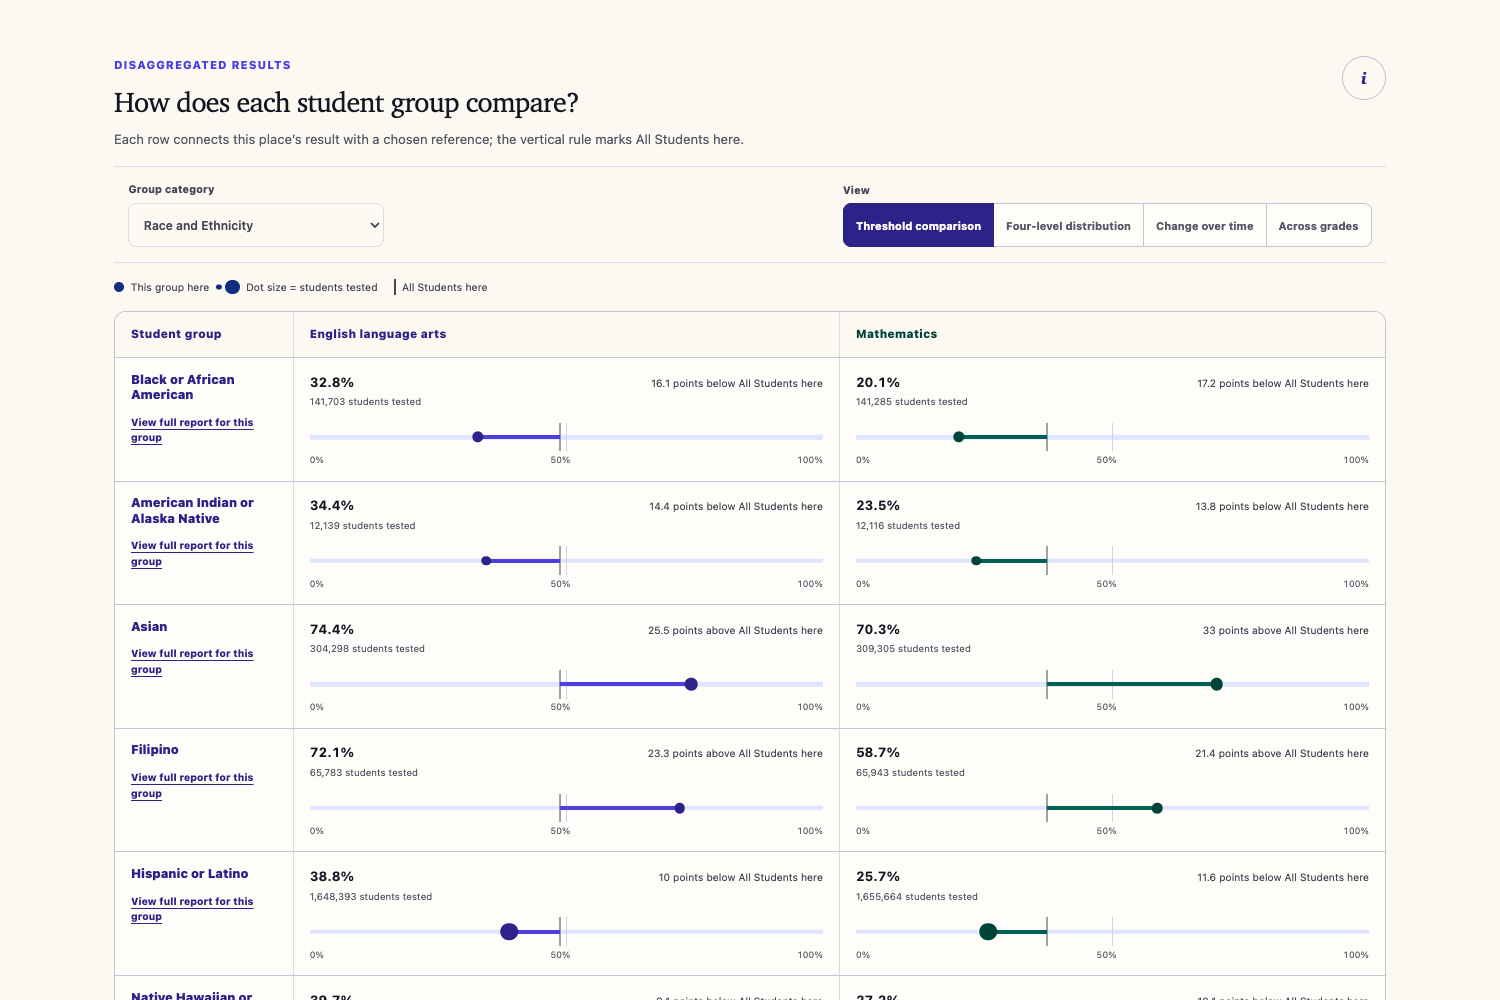
Student-group views let visitors compare published outcomes by race and ethnicity, economic disadvantage, English-learner status, disability, and other categories where the source data supports it, allowing communities to see exactly where educational gaps persist across the system.
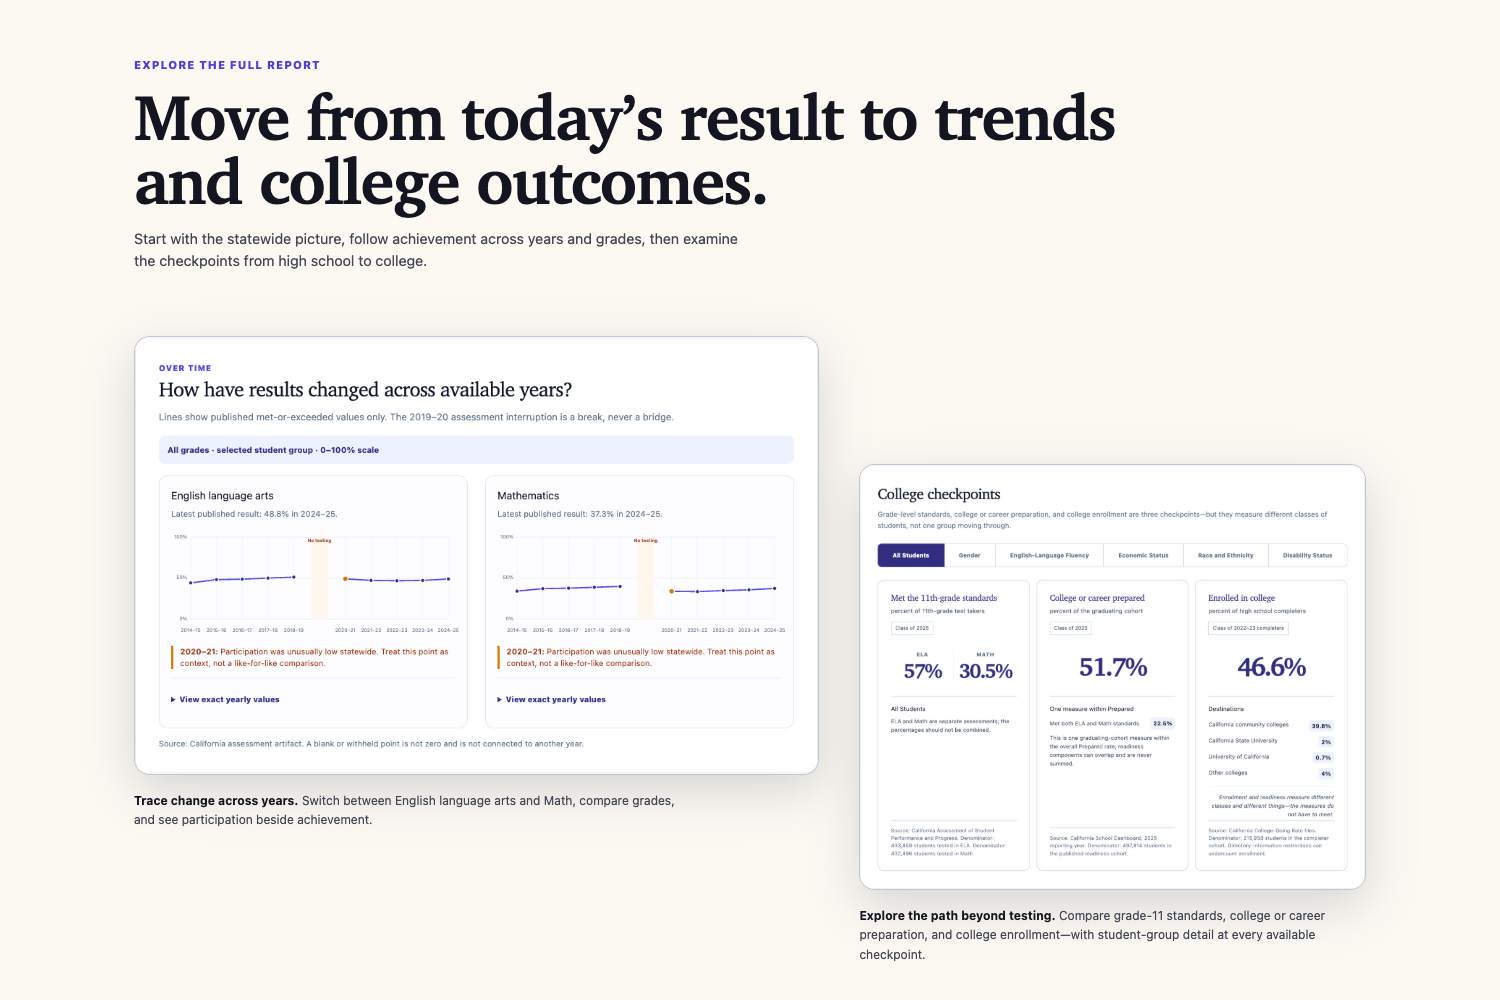
Instead of focusing on a single standardized test, the platform maps the educational journey across three checkpoints:
- Grade-11 proficiency: What share met ELA and mathematics standards? (CAASPP)
- Graduate readiness: What share were prepared for college or career? (California College/Career Indicator)
- College enrollment: What share of high-school completers enrolled within 12 months? (California College-Going Rate)
How we built it
We architected ScoreCA.org using an off-band data pipeline (a separate project) and a statically generated Astro website (this) to ensure speed and stability.
The website project began with a React mockup, the product requirements, and curated data artifacts. Codex with GPT-5.6 served as a development collaborator. Human review and direction remained part of every design and implementation stage.
Codex and GPT-5.6 helped with:
- Planning and architecture: translated the mockup and written requirements into the staged implementation plan.
- Astro scaffolding: established the Astro application shell and progressively implemented native home, state, county, district, school, methodology, metadata, and data routes.
- Data-layer integration: connected the Astro site to validated, versioned artifacts generated by the separate data pipeline.
- Interface implementation: turned the approved mockup into reusable report components, shared controls, and responsive layouts.
- Design-system work: consolidated colors, typography, spacing, selection states, section headers, information disclosures, and the logo into reusable tokens and components while preserving the user-directed visual design.
- Testing and diagnosis: exercised real entity routes in the browser, checked responsive layouts and interaction flows, investigated fixture and production-build issues from logs, and corrected data, overflow, navigation, chart, metadata, and accessibility defects.
- Build and release verification: ran scoped and full static builds, and verified production-oriented output and deployment documentation.
- Promotion materials: helped prepare the image gallery, demonstration script, and HTML-based product slideshow using screenshots of the completed application.
- Incremental delivery: kept changes in small, logical commits so data, routing, visualization, design, testing, and media stages can be reviewed independently.
Challenges we ran into
California publishes millions of education records across separate assessment, college-readiness, and college-enrollment datasets. The source material spans 2015–2025 and covers the state, 58 counties, hundreds of districts, thousands of schools, multiple grades, achievement levels, and dozens of student groups.
These datasets do not share one clean schema. They use different identifiers, reporting years, cohorts, denominators, and availability rules. We also had to preserve privacy-suppressed results, distinguish missing data from unpublished data, represent the 2019–20 no-testing break, and avoid comparing measures that describe different student populations.
The engineering challenge was turning this volume and variety into a fast, navigable website without flattening those important distinctions or requiring a production database.
Accomplishments that we’re proud of
ScoreCA begins with more than 36 million aggregate records from California’s assessment, college-readiness, and college-enrollment datasets. Recent annual assessment releases alone contain roughly four million rows. We transformed that volume into approximately 14,000 searchable reports, 18,000 structured data files, and 14,000 social-sharing cards.
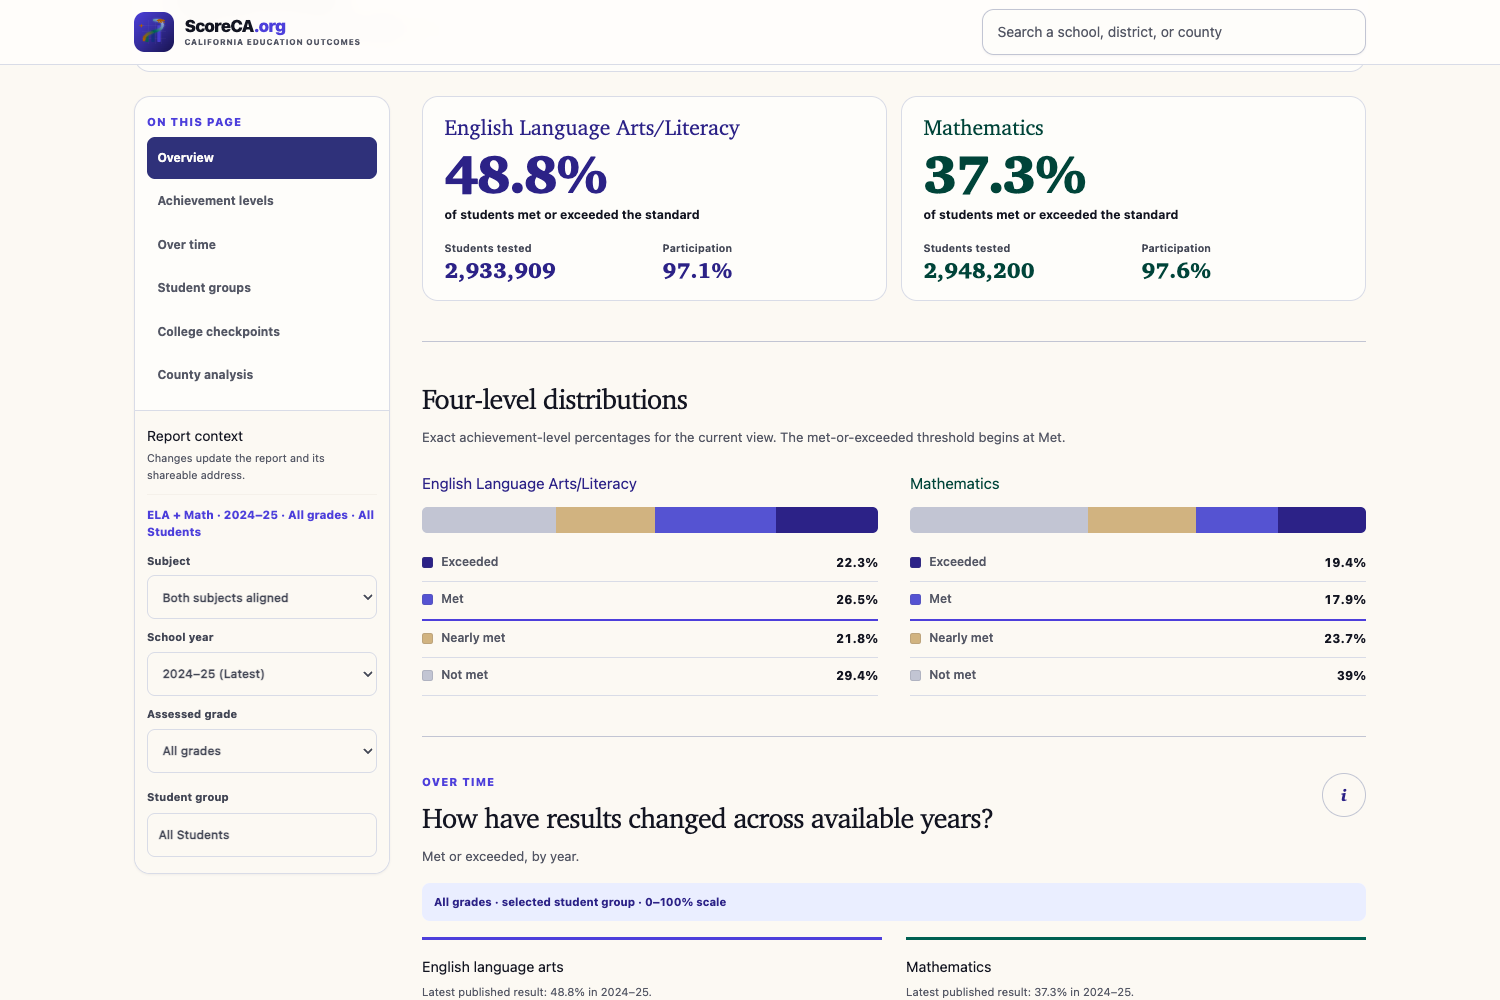
The resulting interface gives visitors accessible views of ELA and mathematics results, achievement distributions, trends, grade-level and student-group comparisons, college checkpoints, county maps, and population-based charts.
Most importantly, the site remains fast and fully static without sacrificing accuracy. Suppression states, missing values, testing interruptions, cohorts, denominators, caveats, and source provenance remain visible throughout the experience.
What we learned
We learned that combining education datasets is less about joining tables and more about preserving the meaning of each measure. Assessment, readiness, and enrollment use different cohorts, denominators, reporting periods, and privacy rules. Making those distinctions understandable became as important as building the charts themselves.
What's next for ScoreCA.org
This is just Phase 1. Now that the multi-metric artifact and off-band data pipeline are stable, our next steps include:
- Expanding the survey by integrating higher education downstream data to show what happens to students once they reach the California college system;
- Leveraging AI to provide natural language data discovery.
Built With
- astro
- california-open-data
- codex
- css
- gpt-5.6
- html
- react
- typescript

Log in or sign up for Devpost to join the conversation.