-
-

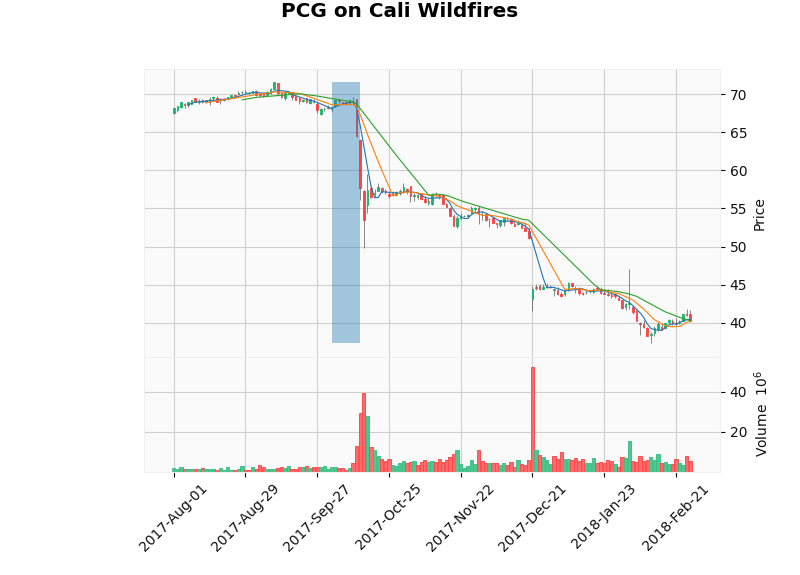
PCG during California wildfires 2017
-
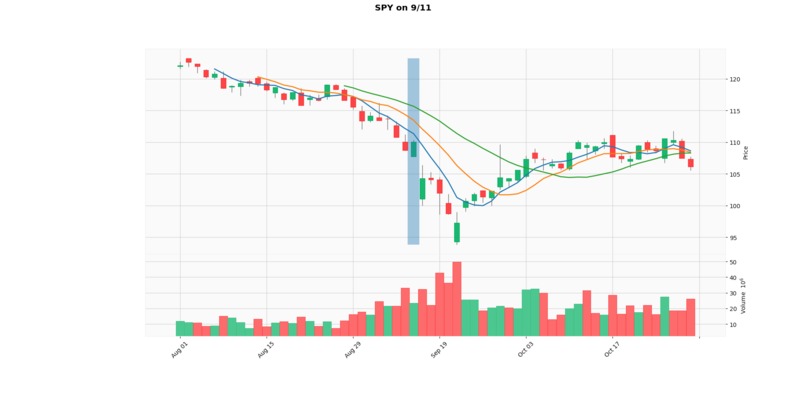
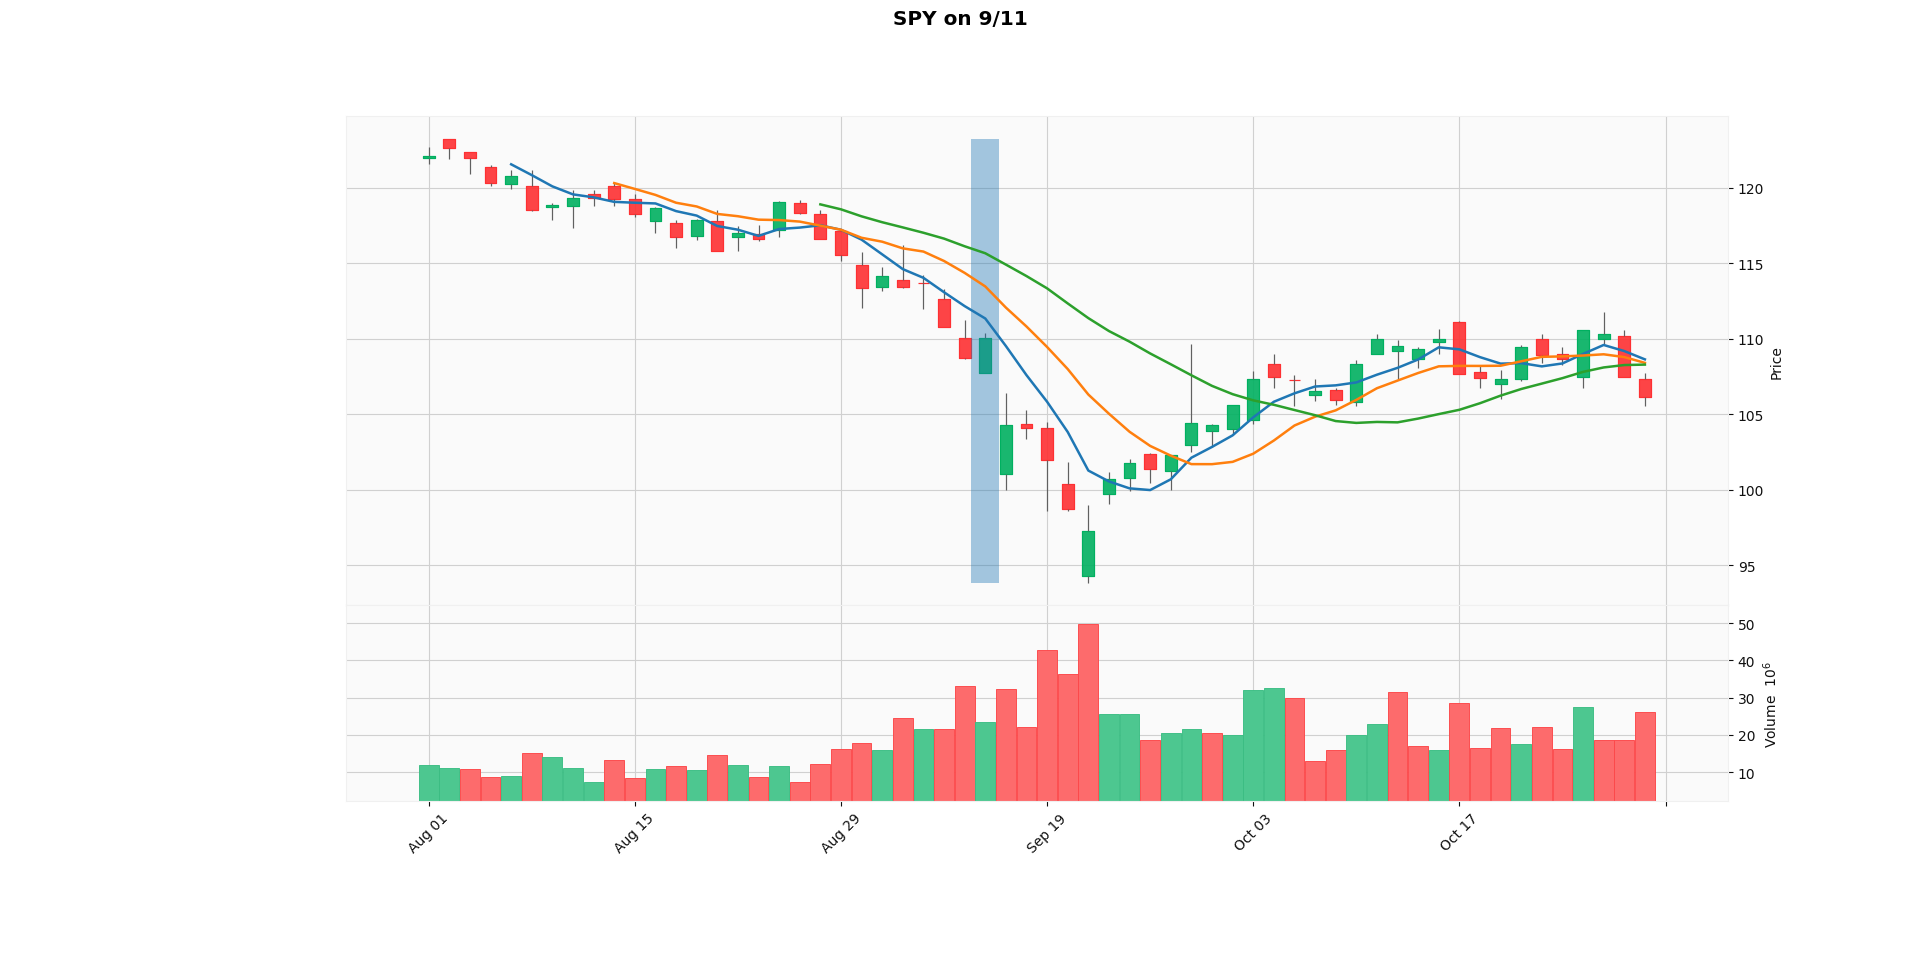
SPY during 9/11
-
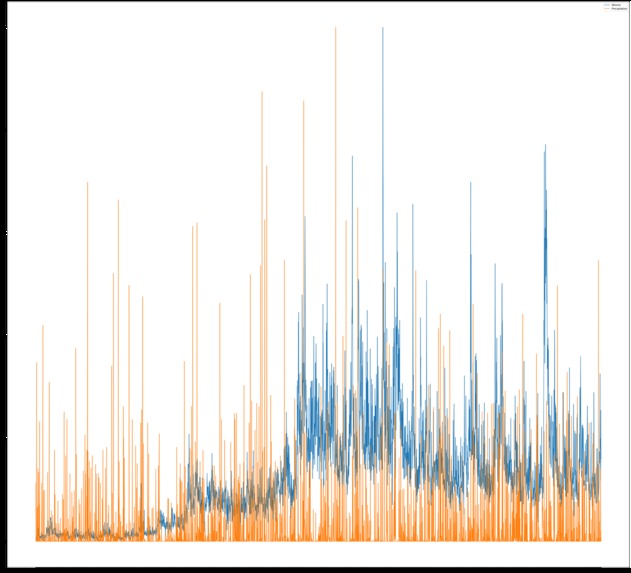
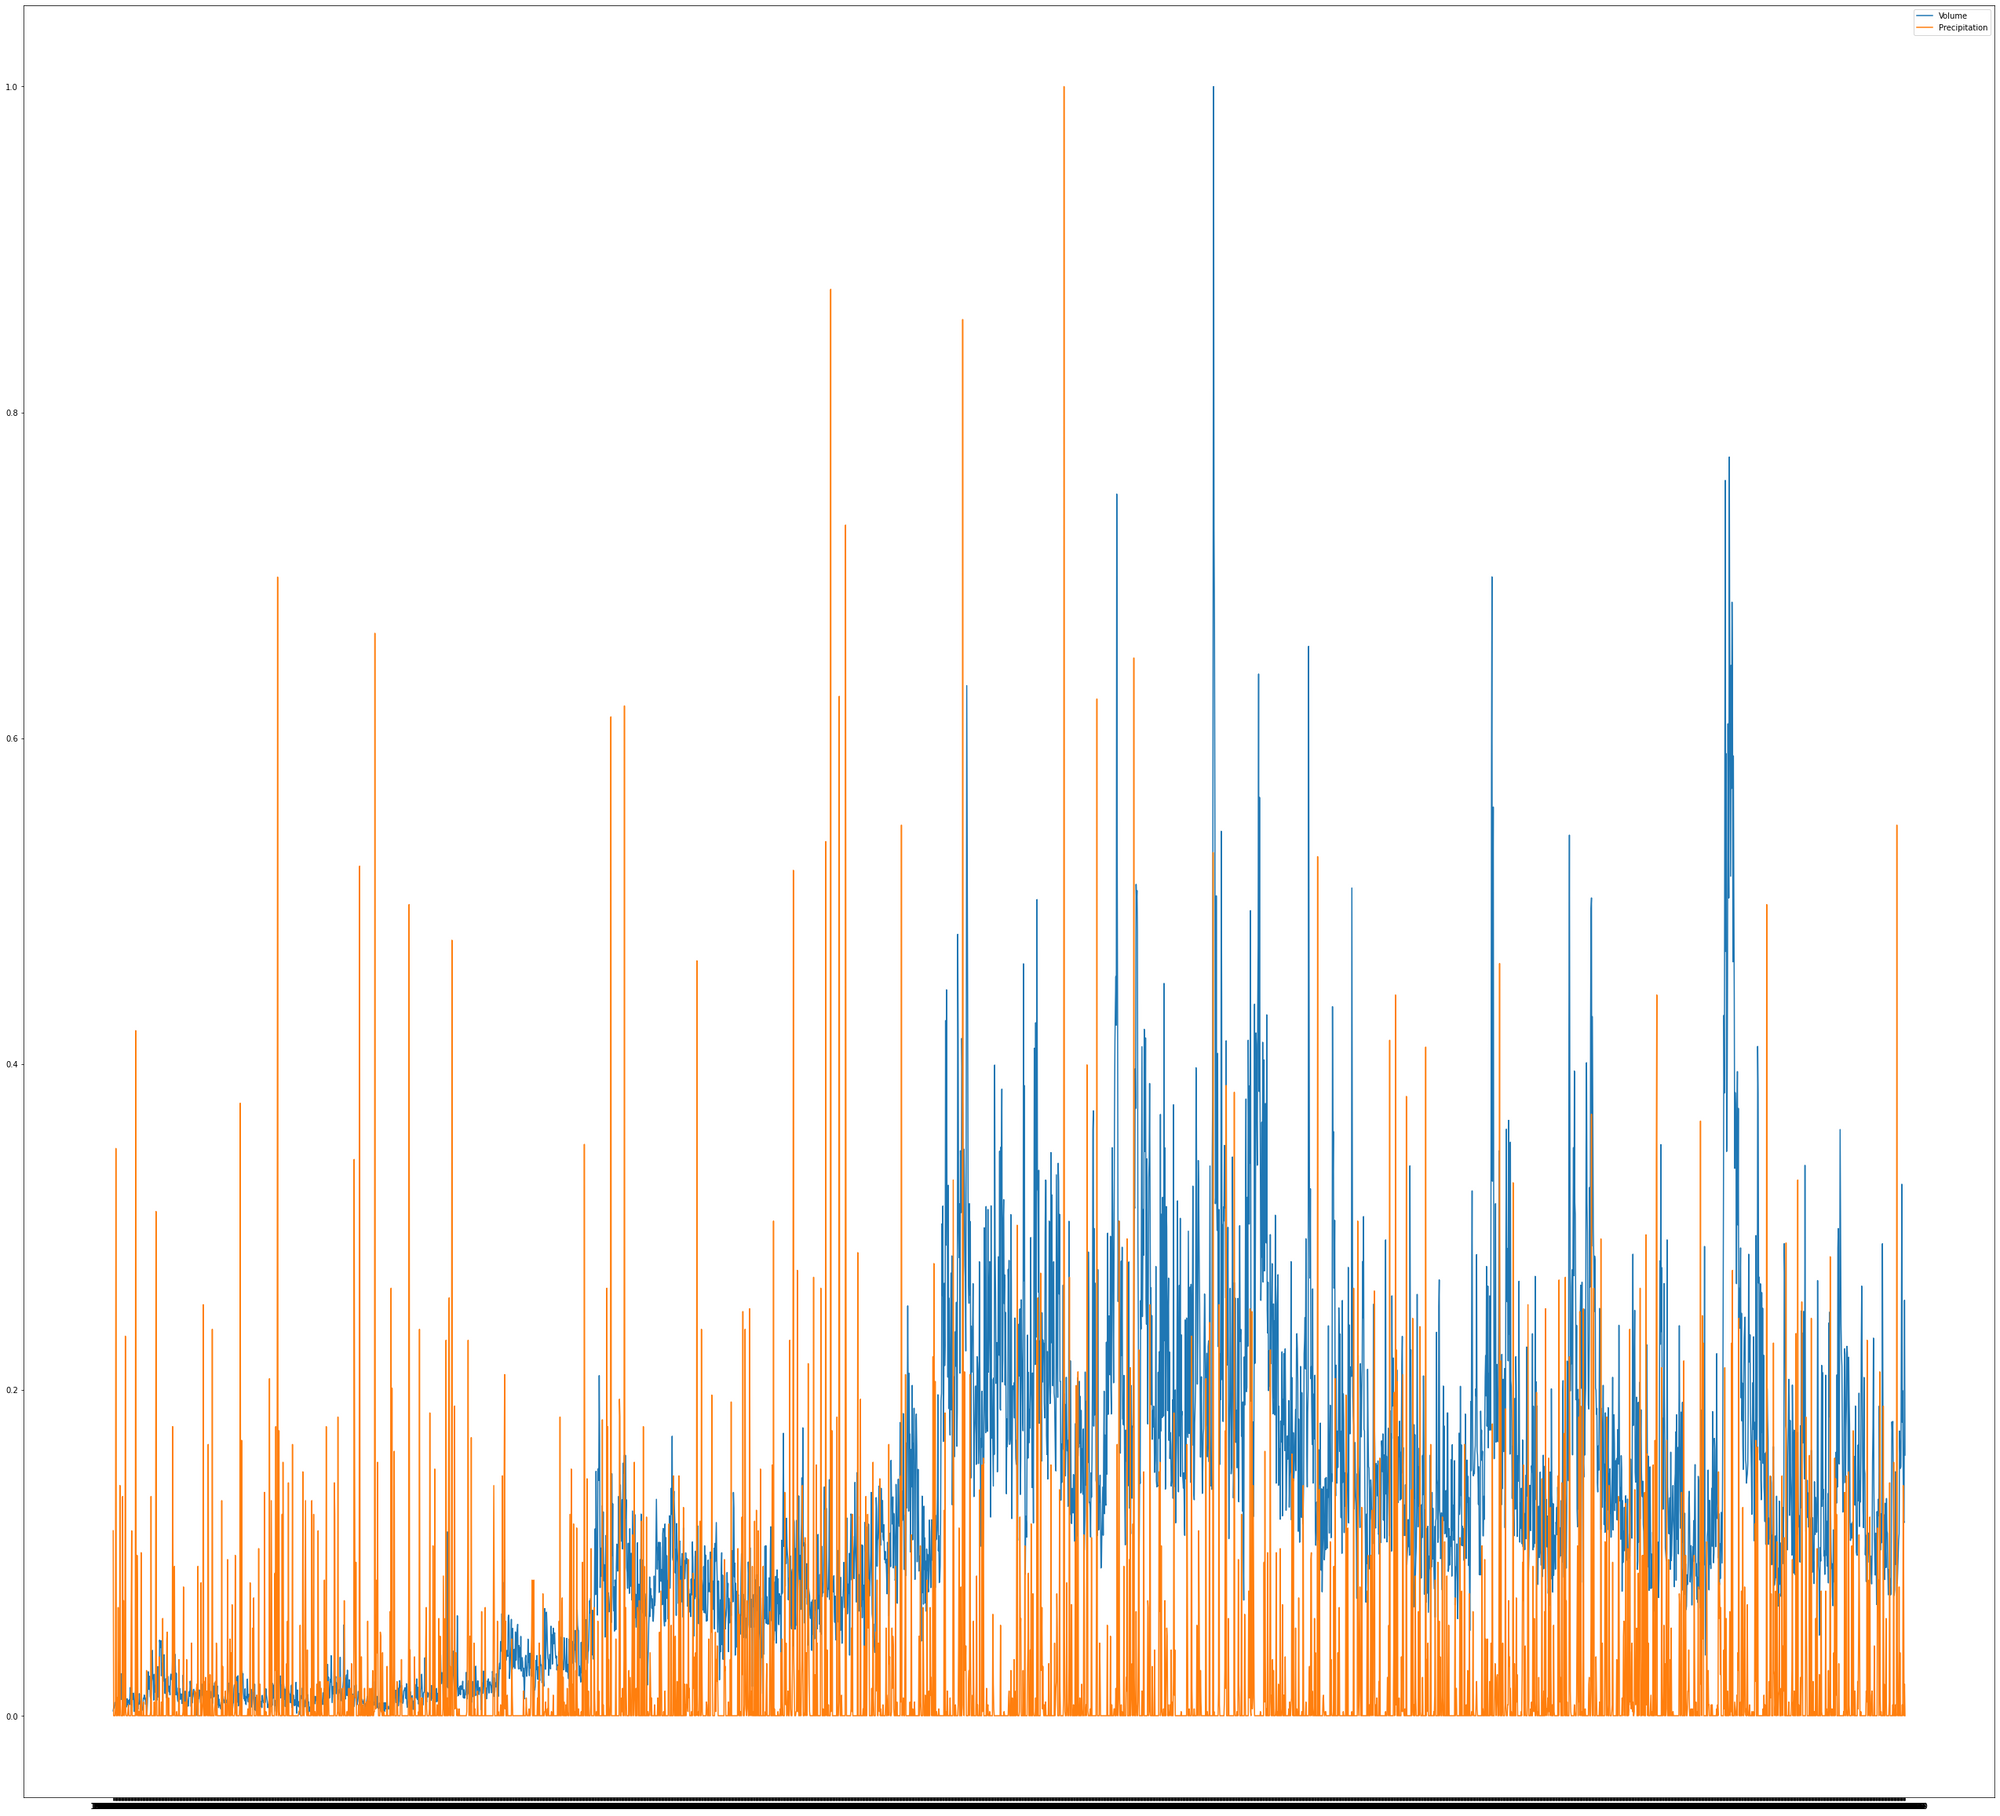
Daily precipitation and trades
-
Correlation between environmental factors and stock prices
-
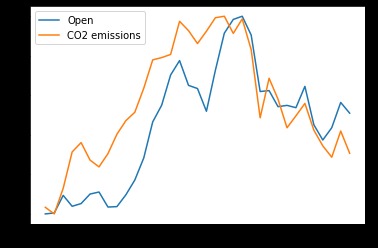
Strong correlation between BP stock prices and carbon emissions


Nostradamus: Weathering Worth
Our study explores the relation between the stock market, its volatility, and behavior versus weather conditions, environmental factors, and natural disasters. The objective is to establish correlations between such factors and the value of stocks and volume traded, so as to enable accurate modeling and interpretation based on the data.
Sources
US stock market data
- ZEPL US Stock Market Data for Data Science
- yfinance API
Environmental Data
- Knoema Environmental Data Atlas
- NOAA Climate Data Online
Finding Correlations with Environmental Factors
From our environmental data-set, we first analyze the factors that can affect stocks or the other way: companies have an effect on these factors.
For example, the following environmental factors were present in our data-set, among others:
Use of potash
Methane emissions
CO2 emissions
Terrestrial and marine protected areas
CO2 emissions from gaseous fuel consumption
CO2 intensity
Use of nitrogen
Correlating with Stocks
We considered all these environmental factors and some example stocks.
We plotted the yearly average open prices of these stocks. We also plotted the yearly value of these environmental factors.
Along with the plots, we also found out the value of correlation between the average yearly opening prices and the yearly value for the environmental factors.

where rxy is the value of correlation (or the correlation coefficient) between x and y.
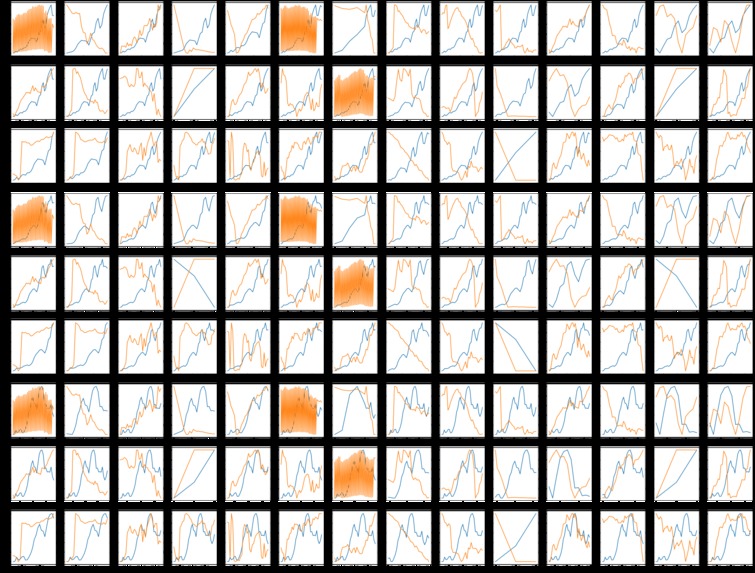
Here are the results:

Here, we have normalized values of Open, Close and Volume of several stocks contrasted with normalized values of several environmental factors, meant to depict whether there is any sign of possible correlation.
Inferences
Some of the correlation values were extremely low (including negative values). And some of the values were very high.
What can we infer from these values?
Strong Correlations
High values of correlation usually mean that there is an interdependence (Strong Correlation) between a stock and an environmental factor.
Consider the stock BP (British petroleum Company) and the factor CO2 emissions:

These have a high correlation value of 0.8159. We know that BP is an oil and gas company. Hence, it is very sensible reasoning that the company's production has a direct effect on the CO2 emission.
Hence, we can infer that CO2 emission values are affected by BP's stock.
Causation not equal to Correlation.
It is not always true that a high value of correlation means that there is an interdependence between the stocks.
Consider the stock AAPL (Apple) **and the factor **CO2 emissions from gaseous fuel consumption:

These two have a high correlation of 0.93.
We know that Apple (a tech company), is obviously not dependent on CO2 emissions from gaseous fuel consumption. In spite of that, it has a high correlation with that factor. This is not a result of dependence between the two things. The high correlation is simply a coincidence as CO2 emissions from gaseous fuels are rising because of the rapid population growth and because nuclear and other clean energy sources are not very prevalent.
Hence Correlation is not always a result of Causation.
Hidden Correlations
Sometimes, a stock and a factor that seem unrelated have a high correlation.
There are two possible explanations for this:
- It is a coincidence (as shown above)
- Or it has a hidden correlation
Consider the stock EOD (Wells Fargo Global) and the factor CO2 emissions. This has a high correlation value of 0.927.
On first thought, it seems like Well Fargo Global, a finance company is unrelated to CO2 emissions. However, it is likely that there are hidden correlations due to dependencies of carbon emissions on an industry which also determines whether the prices of companies that own/invest in the same.
This means large companies such as large banks and firms. Hence, this high correlation is very likely not a result of coincidence but a result of purposeful investing/decisions taken by the company.
Low Positive Correlations
A low positive correlation usually means that the stock and the environmental factor in consideration are independent of each other.
Consider XOM and Agricultural Methane Emissions. This has a low correlation of 0.234. Hence, we can most of the time conclude that these two are independent of each other.
In rare cases though, they could be dependent and still have a low correlation.
Highly Negative Correlations
Highly negative values of correlation usually imply an inverse effect between the company's production/success and the factor in consideration.
Consider the volume of the stock CVX (Chevron Corporation) **and the factor **Terrestrial and marine protected areas. This has a highly negative correlation of -0.899. It is fair to assume that when the number of terrestrial and marine protected areas increases, the volume of the stock CVX, which is an energy industry decreases.
Hence, a highly negative correlation value means inverse dependence.
Predictions

The global emission levels are predicted to be stranded due to growing awareness about climate change and a noticeable switch to renewable sources as primary energy sources.
As we earlier saw the high correlation between the carbon emission levels and the stock price of BP, it can be analyzed that in coming times the stock price of BP and other large oil companies will begin to fall. This also means that there will be a rise in the stock prices of companies that provide an alternative source of fuels such as solar panels and windmills.
Natural Disasters
We will also explore what kind of effect Natural Disasters have on stock values.
- California Wildfires: PCG and EIX correlations
- Katrina Hurricane: Rise of KMX
- Texas Storm: Fall of NRG
- 9/11 Disaster: S&P 500 crashes 14%
Daily weather and Daily trades: No Correlation

Precipitation and Volume were plotted over a very large period. These two have a correlation of $0.0338$, which can be analyzed as no correlation.
It can be seen that there is no correlation between volume and precipitation. Due to the availability of the stock market electronically, trades can be made from anywhere. This pattern is new, but before the availability of the stock market on electronics, the trades had to be done in a building to which people traveled.
Future Work
The data has been analyzed so far which has us given some insights, it can be used to build upon for prediction and more analysis for determining the effect of stocks on future natural events.
Once the prediction model has been built, it can be used to analyze environmental factors. For example, when we compare the predicted value of a stock to its actual value, and there is a big difference at some point, it implies that some kind of environmental factor affected that stock at that point.
Repeated events
Events such as hurricanes and heatwaves recur periodically. Due to rising climate change, they will only become more frequent. This means that past analysis on such events will help us determine the kind of impact it will happen on the companies it had an impact on.
Conclusion
This analysis has revealed that there are correlations underlying between the stock value and the environmental factors such as weather and natural disasters. Further, major events which were unpredictable but aren't natural causes also have a heavy effect on the market. It can also be seen that the increase in supply and demand had a direct impact on the market stock, along with which there was an impact on environmental factors such as carbon emissions.
There are cases that have been explained where the impact of a natural disaster first hit the company which had a direct link to the resources that were lost followed by a loss in the companies that depended upon the primary companies after a delay.
The data can be understood and analyzed with graphs and other tools, predictions can be made with the help of machine learning models which could be trained on used in a case such events are repeated again.
Built With
- python
- yfinance


Log in or sign up for Devpost to join the conversation.