Inspiration
Infographic browser-based visualisations of data.
What it does
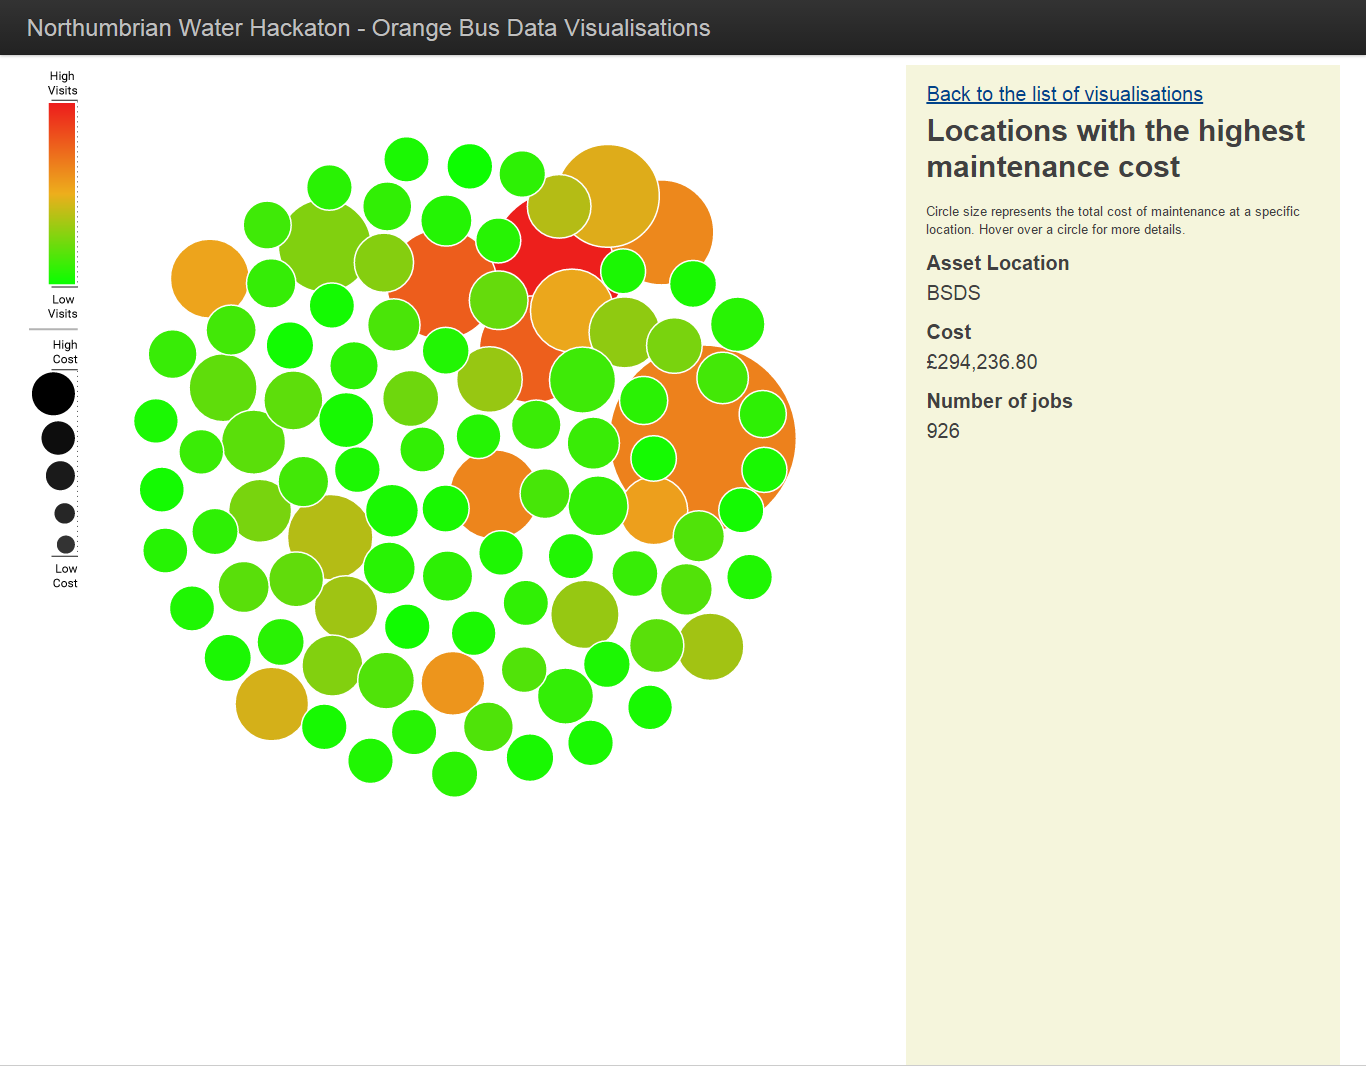
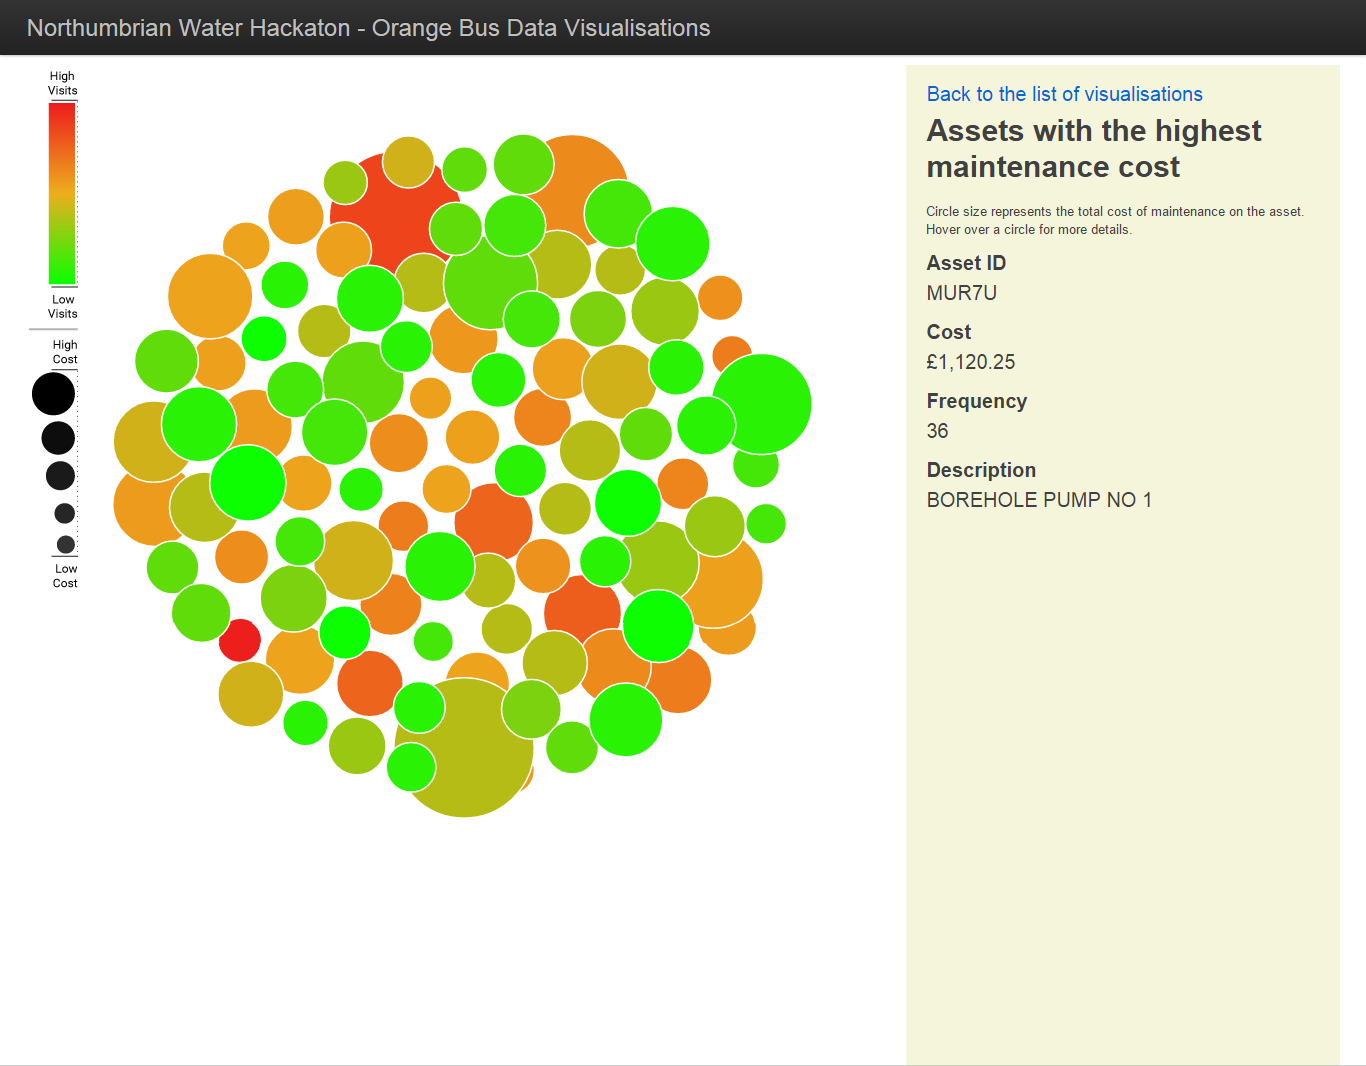
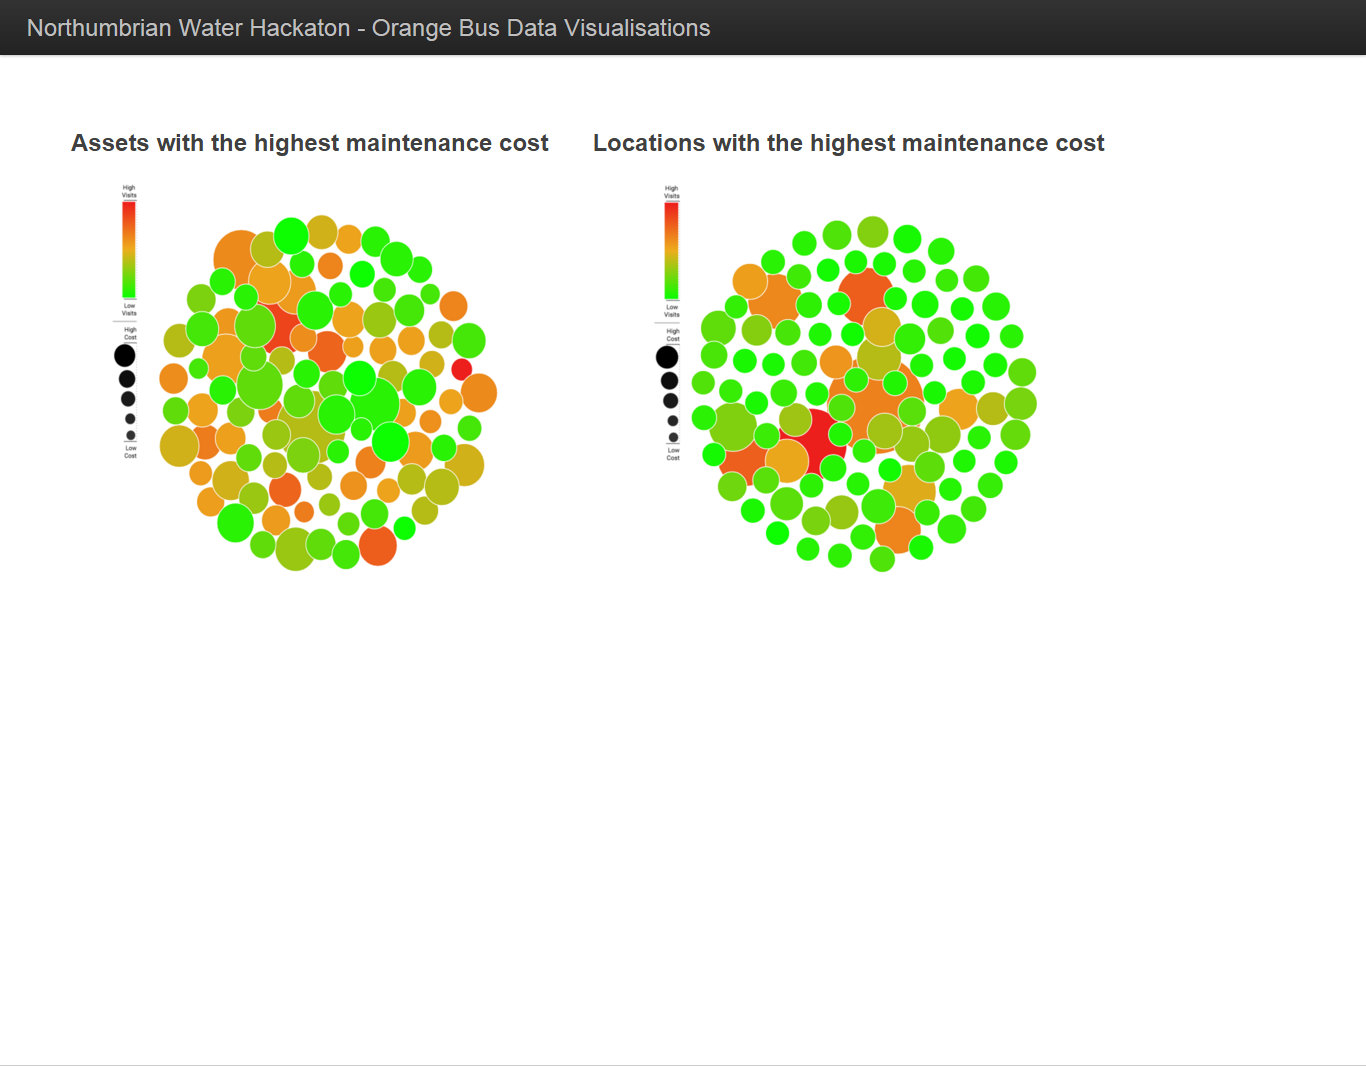
Surfaces information from various sources and displays in a meaningful manner.
How we built it
Imported data into MSSQL database and developed queries to link data in meaningful ways. Developed application to convert data into form browser manipulation (JSON). Developed Javascript based application to visualise data.
Challenges we ran into
Data was fragmented into different sources with no easy way to link them. Data was of poor quality.
Accomplishments that we're proud of
Creating end-to-end proof of concept (from xlsx to browser visualisation).
What we learned
Need more structured data sources for computer processing (not human readable sheets)
What's next for Northumbrian Water Data Visualisation
Filtering and sorting of data - allowing specific queries. Different types of visualisation to explore added value.
Built With
- d3.js
- javascript
- play-framework
- scala


Log in or sign up for Devpost to join the conversation.