NorthStar
NorthStar predicts crowd bottlenecks, tests safer responses in a digital twin, and recommends a low-disruption plan. Built for stadiums; the same loop fits transit, festivals, and other dense crises.
Inspiration
Crowd disasters rarely start as a mystery. They start as a queue that operators can see, plus a second queue they cannot see yet: the one that forms five minutes after a gate closes, a train is delayed, or a corridor is reversed.
Most venue tools show the present. Staff still have to guess where density will go, which response will help, and whether that response creates a new crush somewhere else. We wanted a system that answers those three questions in time for a human to act, without ever taking control away from that human.
We grounded the first demo in a stadium after a match: 4,000 people, 24 sections, eight exits. The same decision loop is the point of the project, not the sport. If you can detect, forecast, simulate options, and recommend, you can reuse it at a festival, a metro interchange, or any other high-density site.
What it does
NorthStar is a human-in-the-loop digital twin for crowd egress.
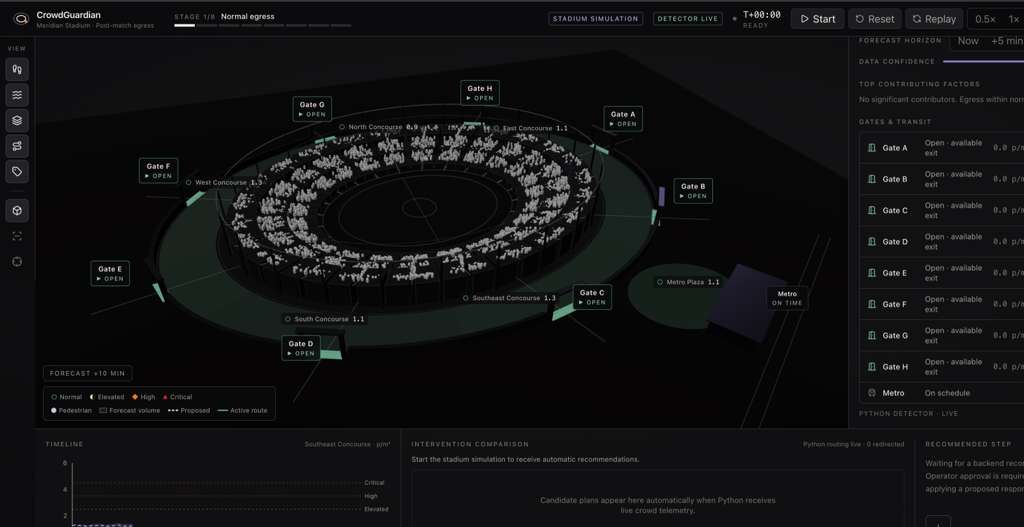
- Simulates 4,000 persistent people leaving a stadium through eight operator-controlled gates.
- People walk a real path: seat row, aisle, base path, gate corridor, FIFO queue, then outside. They do not teleport. An exited person never respawns.
- Streams every person to Python once per second. Python measures density, queue, speed, and throughput at all eight approaches. Congestion has to persist before it is raised, and stay clear before it is dropped.
- Python owns routing. It returns only the people whose gate should change, with a reason and estimated time saved. The 3D view executes those assignments. If the backend is down, the stadium still runs and never fakes a detection result.
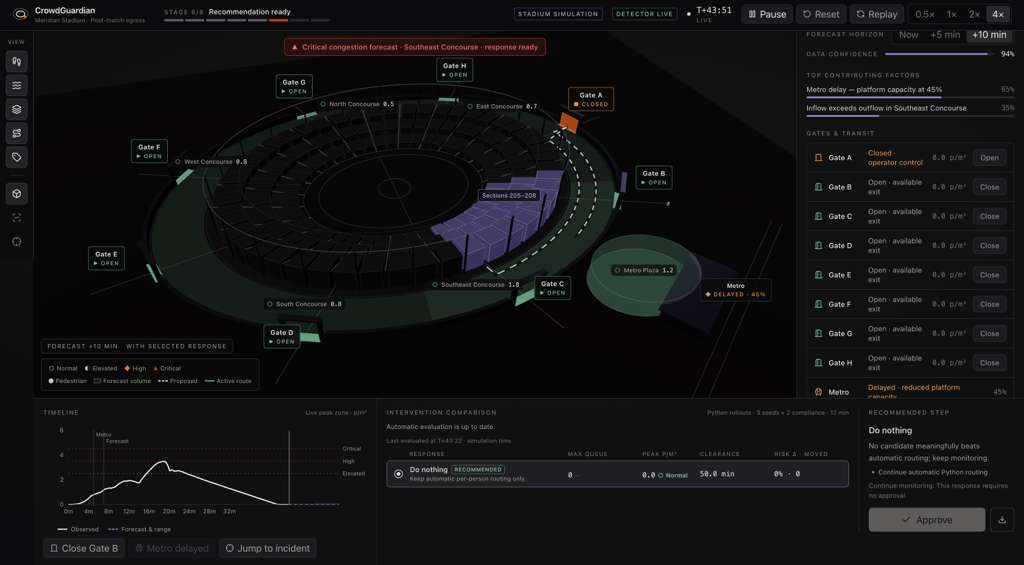
- Forecasts 5- and 10-minute zone density from the live stream. A trained gradient-boosted model is used when present; otherwise an explainable mass-balance baseline.
- Lets the operator evaluate responses. Python clones the current crowd, rolls out do-nothing, section redirects, metered release, and combinations across seeds and compliance, then ranks them. Plans that create a second bottleneck are rejected.
- The operator approves. The live twin applies the plan. A run can be exported for review.
On 100 reproducible closure runs, Python routing cut mean clearance from 11.8 minutes (closed, no guidance) to 8.9 minutes, against 8.2 minutes with all gates open. The GBM 5-minute density forecast beat both the baseline and a persistence model on a held-out set of runs (test MAE 0.068 vs 0.69 vs 0.33).
How we built it
The frontend is React, TypeScript, Vite, React Three Fiber, and Zustand. The 3D stadium is the operator console: playback, gate controls, live risk, timeline, and approval.
The backend is FastAPI and NumPy. A Python twin ports the browser crowd model with the same seeded RNG and draw order, so dataset runs and counterfactual rollouts match what the operator sees. Shared geometry lives in one file, shared/stadium-config.json.
The live path is a WebSocket: React sends a full 4,000-person snapshot; Python replies with congestion, routing deltas, twelve zone states, and forecasts. REST endpoints on that run_id evaluate interventions, approve a plan, and export the run.
We generated a 100-run CSV dataset (normal, single closure, multi closure, reopen) with 30-second zone telemetry, then trained an optional scikit-learn GBM with a grouped split by run so the model never sees the future of the same crowd.
Routing itself is not ML. Cost is walking time, queue wait, density, and congestion, in seconds, with cooldown so people do not oscillate.
Challenges we ran into
Keeping two twins honest was harder than drawing a stadium. The browser model and the Python model had to share seed, phases, queues, and gate service, or the forecasts and rollouts would be theater.
Putting routing in Python meant the UI could not keep choosing gates on the side. We had to send assignment deltas, execute them in 3D, and fall back cleanly when the socket dropped.
The dashboard still had a scripted mock clock and overlay. Wiring live forecasts and live intervention tables without breaking the existing operator layout took more care than adding a new page.
Windows WebSockets failed until uvicorn[standard] was actually installed. CI then failed after we slowed walking speed for the demo, because tests still expected people to exit by minute four. We had to separate “looks good in the demo” from “the tests assume the old physics.”
The dataset and trained model are large and generated, so they stay off GitHub. Teammates have to regenerate them after pull. That is the right engineering choice and a painful demo instruction.
Accomplishments that we're proud of
- A closed loop that is actually closed: telemetry, detection, routing, forecast, rollout, approval, execution.
- 4,000 identities conserved. No respawn. No silent missing people.
- Routing that explains itself: who moved, from which gate, why, and how many seconds it was supposed to save.
- A 100-run dataset with a before/after table, not a single cherry-picked GIF.
- A forecast model that had to beat a dumb baseline on unseen runs, not just fit the training set.
- A recommendation the operator can reject. The system does not flip gates on its own.
What we learned
Show the present, then the next ten minutes, then the options. If those three disagree, operators will not trust any of them.
Deterministic routing is the right first brain. Machine learning helped the forecast once we had run-level data and a leakage-safe split. It would have been the wrong way to assign gates on day one.
A digital twin is only useful if the counterfactual is the same physics as the live view. Porting the crowd model to Python was the unglamorous work that made Evaluate responses real.
Human-in-the-loop is not a disclaimer at the bottom. It is the product: rank the plans, show the secondary bottleneck, wait for approve.
What's next for NorthStar
Calibrate gate capacities and density thresholds against documented venue assumptions, not prototype defaults.
Reuse the same detect–forecast–rollout–approve loop on other dense sites: arenas, festivals, stations, campuses. The stadium is the first map, not the only one.
Add a compact telemetry protocol if full 4,000-person snapshots become a bottleneck, keep run export for after-action review, and keep a human on the final action.
Built With
- docker
- fastapi
- github
- html
- javascript
- node.js
- numpy
- playwright
- pydantic
- pytest
- python
- react
- react-three-fiber
- recharts
- scikit-learn
- tailwind-css
- three.js
- typescript
- uvicorn
- vite
- websockets
- zustand


Log in or sign up for Devpost to join the conversation.