-
-

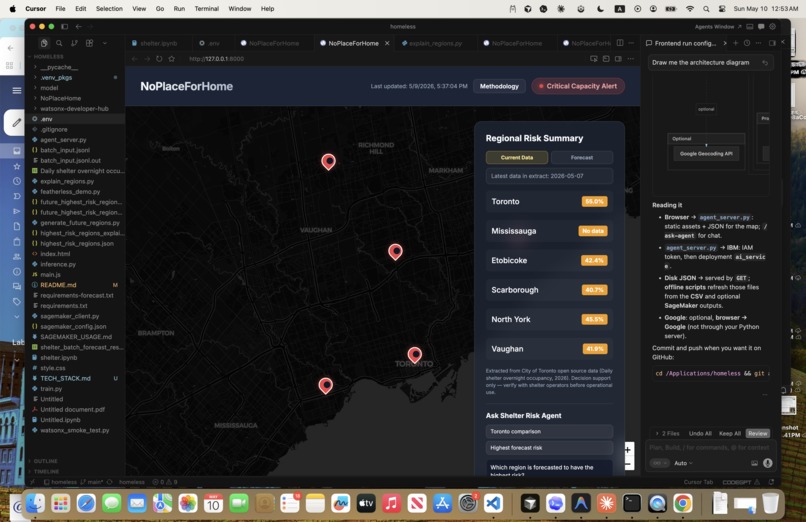
Forecast
-
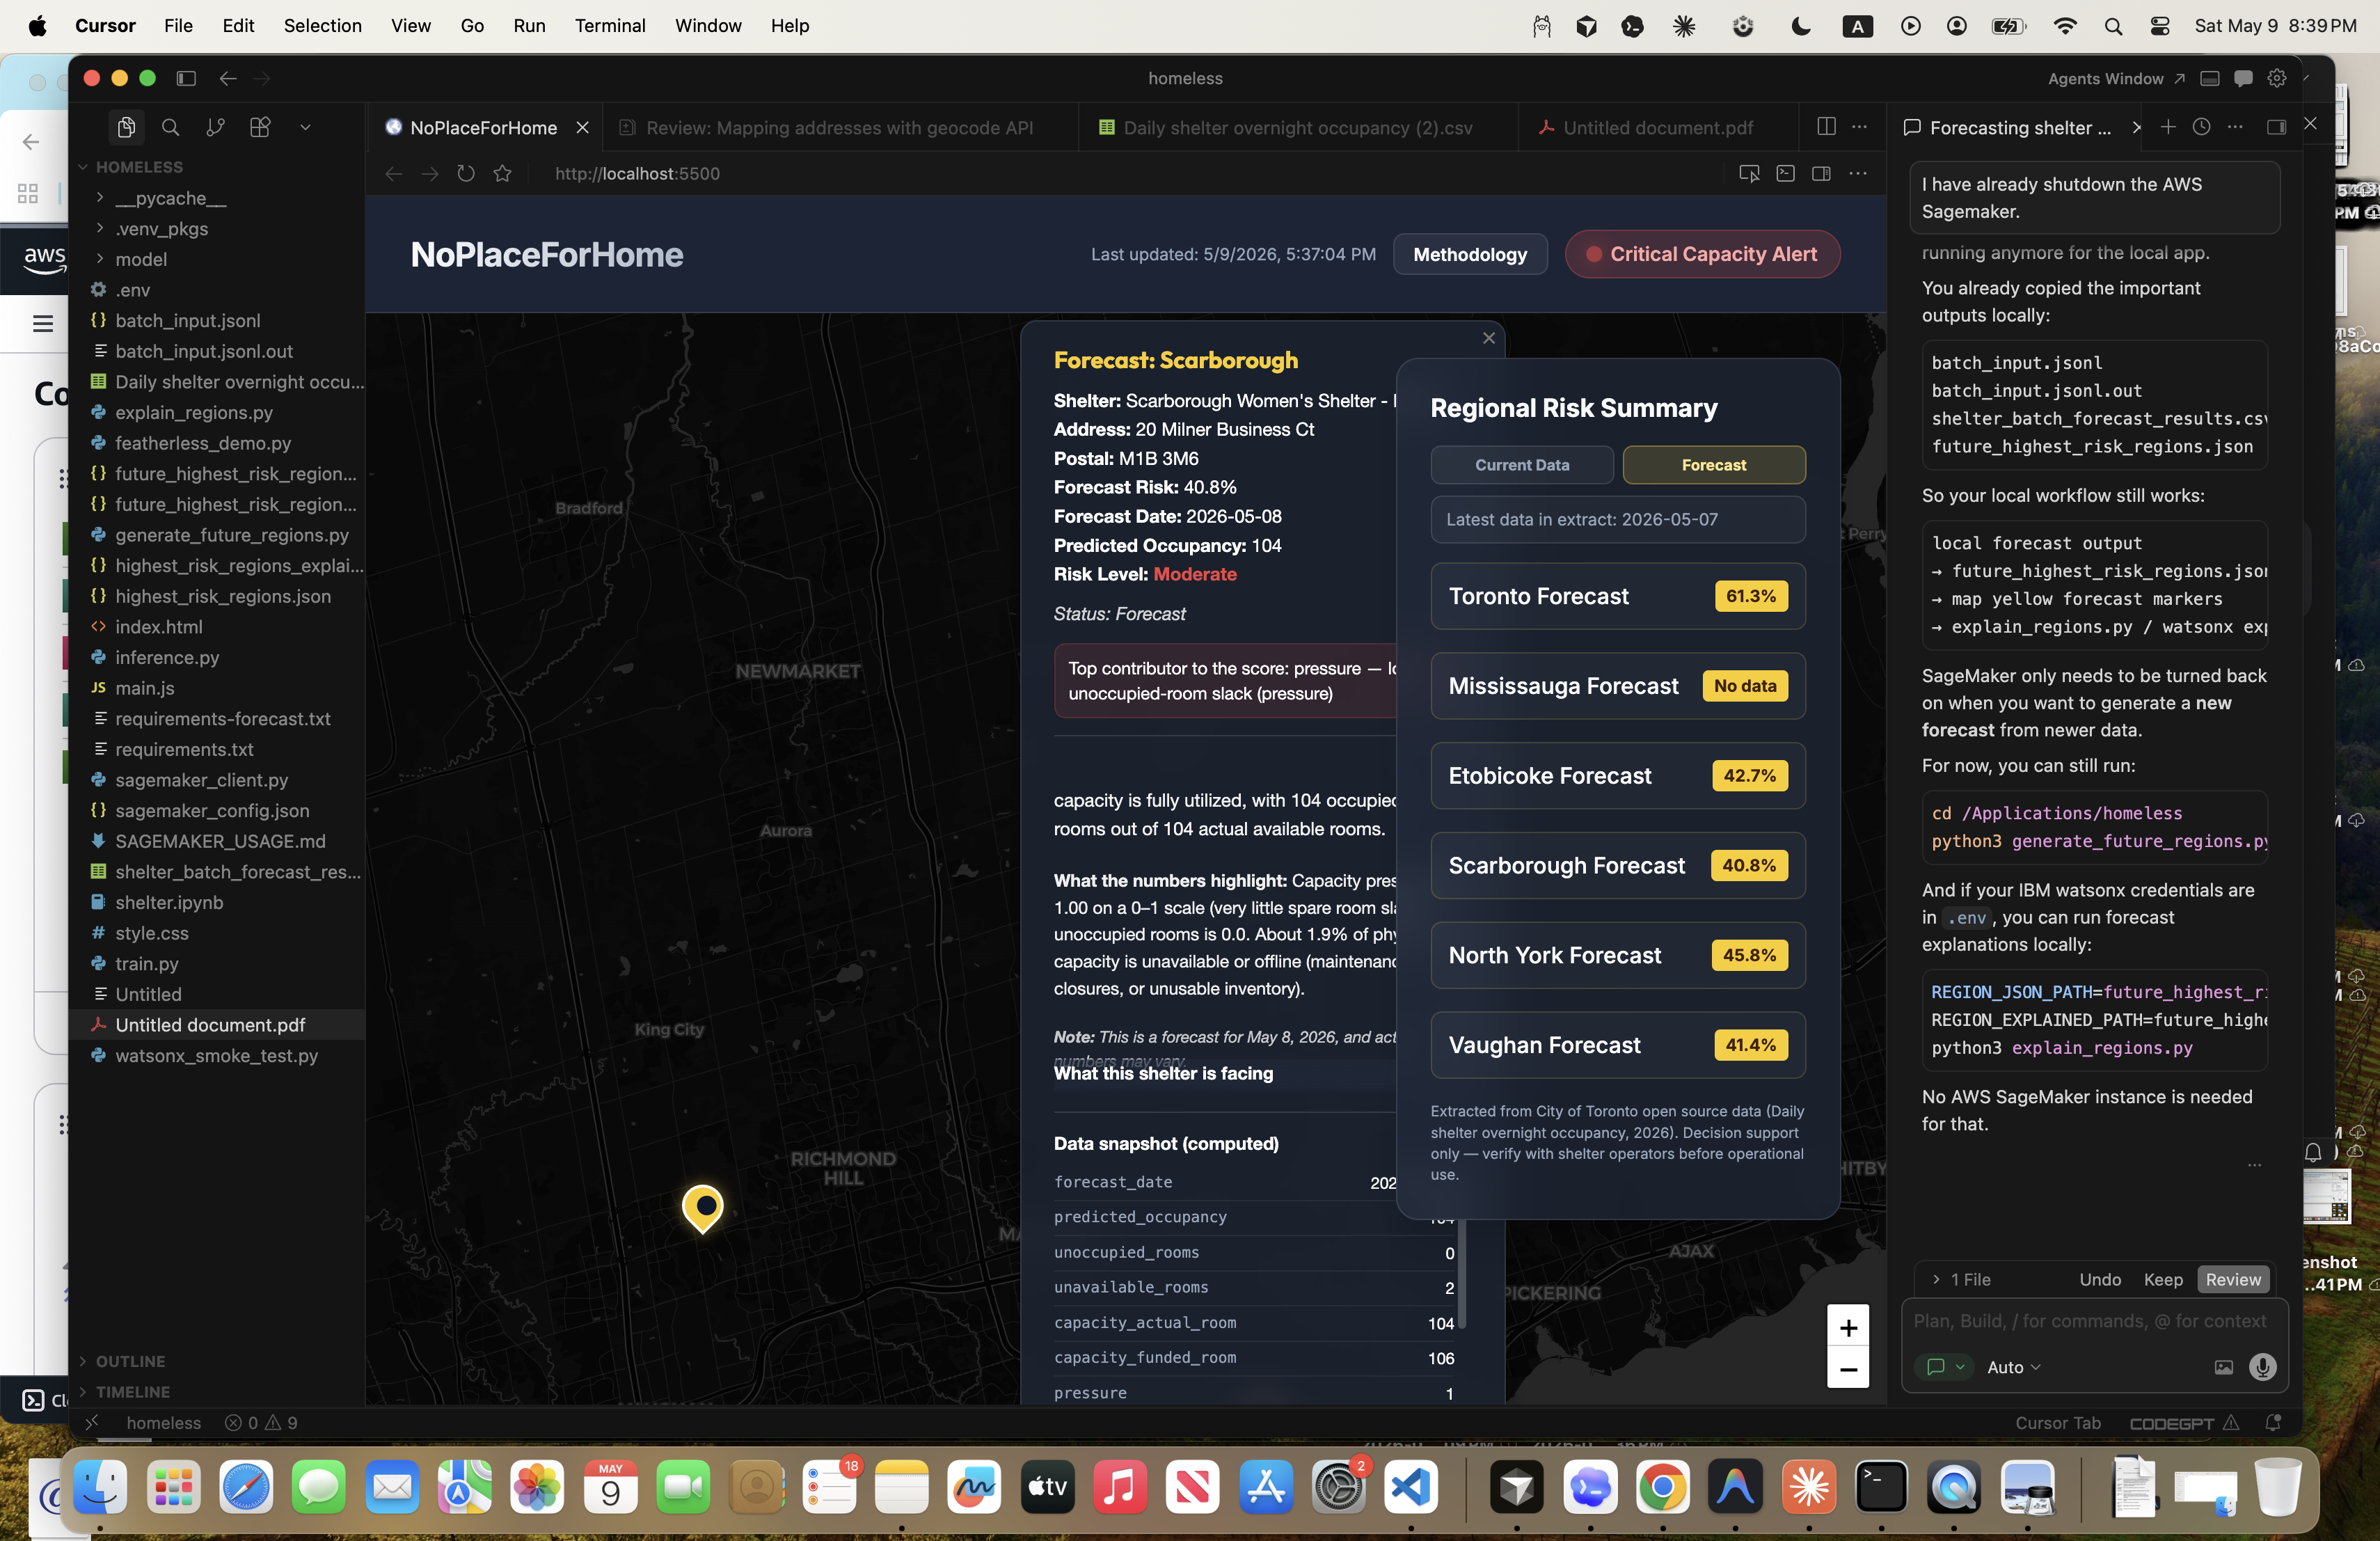
Frontend View
Inspiration
Seeing many unhoused individuals on the streets of the GTA struggling to find shelter, especially during harsh weather conditions, highlights a critical gap in shelter capacity and resource allocation.
What it does
NoPlaceForHome — an all-in-one platform designed to help municipal governments proactively monitor homeless shelter availability and identify shelters that are at high risk of running out of space.
Our platform focuses on six GTA regions using open-source data provided by the City of Toronto. From this data, we identify one shelter in each region that currently has the highest risk of losing vacancy for vulnerable populations.
Each shelter is represented with a visual risk icon. These icons quickly communicate the shelter’s current risk level and whether conditions have remained stable, improved, or worsened over recent days. Beyond that, the platform also analyzes the likely root cause behind the risk and explains the reasoning in a clear and understandable way.
Users can also access a data snapshot for each shelter location. This helps municipal staff understand the shelter’s current situation through metrics such as:
Unavailable, representing occupied rooms, Funded, meaning approved rooms available for residents, and Capacity, which represents the shelter’s total room availability.
One of the key features of NoPlaceForHome is forecasting. The platform predicts future shelter risk levels beginning one day after the latest available data and extends projections for up to one week ahead. This allows governments to anticipate shortages before they happen and respond earlier.
Clicking on any shelter icon opens a detailed popup containing the same risk insights, trends, and forecast information in a more interactive format.
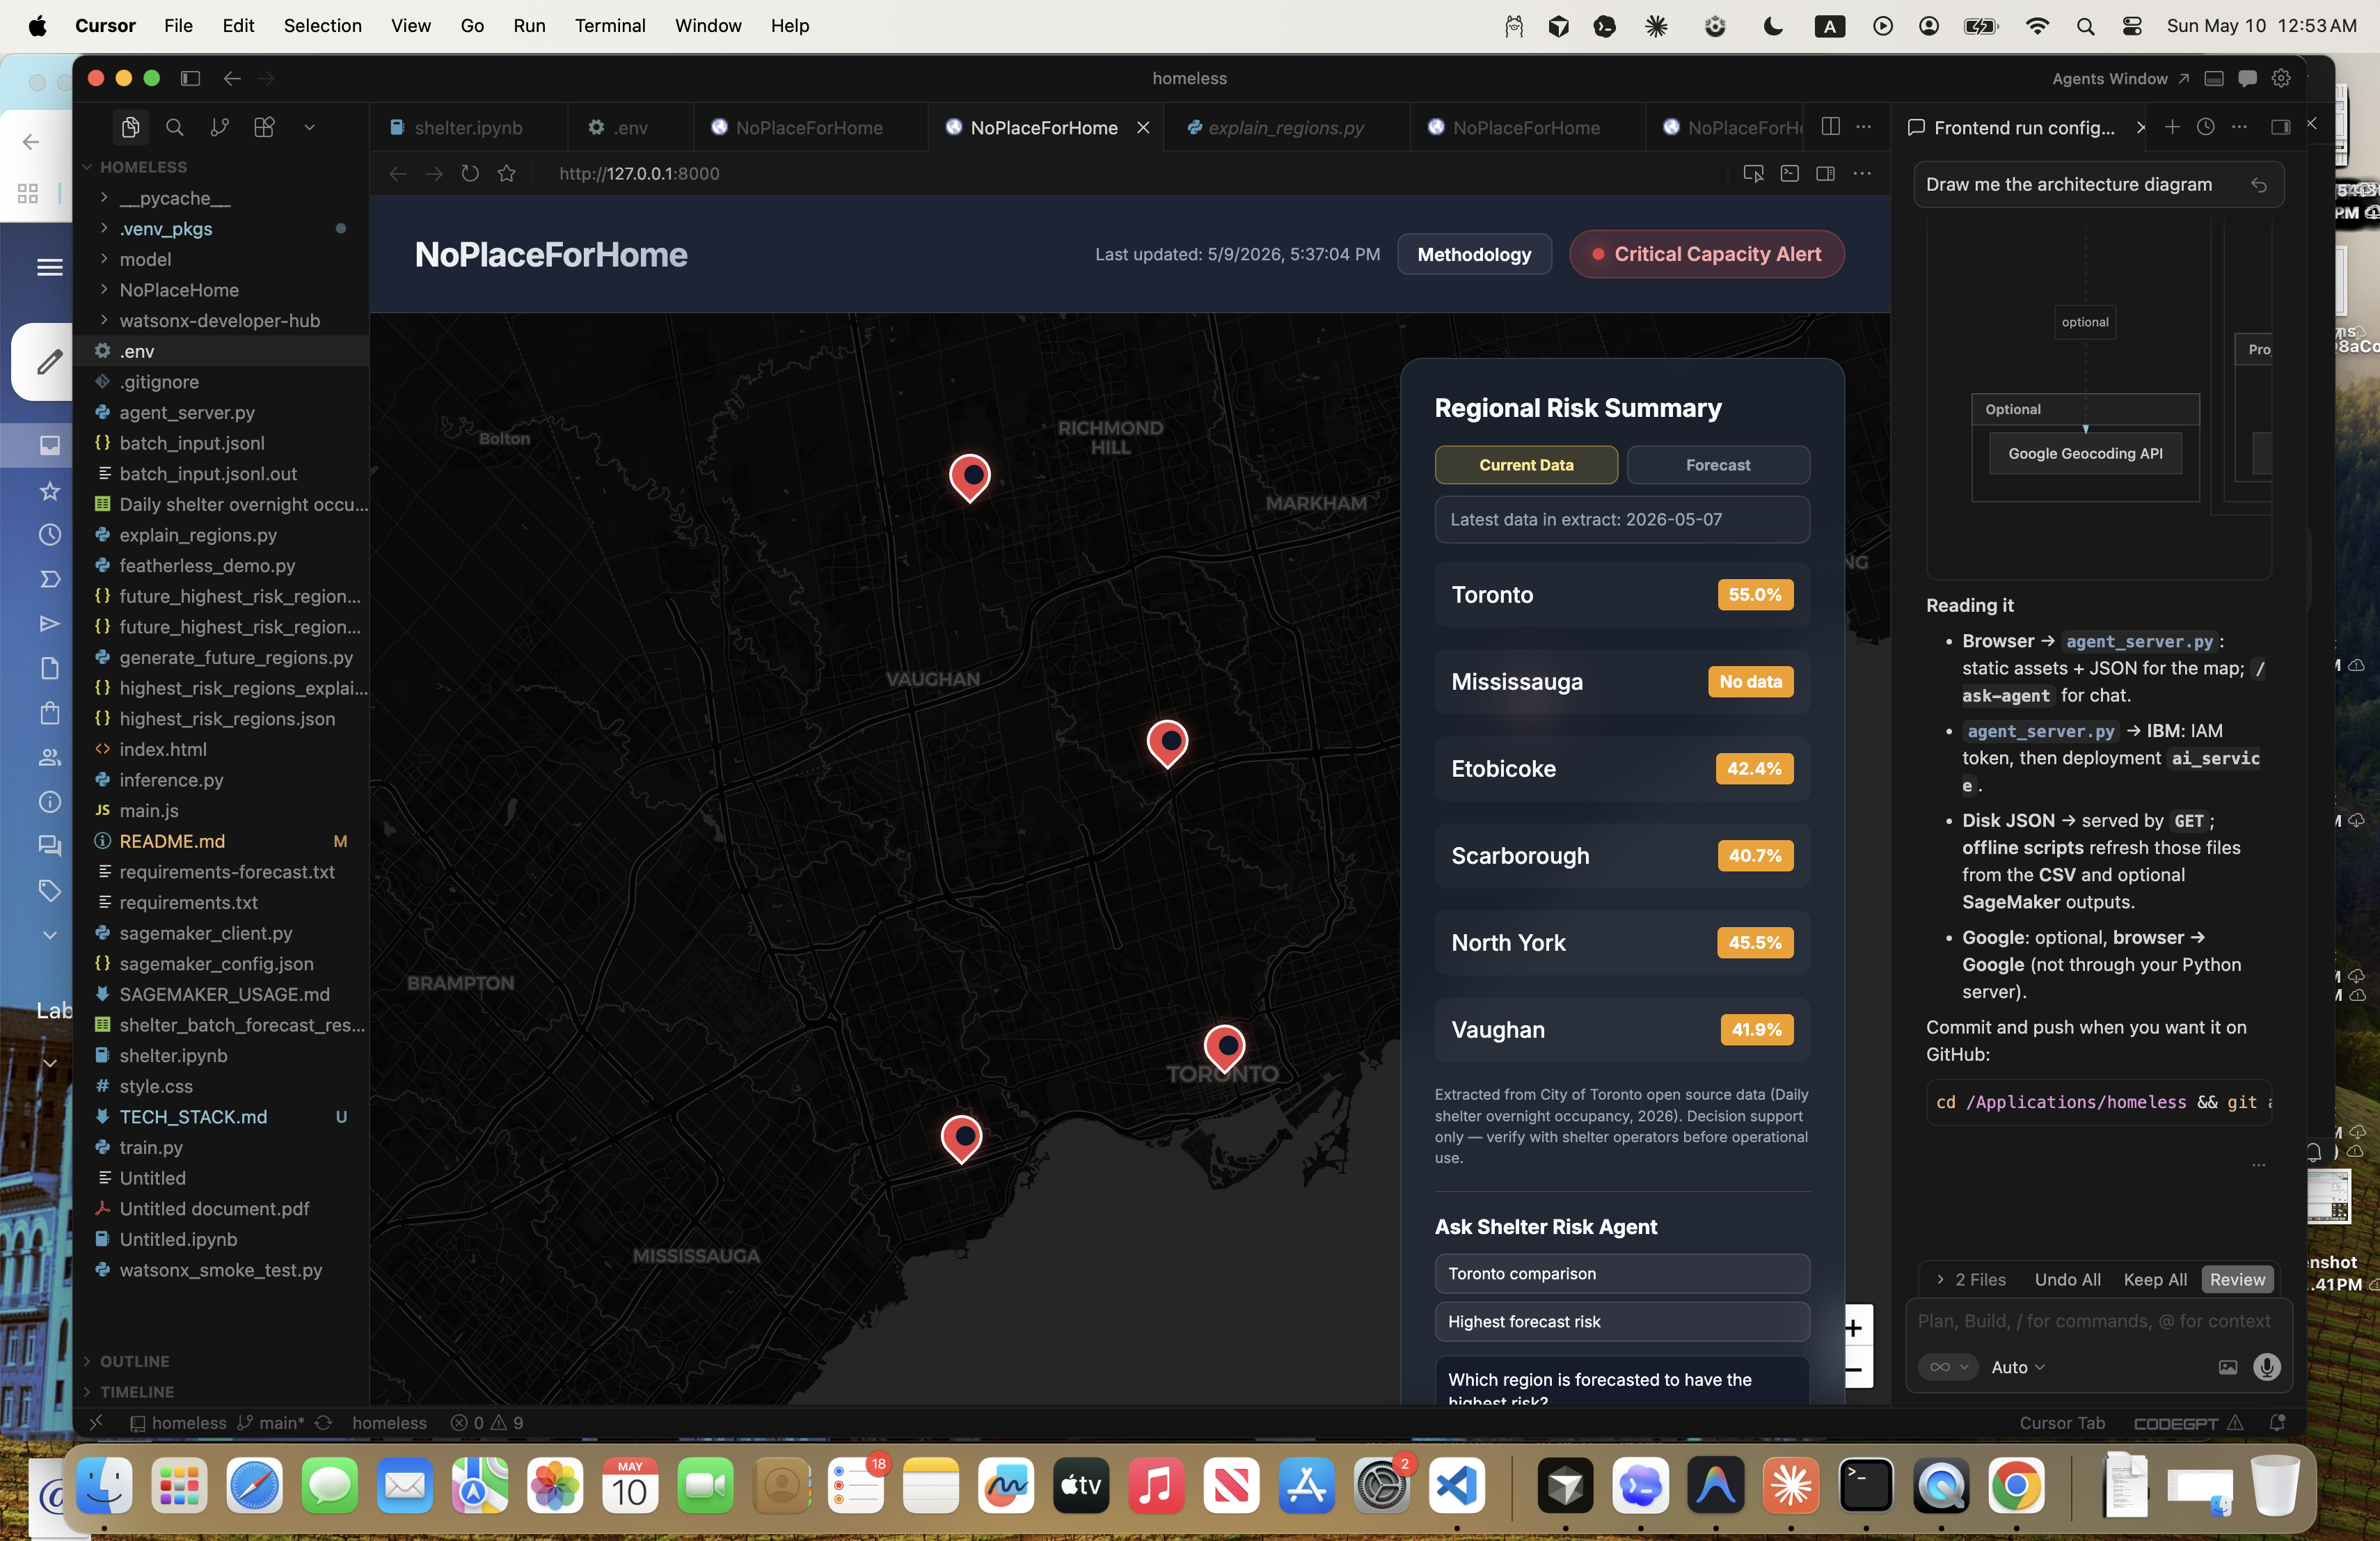
Finally, our Ask Agent feature provides an even deeper explanation of the platform’s reasoning. Instead of only displaying a risk label, it explains why a shelter is considered high-risk and what contributing patterns were detected in the data.
How we built it
Integrated GoogleMapAPI for the frontend. Used FeatherAI (LLM AI agents) or IBM WatsonX PromptLab explanation of why it is at risk based on the calculated score. Used time series forecasting for model training and risk score as inference for the day right now compared with the 7 day window and see if the risk is increasing or not. The ask agent utilizes IBM WatsonX AI Agent Lab for deeper explanation of the risk aside from risk label, why shelter is at high risk and contributing pattern. AWS Sagemaker was used for forecasting next few days to 1 week after the date that this data has been retrieved.
Challenges we ran into
For me learning how to add Watson.ai Runtime was a huge challenge. Every time I kept adding the watsonx.ai Runtime was empty. As a way to solve this problem, I checked into the resource group to see all the runtimes and launch one of them. The other problem I encountered was time series determining what models to utilize (PRophet, RandomForestRegressor, etc). I tried to do cross validation and search for the lowest RMSE, that is what I used for prophet. Moreover, navigating through AWS Sagemaker was another pain point. Whether I want to deploy the endpoint for real-time inference vs doing offline inference to save tokens burned were things I had dilemma with. I focused on offline inference as real-time inferencment deployment takes long time especially with training and inferring data.
Accomplishments that we're proud of
It is my first learning how to use AWS and IBM Platform tools. Before I only used cloud tools for deploying the web. This time I deployed an AI and only integrated their cloud AI features into my web for LLMs and AI agents.
What we learned
I have learned how to use the AWS Sagemaker's JupyterLab to save files to S3 which I can download and work with the data offline (outside of the cloud platform). Moreover, I learned how to integrate IBM AI Platform (PromptLab, AI Agent Labs) and Featherless AI into my web app for LLM explanation of the vulnerability risk for homeless shelter (whether that is too much occupancy of the rooms, not enough available room being approved for use.) This project allowed me to apply and synthesize the knowledge I used for training and testing dataset to determine if overfitting/underfitting existed. Finally, I learned how to use Google Map API for real-time geospatial projection of the shelter with address that have high risk.
What's next for NoPlaceForHome
Consider real-time inference via training deployment from AWS Sagemaker. I may considering deploying the web through cloud or use WatsonX Orchestration for multi-AI agent orchestration for a stronger AI pipeline. Maybe use Claude model for a more in-depth and complex reasoning explanation such that the information is more accurate.
Built With
- awss3
- deepseek
- featherlessai
- googlemapapi
- ibmwatsonxpromptlab
- javascript
- react
- sagemaker
- timeseriesforecasting

Log in or sign up for Devpost to join the conversation.