

Inspiration
Due to our experience in previous projects, we found that having a node visualizer within monday.com would be a powerful addition to the platform's repertoire. Visualize dependencies, bottlenecks, priorities, and more.
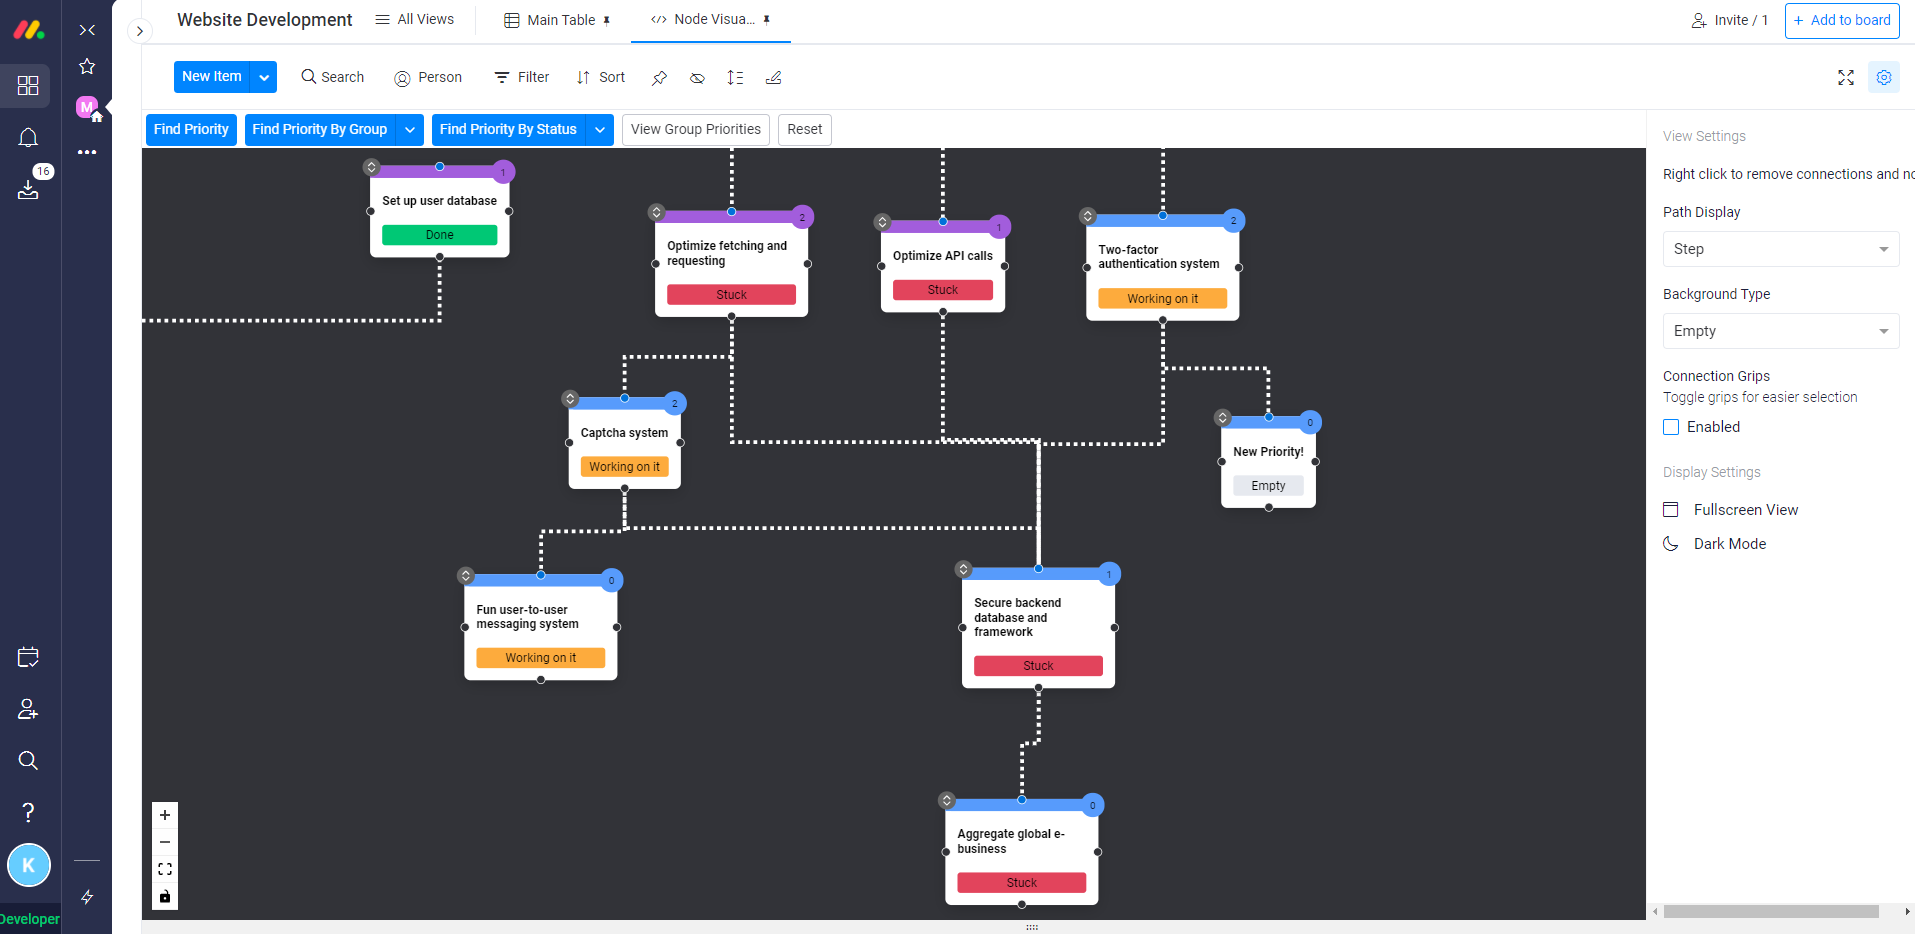
What it does
Adds a node visualizer view to monday.com boards. Takes the items within each group, and represents them as color coded nodes. A user can connect the nodes between each other to represent dependencies, but this is not the only way to use the product. Get creative with visualizing your board!
Algorithms are included to find the priorities of a board or its groups so that users can find and prioritize their tasks effectively, such as locating bottlenecks.
How we built it
This app is not an integration of a third-party product. This app was built using the aggregation of multiple libraries, such as react-flow and react-vis. Monday.com's API allowed us to manipulate and read data off of their platform, making Node Visualizer a reality.
Challenges we ran into
The APIs that we used did not always have the most robust documentation. A lot of time was spent experimenting with what components did instead of creating the product. If we had more time, more algorithms would be included into the app to make a greater user experience.
Accomplishments that we're proud of
a kick-ass video
What we learned
monday.com pretty aight
What's next for Node Visualizer
If the reception of the project is positive enough, then we will continue the development of the application, touching on better user interface, greater usage of the user generated data, and general workflow.
Built With
- monday.com
- react
- react-flow
- react-vis
- tears


Log in or sign up for Devpost to join the conversation.