-
-
Plugin
-
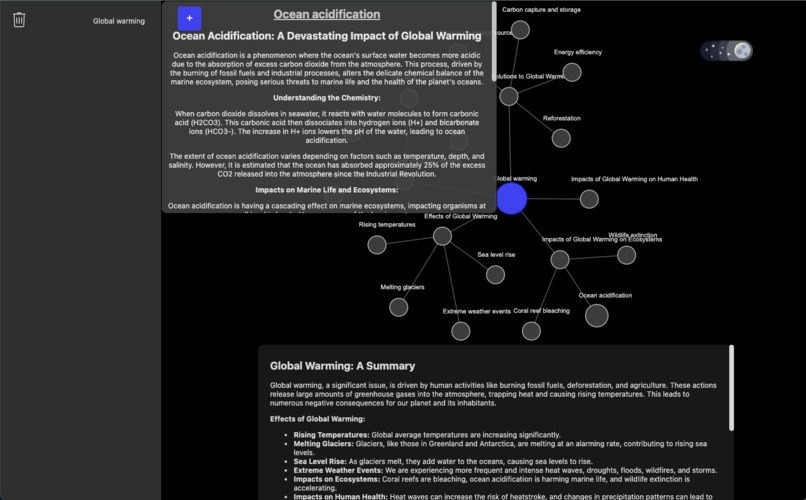
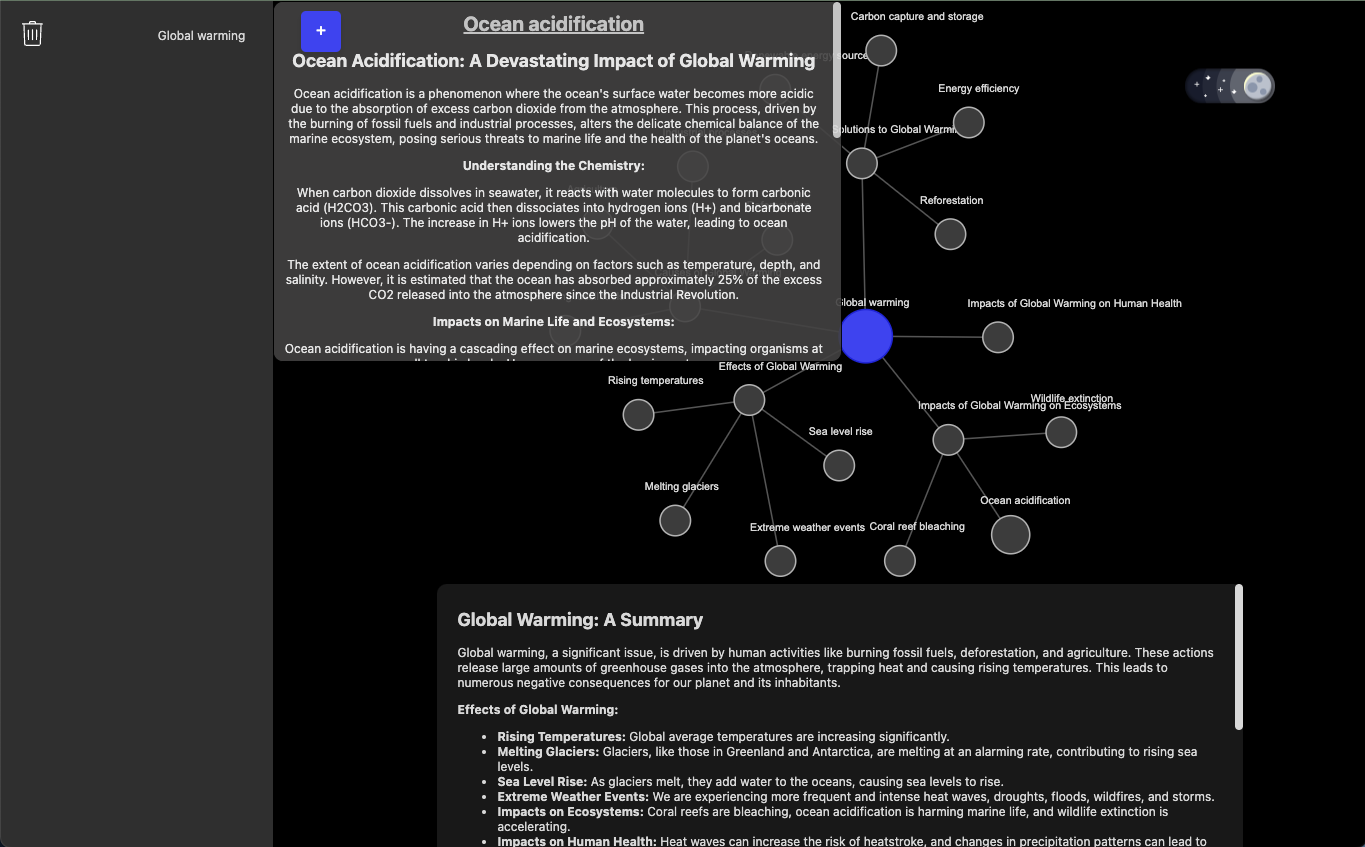
Global warming with Ocean Acidification description
-
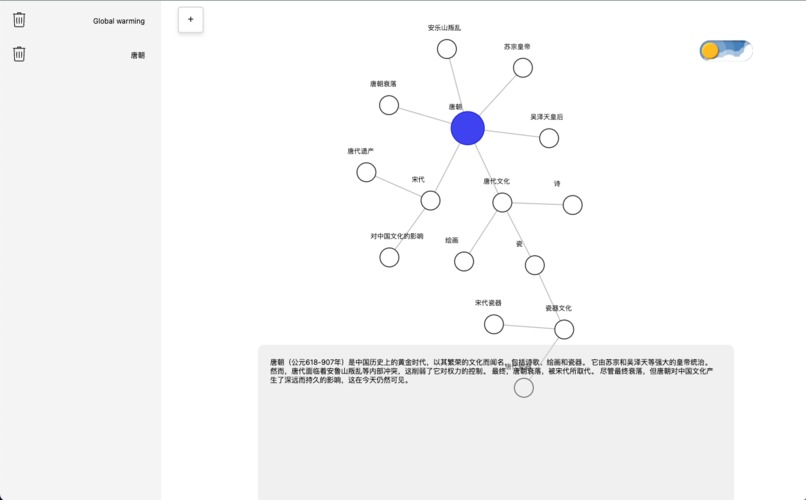
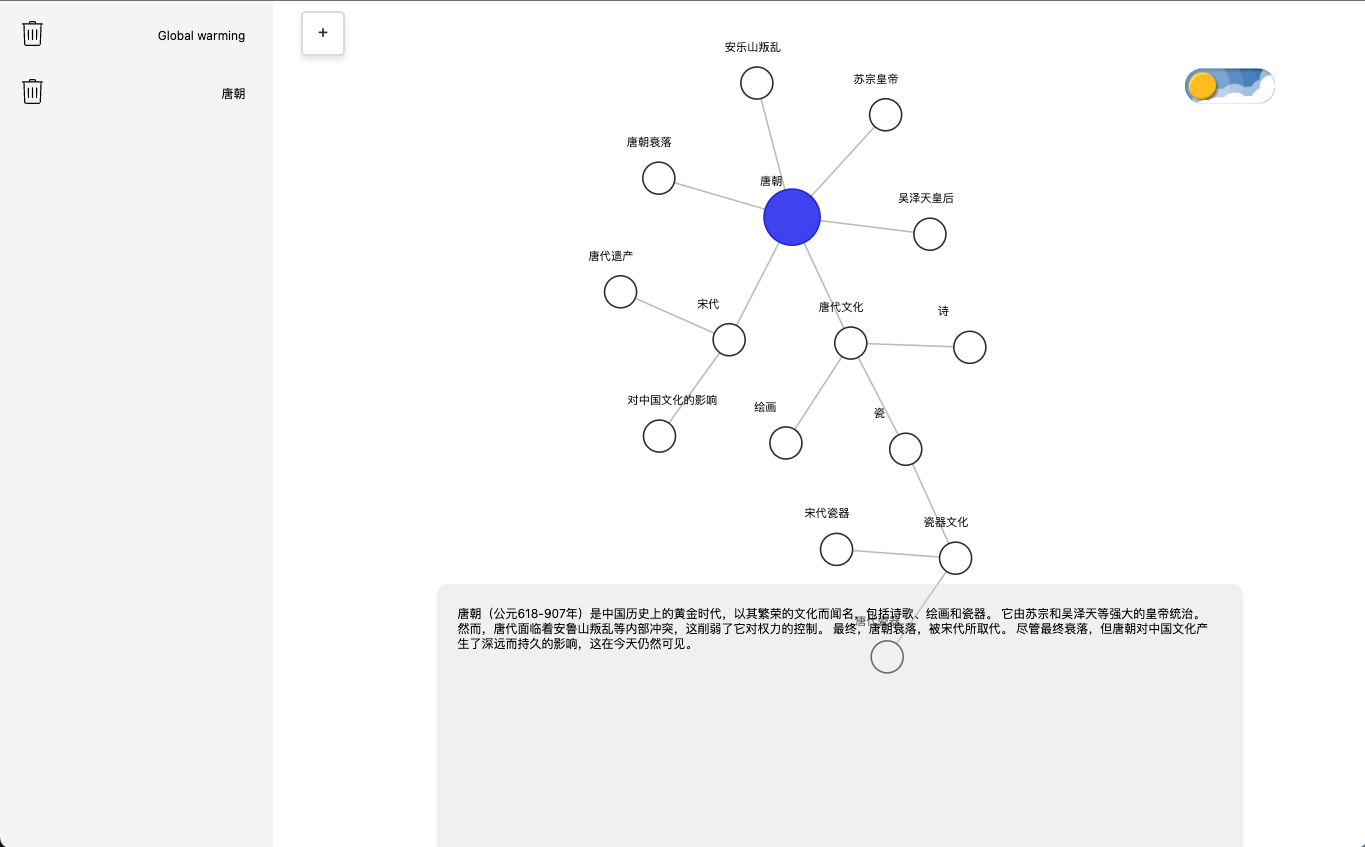
Tang dynasty overview(Chinese)
-
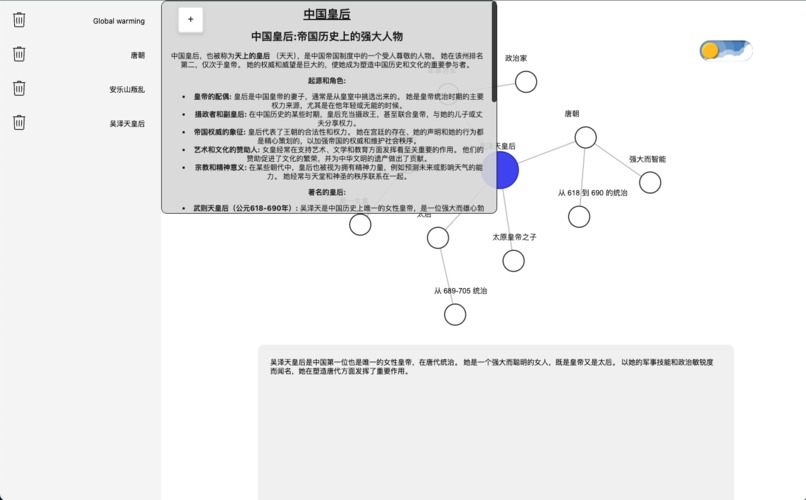
Empress Wu Zetian overview with description(Chinese)
-
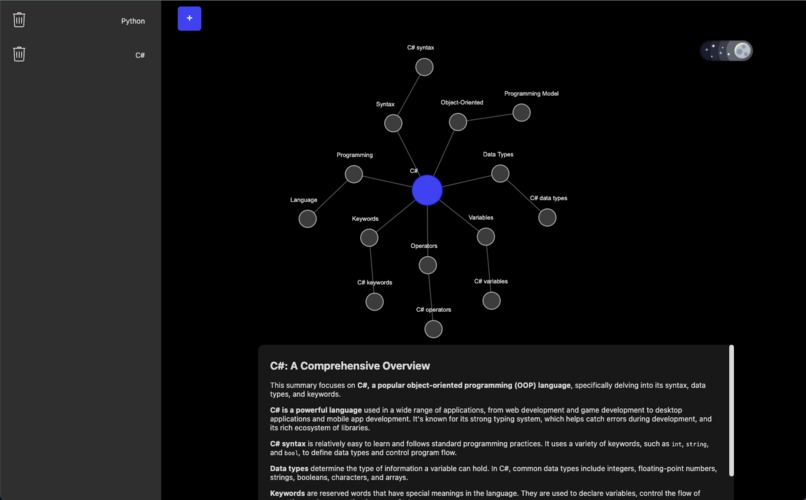
C# overview
-
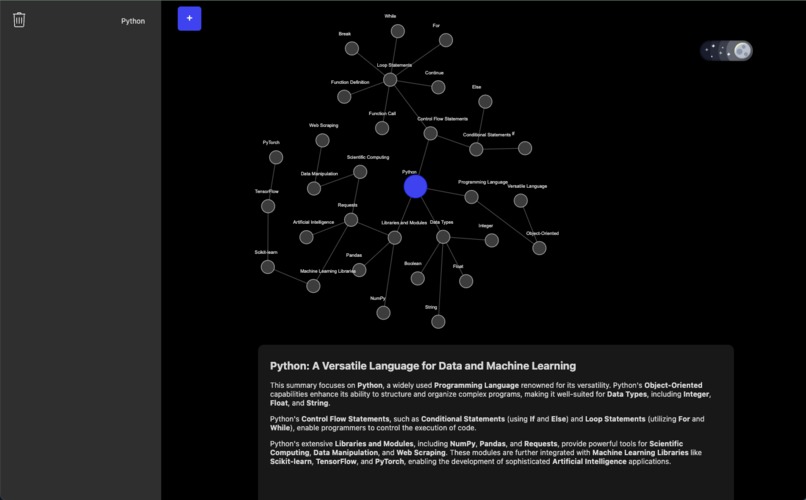
Python overview


Noddy: Dynamic Knowledge Graph Generator
Want to explore a new topic?
Simply enter your keyword into Noddy, and instantly get a customized knowledge graph to guide you. Break down complex ideas into clear, manageable subtopics.
Problems to Solve
Information Overload
Noddy was developed to streamline and elevate the learning process in an increasingly information-abundant world. Traditional research and learning methods often feel overwhelming, leaving individuals uncertain of where to begin. Noddy functions as a strategic guide, making the learning journey more efficient, engaging, and accessible.
Language Barriers
Much of the available information is predominantly in English, limiting access for non-English speakers. Noddy addresses this challenge by offering a multilingual knowledge graph, promoting greater inclusivity and overcoming language barriers, thereby making information accessible to a broader audience.
Enhancing Visual Learning
Information presented in rigid or cluttered formats can be difficult to navigate and comprehend. Noddy enhances the learning experience by leveraging interactive graphs that animate concepts, enabling users to explore ideas through visually dynamic and well-organized representations. This method fosters a clearer, more intuitive grasp of complex topics.
Key Features
Dynamic Graph Generation
- Instantly create detailed knowledge graphs with a single keyword input.
- Generates an intuitive visual representation of the keyword and its related concepts.
AI-Powered Summaries
- Provides summarized insights for the entire diagram and individual nodes.
- Leverages advanced AI algorithms to distill the most important details, making complex ideas easier to understand.
Unique Features
Multilingual Support
- Supports input, diagram creation, and diagram summary generation in any language of the user’s choice.
- Breaks down language barriers, making the app accessible to a global audience.
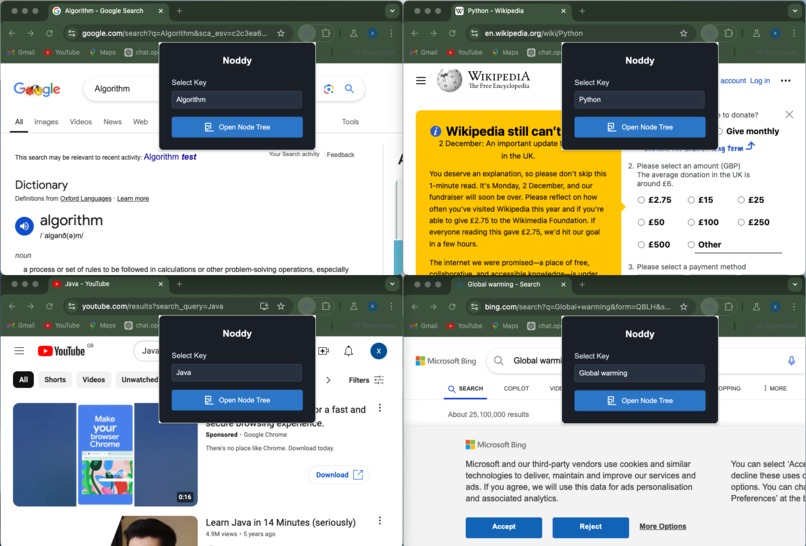
Extension Integration
- Users can create a graph by typing a keyword in any search bar and pressing enter.
- Redirects to the Noddy webpage where the graph is generated instantly.
Expandable Diagrams
- Dive deeper into any topic by interacting with individual nodes.
- Double-click: Expand a node to reveal additional related nodes within the same graph.
- Single-click: Generate a standalone graph dedicated to the subtopic.
- Double-click: Expand a node to reveal additional related nodes within the same graph.
- Allows users to explore complex ideas in layers and gain detailed insights.
Bonus Features
Adaptive Theme Mode
- Automatic Dark/Light Mode Adjustment: Syncs with the user’s device settings for optimal visual experience.
- Customizable Theme Options: Users can manually select their preferred mode regardless of device settings.
Interactive Diagram Movement
- Dynamic Behavior: Diagrams exhibit organic, fluid movement. Connected elements gently reposition themselves when nodes are dragged.
- Customizable Interaction:
- Drag Nodes: Adjust the layout for personalized diagrams.
- Pin Nodes: Lock specific nodes in place for a more stable layout.
- Zoom: Focus on specific areas by adjusting the zoom level.
- Instant Keyword Editing: Double-click on a node to edit the keyword and instantly generate a new diagram.
- Drag Nodes: Adjust the layout for personalized diagrams.
Key API Features
Prompt System for Content Generation
- The core driver of the app, where a keyword-based prompt generates the knowledge graph and related summaries.
- Enables topic-specific and context-rich content creation.
Language API for Detection
- Automatically identifies the user's input language.
- Ensures that AI-generated content matches the user's language preference.
Translation API for Multilingual Diagrams
- Seamlessly translates the entire knowledge graph, including node summaries and overall insights, into the desired language.
- Ensures accessibility and usability for global audiences.
MediaWiki API
- Works alongside the topic summarizer to provide direct links to relevant Wiki pages.
- Identifies the most closely related page, enabling users to continue their research easily.
D3.js
- Used to create interactive graphs with accurate connections and physics-based animations.
- Enhances the overall user experience with visually engaging interactions.
Built With
- css
- d3.js
- gemini
- html5
- javascript
- mediawiki
 Chen")

Log in or sign up for Devpost to join the conversation.