-
-
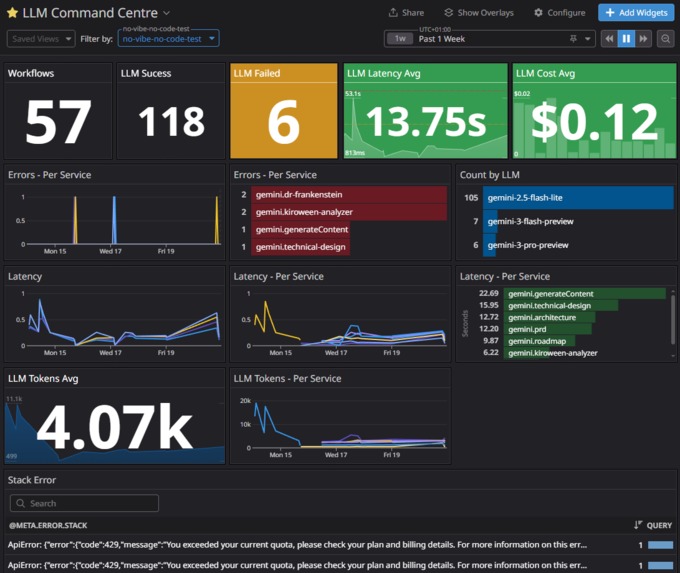
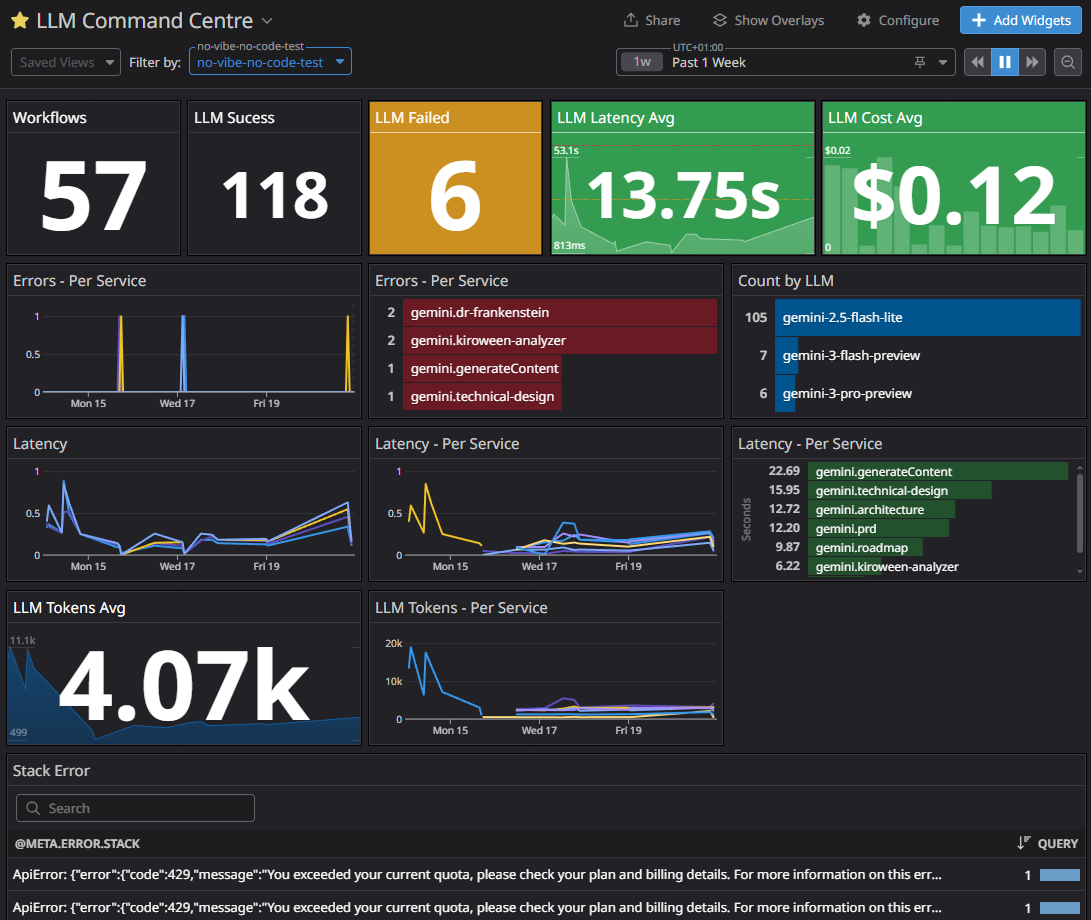
Datadog - Command Centre Dashboard
-
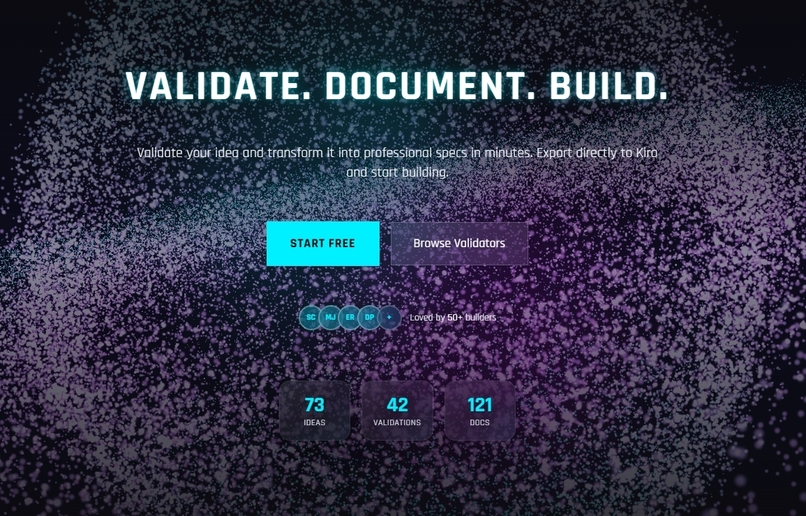
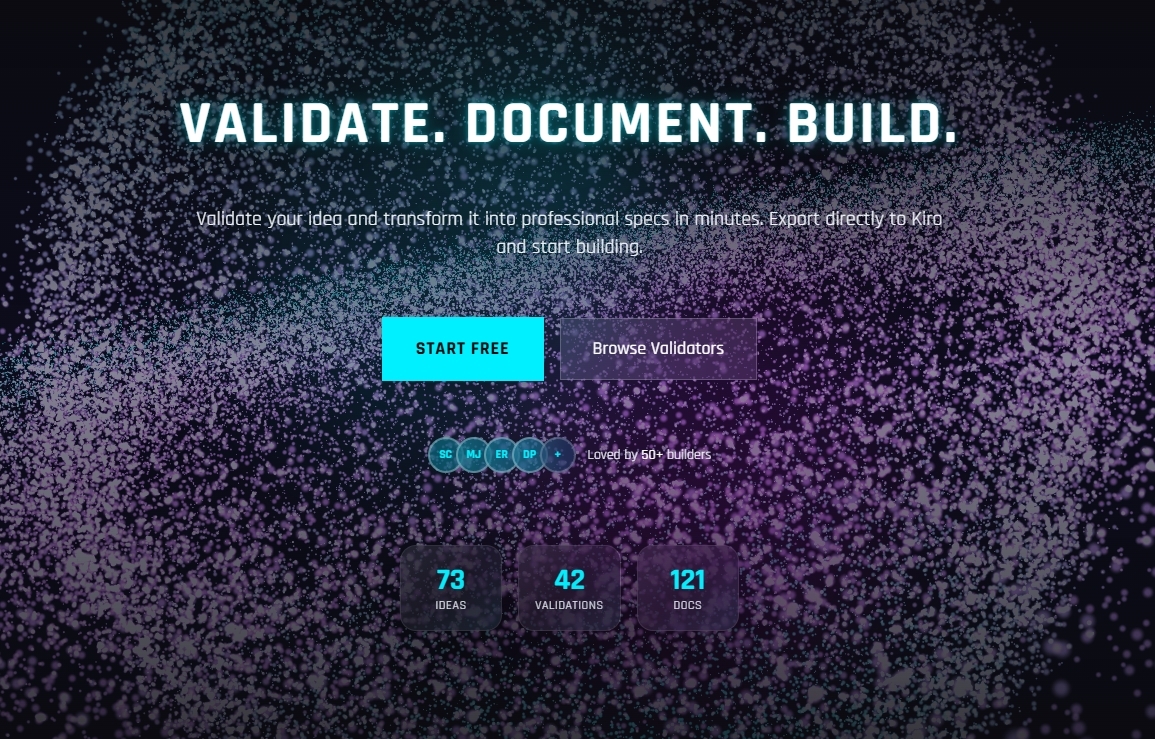
No Vibe No Code Landing Page
-
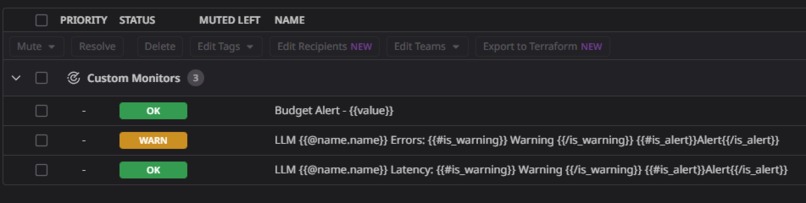
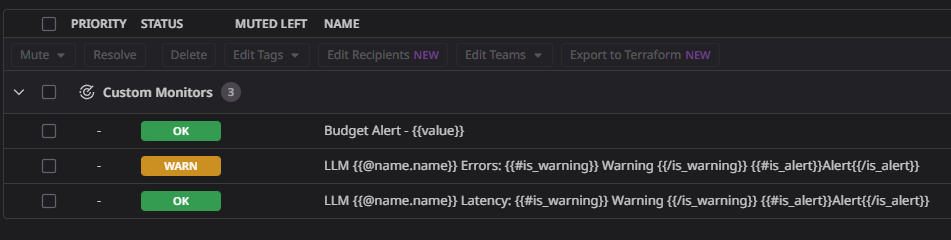
Datadog - Monitors
-
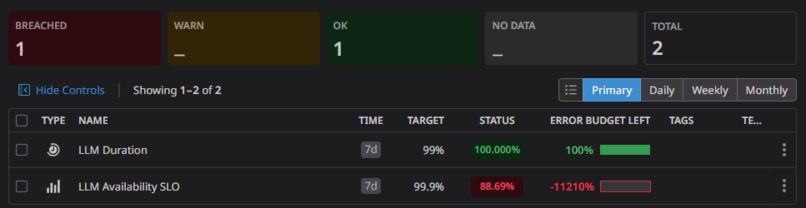
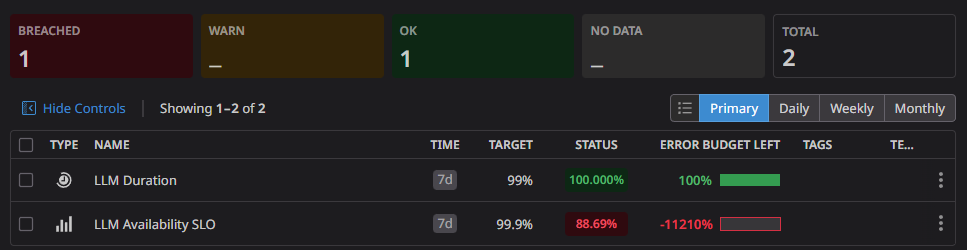
Datadog - SLOs
Inspiration
No Vibe No Code started from a simple personal pain: I have tons of project ideas, but most never make it past the “that would be cool” stage. I built a place to dump ideas, validate them against criteria, and generate the core docs needed to actually ship. All that is powered by Google Gemini.
This version is No Vibe No Code + Datadog LLM Observability: once the workflow exists, the next bottleneck is operating it reliably—knowing when the LLM pipeline is slow, failing, or getting expensive, and being able to respond quickly.
What it does
No Vibe No Code is a web app that takes you from idea → development-ready docs → a Kiro-ready setup.
On top of that, this project adds an LLM Command Centre in Datadog that lets you monitor the health of the idea workflow end-to-end:
- Track workflow runs, LLM success/failure, and errors by step
- See latency overall + per-step latency (so you know which stage became the bottleneck)
- Track token usage and estimated cost, overall and by step
- Show monitor status + SLO status directly on the command-centre dashboard
How we built it
Base product (No Vibe No Code)
The original project was built to “bootstrap ideas into a Kiro-ready, development-ready shape,” including idea generation, validation, doc generation (PRD/tech design/architecture/roadmap), and Kiro export.
Datadog LLM Observability layer
- Instrumented the workflow so each request becomes a trace and each workflow stage becomes an LLM span (grouped by step name).
- Built a single command-centre dashboard focused on the LLM “golden signals”:
- Reliability (success/error)
- Latency (avg + percentiles + per-step)
- Tokens & cost (overall + per-step)
- Added SLO widgets and monitor status widgets so the dashboard is a true “ops home base.”
- Added monitors that are grouped by step name (so alerts identify which stage regressed), and wired them to auto-create Datadog Incidents for an actionable response loop.
Challenges we ran into
- Defining “health” for LLM pipelines: a workflow can be “200 OK” but still unusable if latency/cost spikes or outputs degrade—so the dashboard needed to focus on signals that reflect real operational risk.
- Choosing the right alert granularity: alerts need to be grouped per step (Idea vs PRD vs Architecture), otherwise incidents aren’t actionable.
- Balancing signal vs noise: percentiles, thresholds, and sampling need to be tuned so the command centre stays readable and trustworthy.
Accomplishments that we're proud of
- Turning a multi-stage “idea → docs” workflow into an operable production system with a real command-centre view.
- A dashboard that makes it obvious what is failing at a quick glance.
- Adding SLO + monitor visibility directly to the dashboard to support fast triage.
What we learned
- LLM apps need cost and latency treated as first-class operational signals (not “nice to have” charts).
- Grouping by workflow step makes incidents actionable—it’s the difference between “LLM is slow” and “Architecture generation is slow.”
- A great command centre is less about having more widgets and more about having the few signals that tell the truth quickly.
What's next for No Vibe No Code x Datadog - LLM Monitoring
We would love to add evaluations and prompt templates to make quick tests and see the results of our changes. This could massively improve the performance and quality of our product.


Log in or sign up for Devpost to join the conversation.