-
-
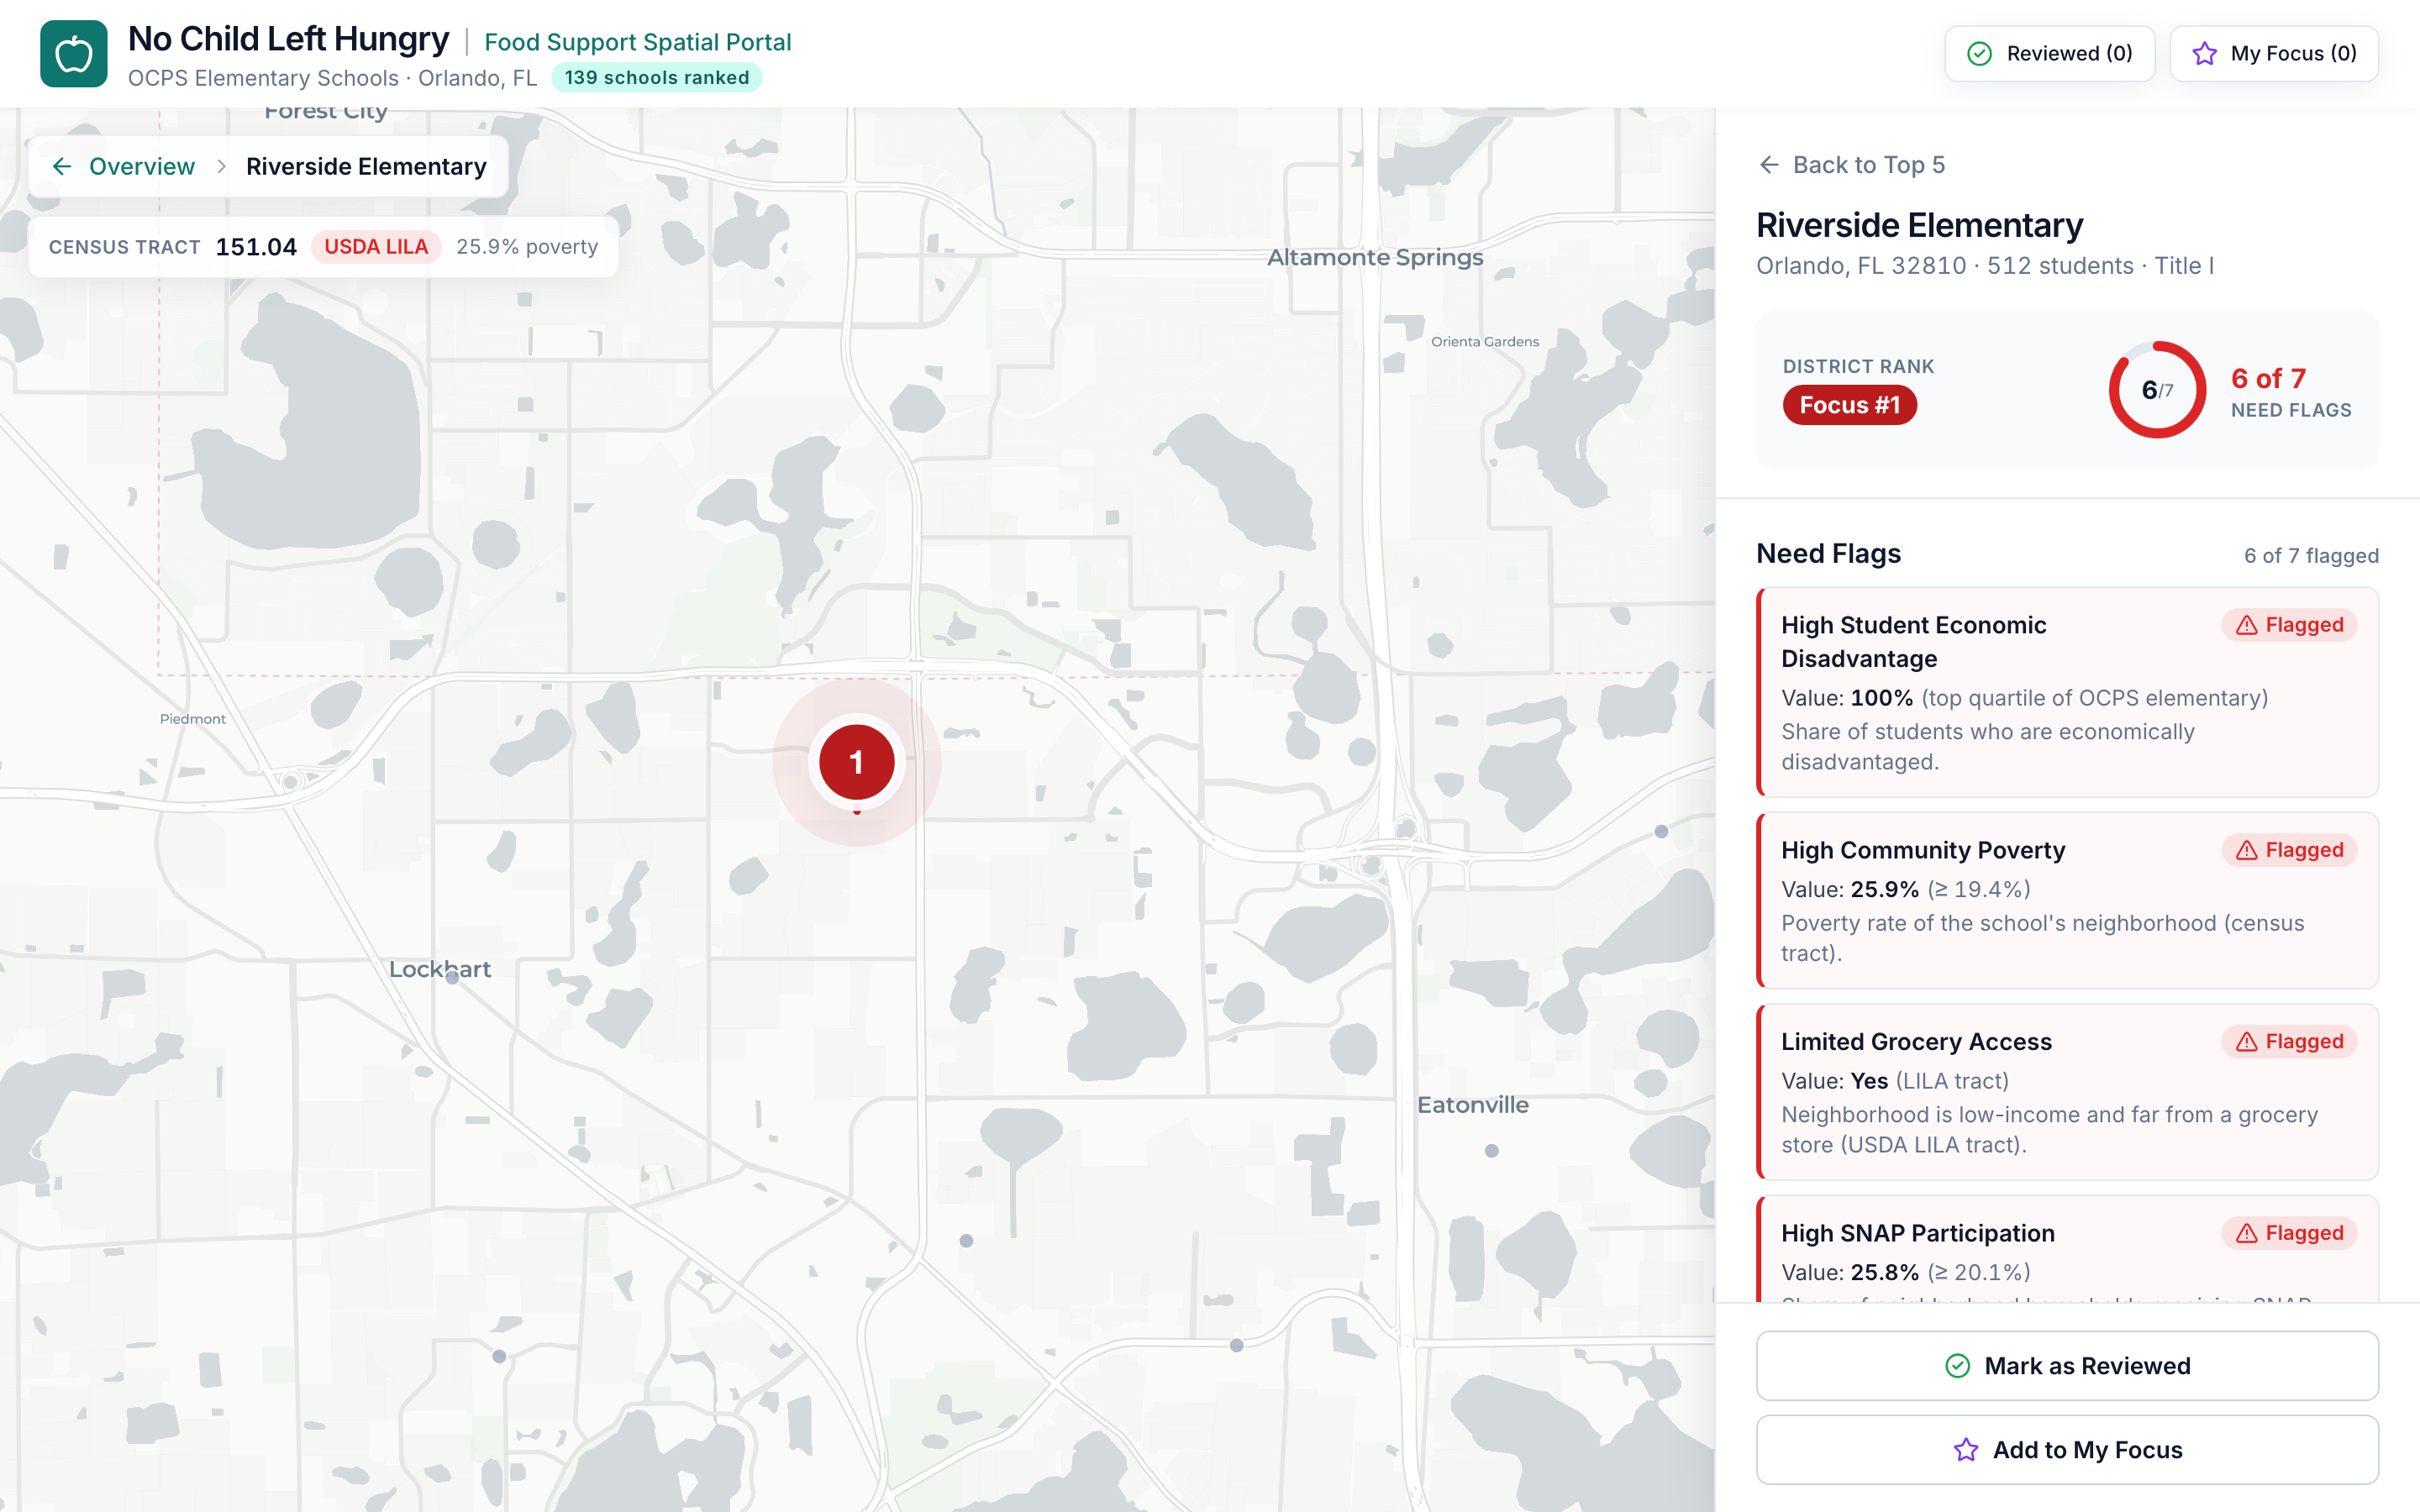
school-level-view
-
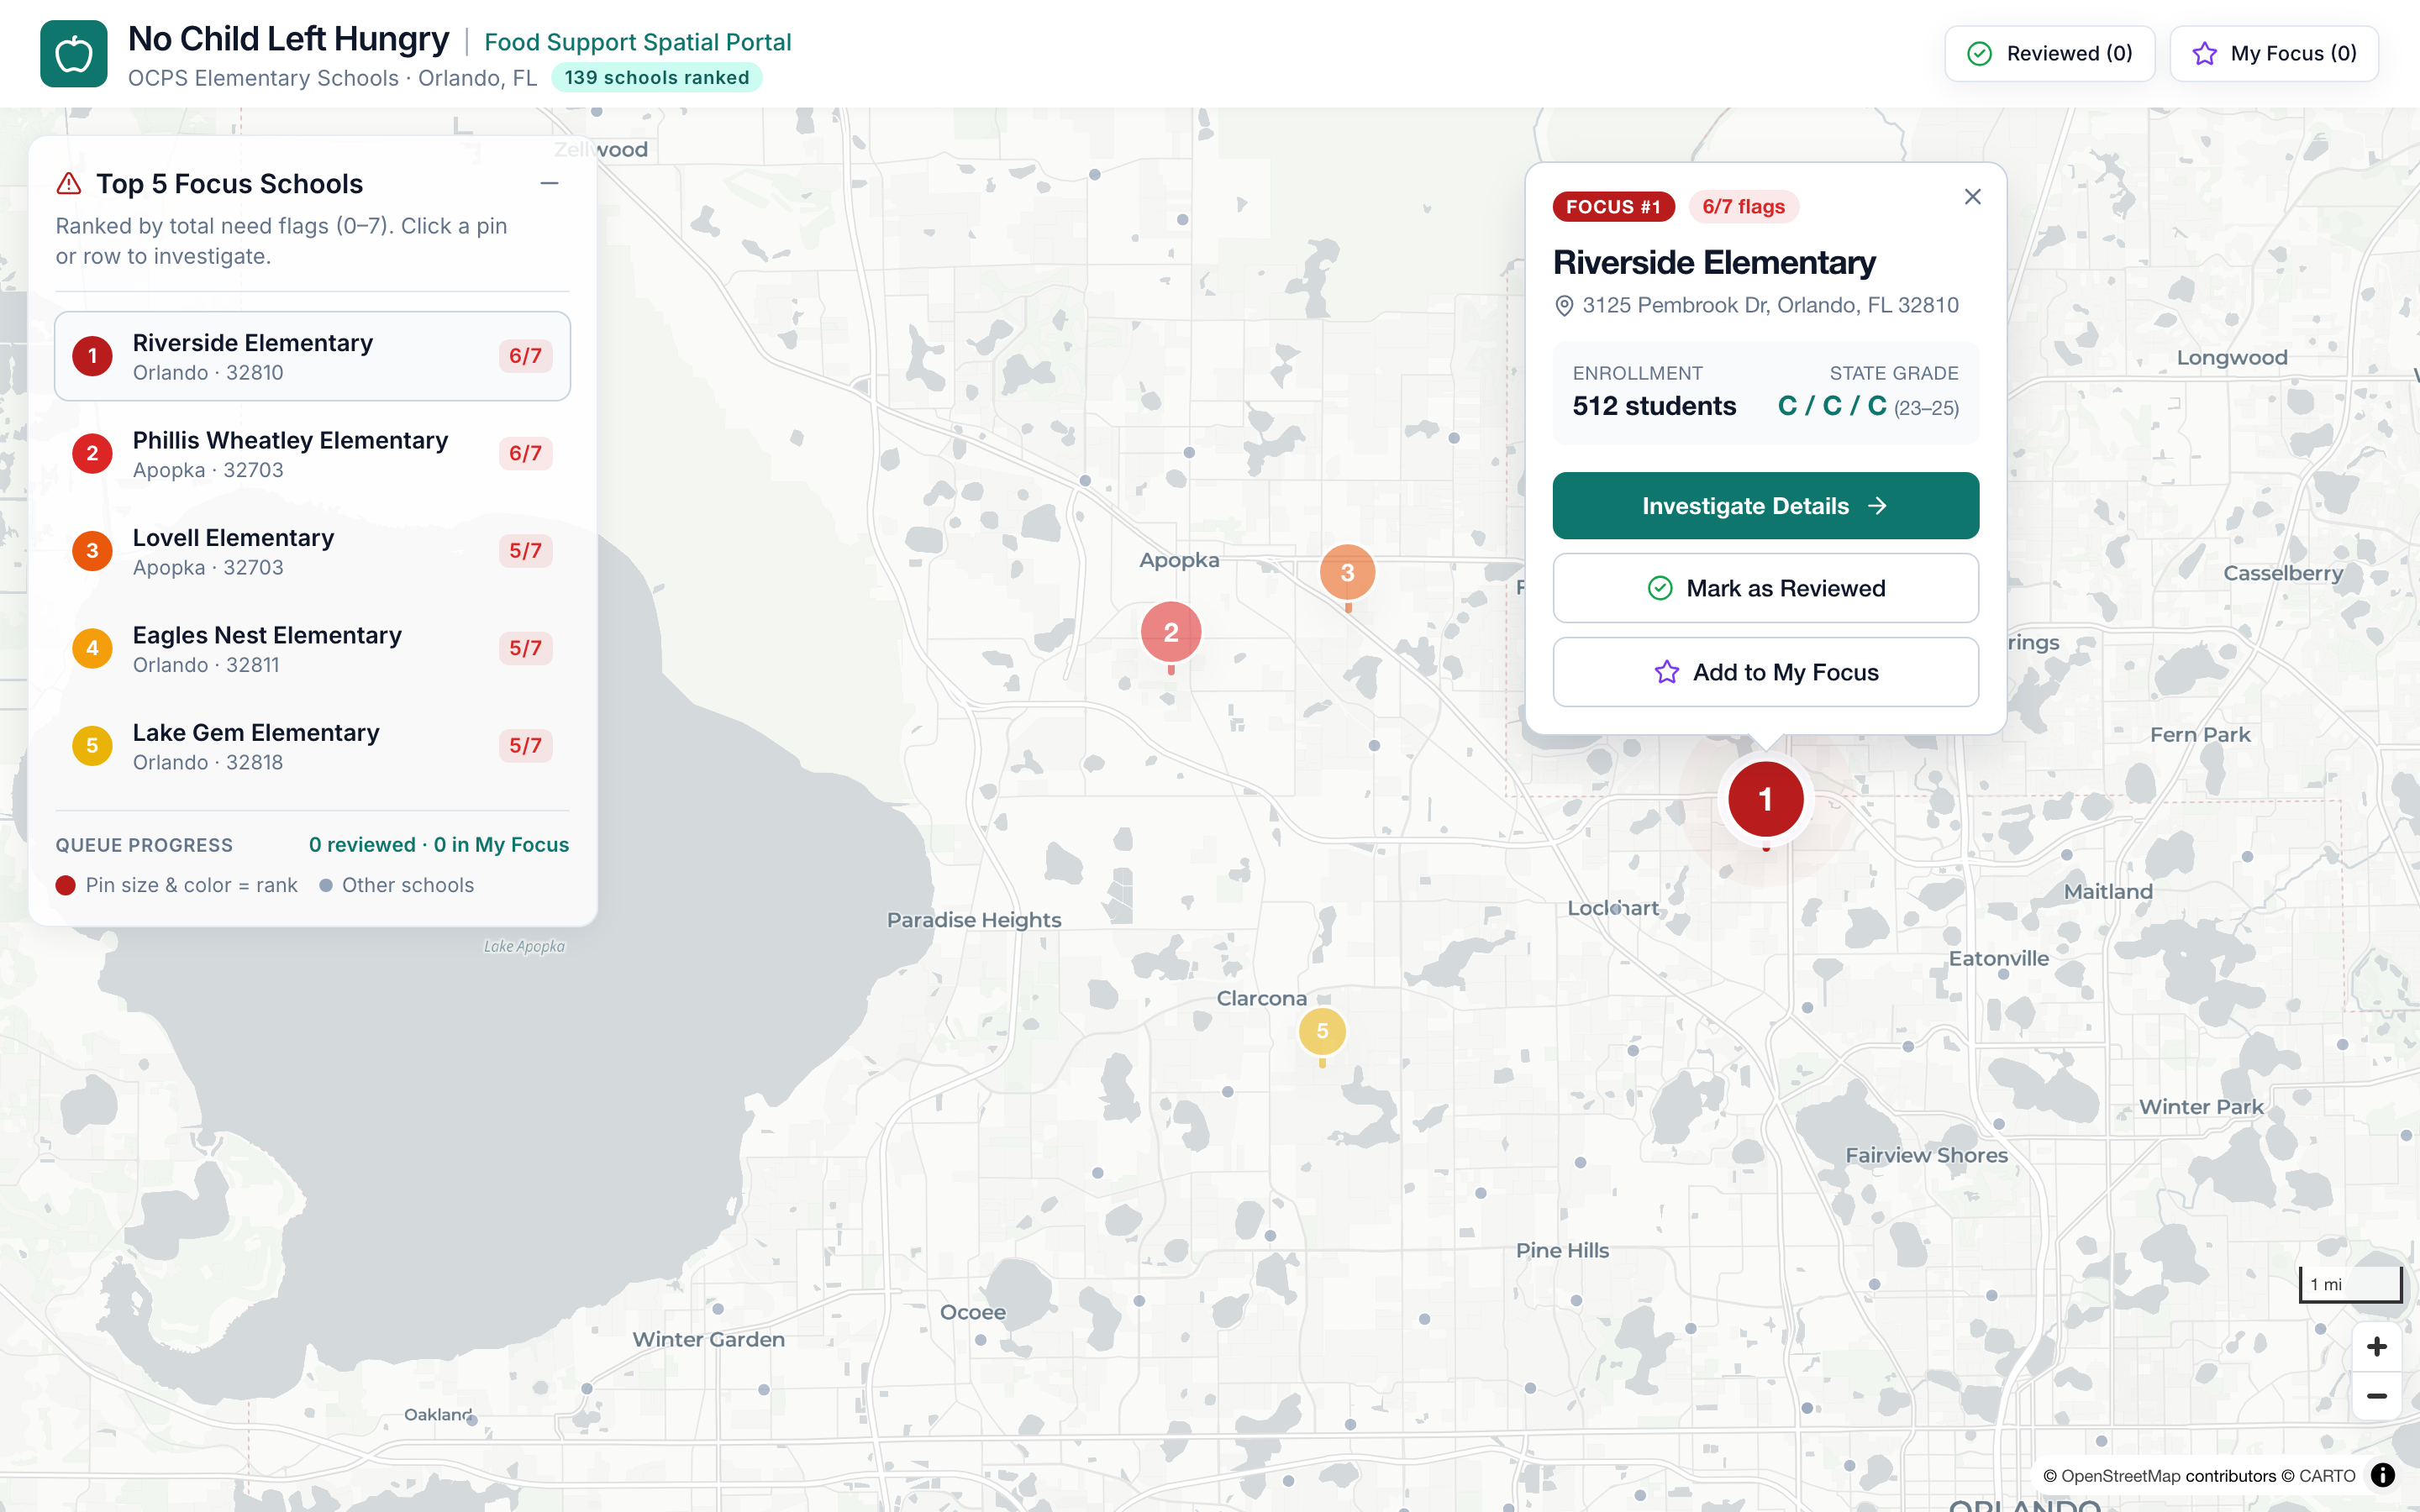
homepage2
-
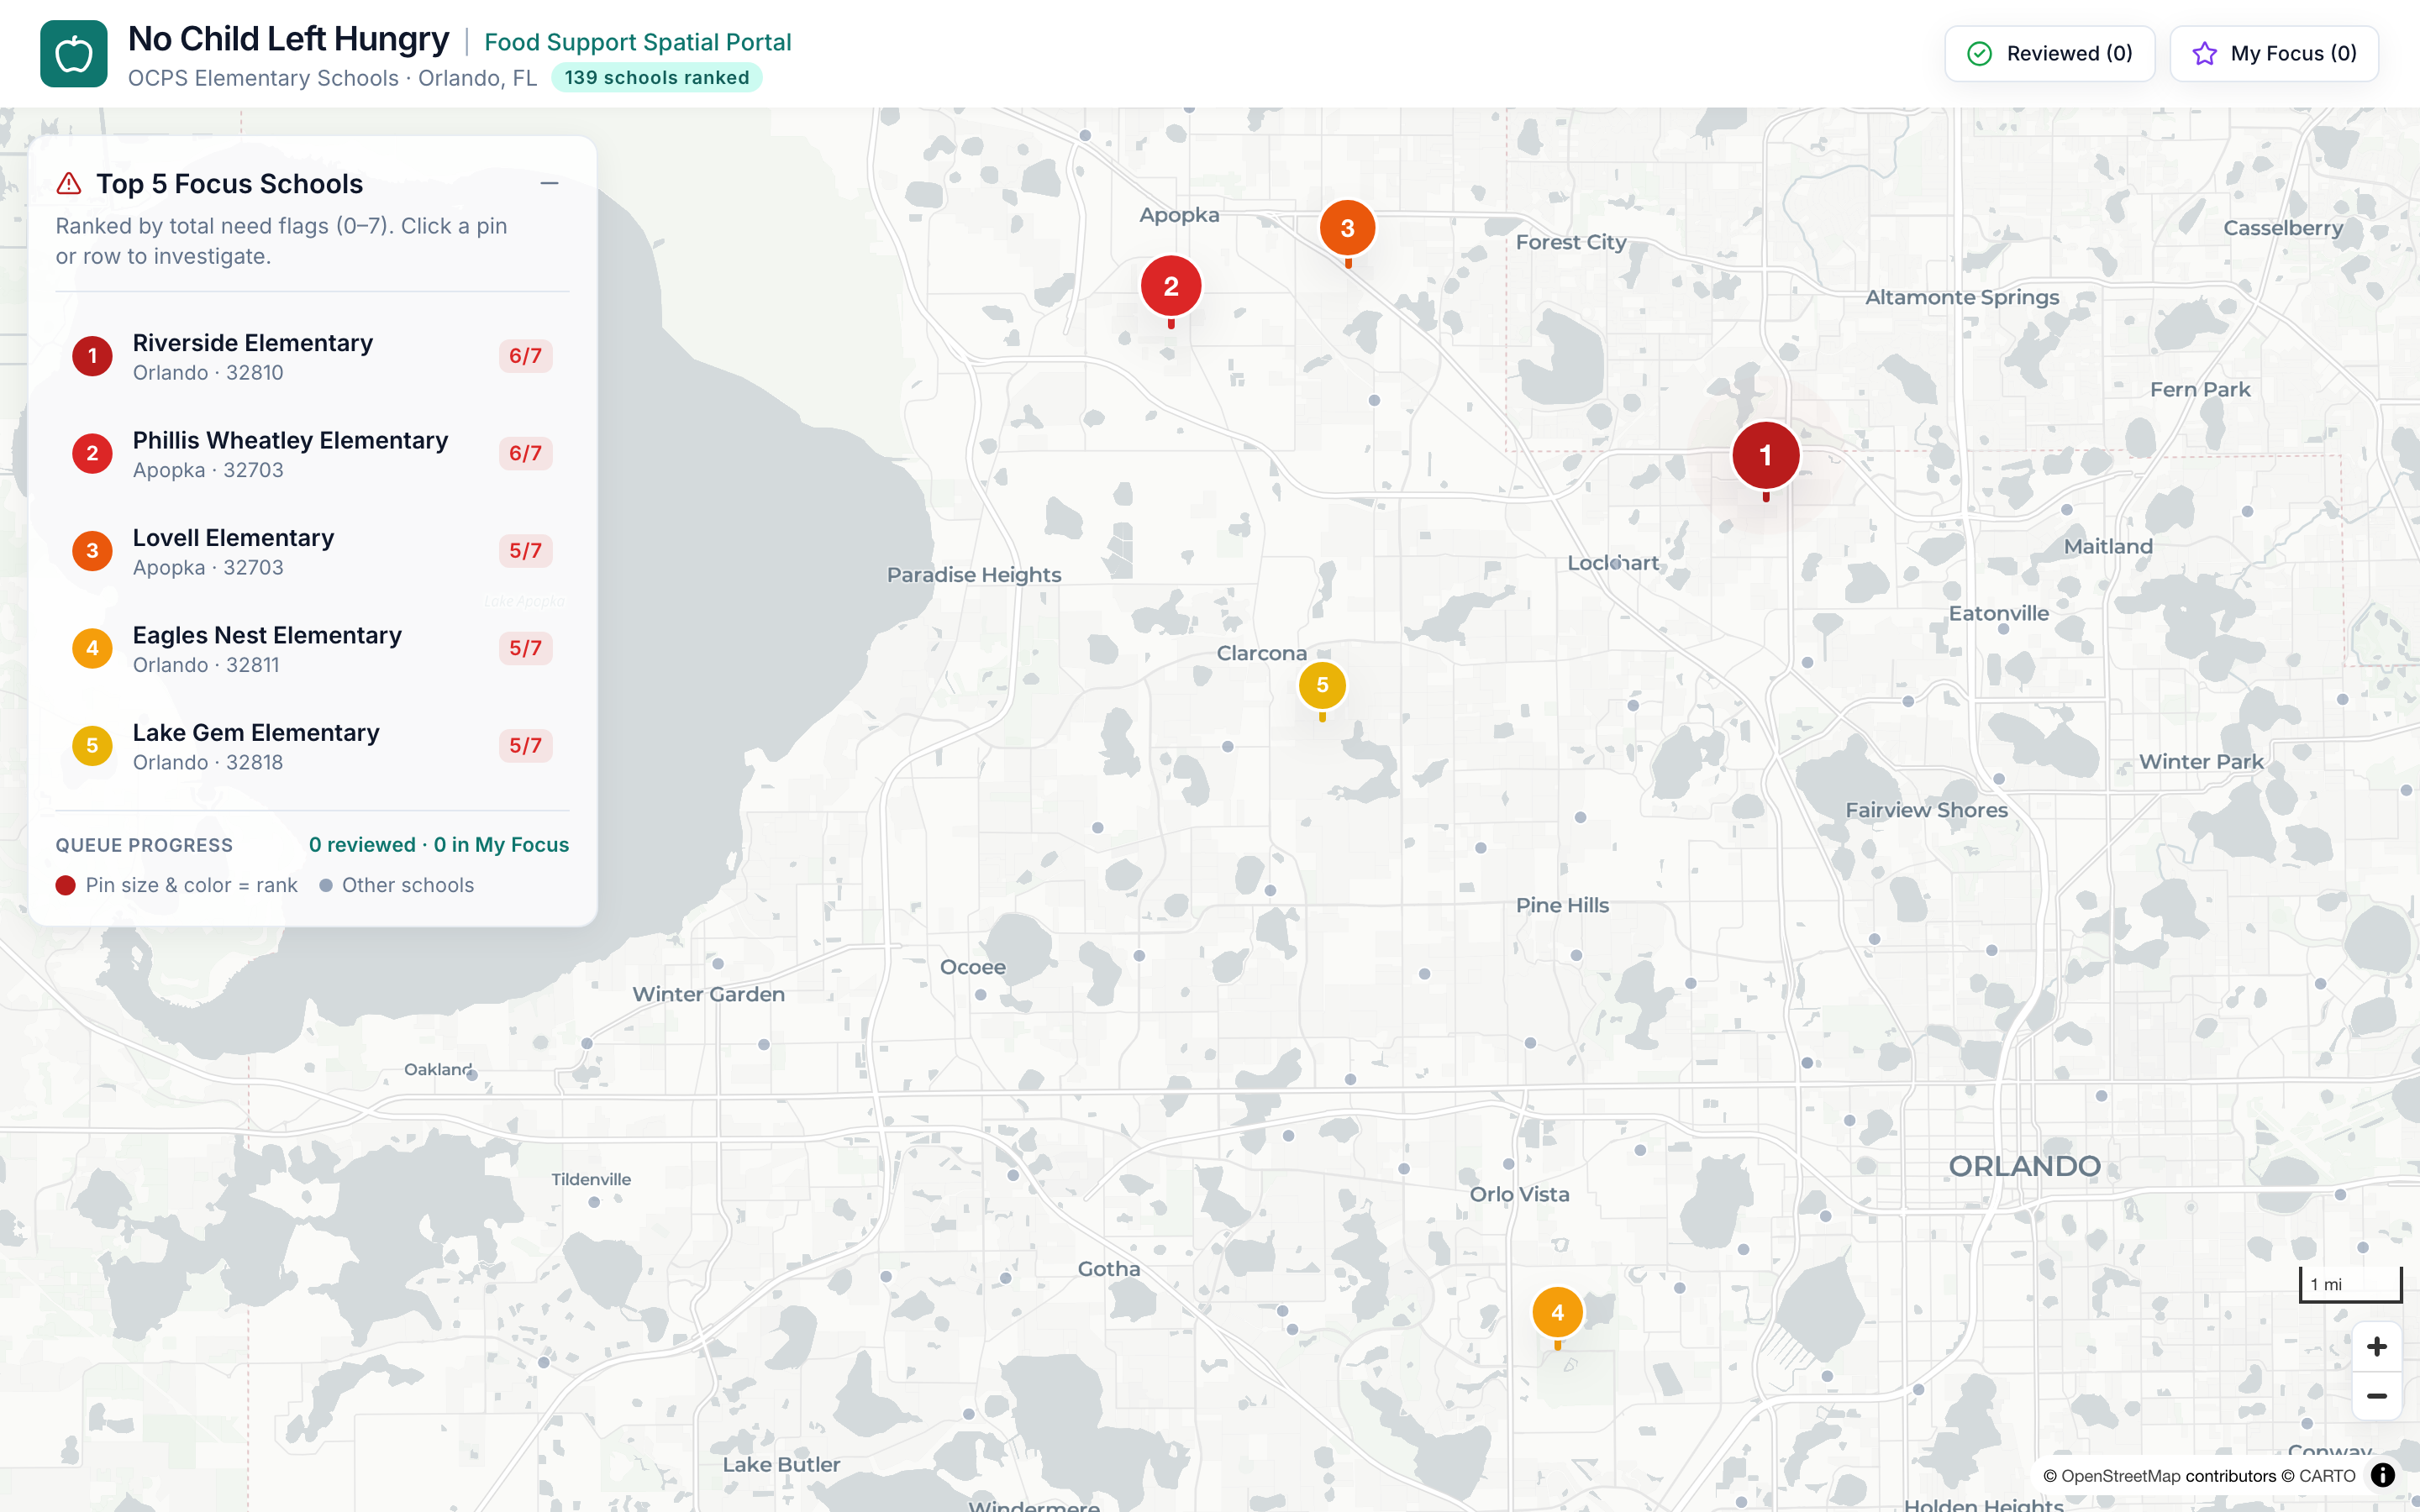
homepage1
-
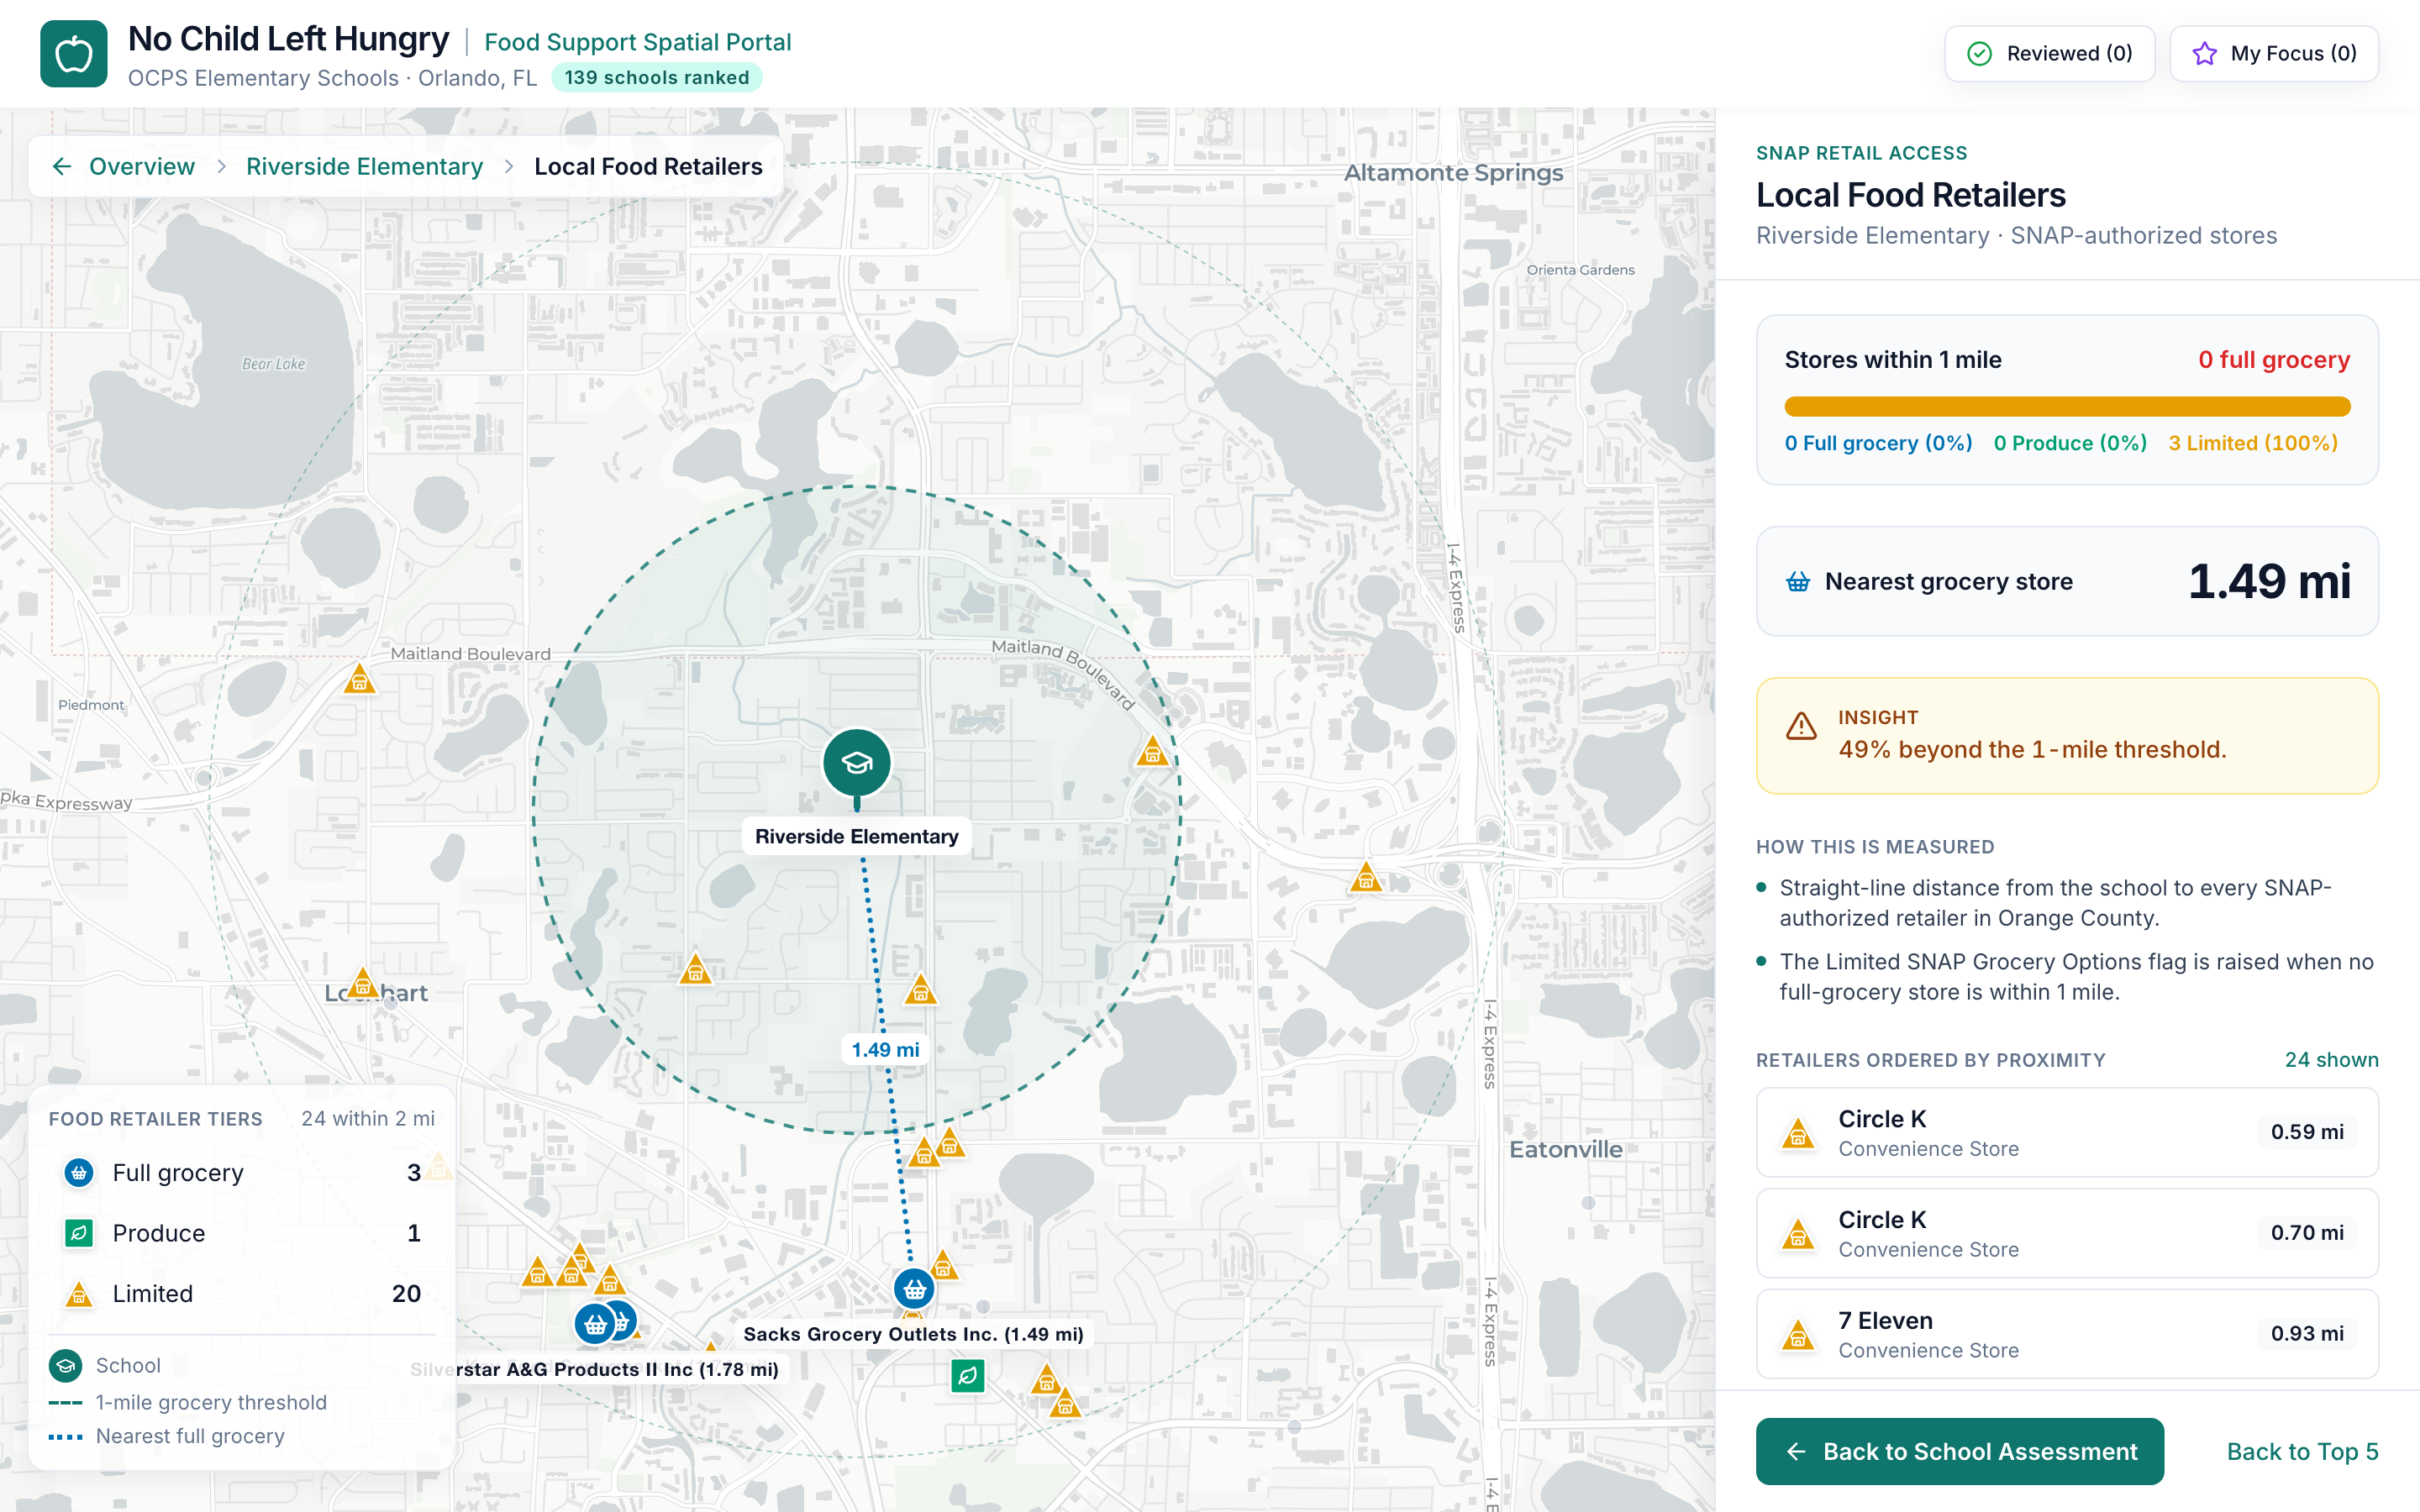
local-retailers
Inspiration
Food insecurity is more than an immediate challenge of putting food on the table. Research has linked childhood food insecurity to challenges in cognitive development, academic performance, and emotional well-being. Food insecurity can also persist across generations, underscoring the importance of addressing disadvantage early in life.
In Central Florida, approximately one in five children experiences food insecurity, according to Feeding America's Map the Meal Gap estimates reported by Second Harvest Food Bank of Central Florida.
Organizations such as Feeding America and Second Harvest are already doing important work through food assistance programs and school partnerships.
But this raised an important question for our team:
With limited resources and hundreds of potential school partners, how can food banks decide which schools to reach next?
As an education researcher and a software engineer, we approached this challenge from two complementary perspectives. We recognized that community food-access indicators describe neighborhood conditions, but they do not necessarily reflect the socioeconomic characteristics of students attending nearby schools.
Our inspiration was simple: What if we connected school data with community food-access data to identify opportunities that neither perspective could reveal as clearly on its own?
What it does
No Child Left Hungry is an interactive, school-centered decision-support tool designed to help food banks identify, investigate, and prioritize potential school partnerships.
Our prototype focuses on 139 elementary schools in Orange County, Florida, integrating two main sources of publicly available information:
- Florida Department of Education (FLDOE): Student economic disadvantage and school performance.
- Beacon and supporting public community datasets: Neighborhood poverty, SNAP participation, grocery access, and SNAP-authorized retailers.
We developed seven transparent indicators to capture different dimensions of socioeconomic disadvantage and food-access conditions. Four indicators contribute to the initial school priority ranking, while three provide additional context.
The tool supports a practical decision-making workflow:
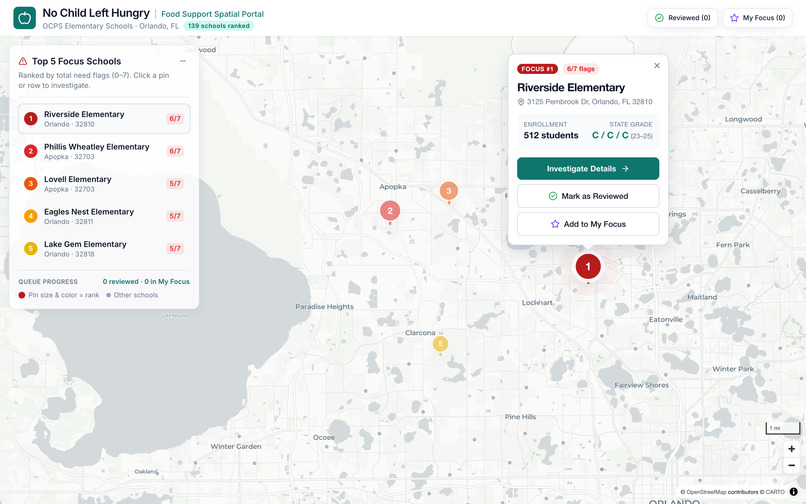
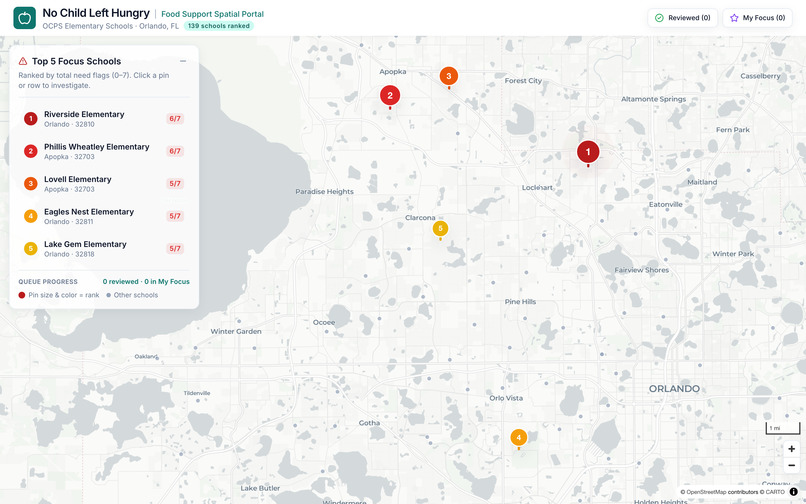
- Identify: Review the Top 5 priority schools based on overlapping indicators of disadvantage and food-access challenges.
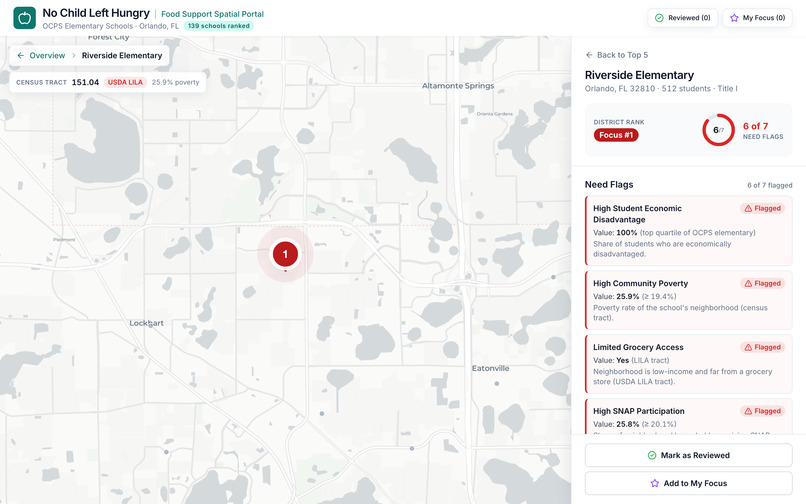
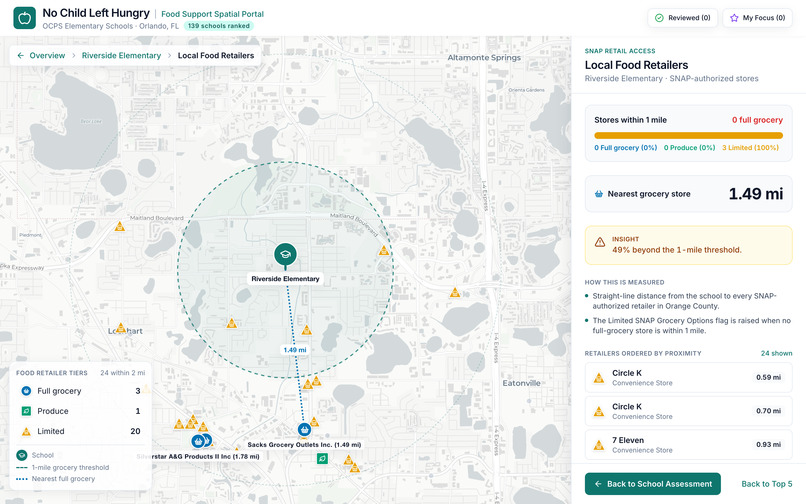
- Investigate: Explore each school's profile, underlying indicators, neighborhood conditions, and nearby SNAP-authorized retailers.
- Verify: Check whether a school already has a food assistance partnership. Staff can mark existing partners so the next eligible school appears in the active priority list.
- Reach Out: Identify potential opportunities to connect with school administrators and explore appropriate food assistance programs.
Our innovation is the connection.
By bringing school-level information together with community food-access indicators, we provide a complementary perspective that can help food banks move from understanding neighborhood conditions to identifying specific schools for further investigation and outreach.
How we built it
We built No Child Left Hungry in three layers: a data pipeline, a design system, and an interactive web application.
1. Data: From Public Datasets to Seven Indicators
- Joining two perspectives: We linked FLDOE school-level data (student economic disadvantage and school grades from 2023 to 2025) to census-tract indicators (USDA SRAM poverty rates and low-income/low-access status, and 2024 American Community Survey SNAP participation) using each school's geocoded campus location and census tract.
- Defining transparent indicators: Each of the seven indicators is a simple yes/no flag with a documented threshold, such as the top quartile among OCPS elementary schools or Orange County census tracts. Missing information is kept as "unknown" rather than guessed.
- Mapping local food retail: We mapped 907 SNAP-authorized retailers in Orange County, grouped USDA store types into tiers (full grocery, produce, and limited options such as convenience stores), and calculated straight-line distances from every school to every retailer to identify schools without a full-service grocery store within one mile.
- Keeping every number traceable: A build-time script converts the source files into typed, pre-ranked data for the app, so every value on screen can be traced back to a source column.
2. Design: From Workflow to Interface
- Designing around decisions: We wrote a UI/UX specification based on progressive disclosure, moving from a district overview to quick actions, a school assessment, and a neighborhood view of local food retailers.
- Prototyping with Google Stitch: We used Google Stitch to explore visual designs, then turned the results into a consistent design system with a calm, civic color palette and clear typography.
- Designing for accessibility: Map symbols pair color with shape (circle, square, and triangle) so retailer types remain distinguishable for color-blind users, and text meets WCAG AA contrast.
3. Application: An Interactive Decision-Support Tool
- Web framework: Next.js 16, React 19, TypeScript, and Tailwind CSS. Every school page is generated ahead of time, so the app loads quickly and needs no backend server.
- Interactive map: MapLibre GL with a CARTO basemap. The map stays in place as users move between views, with smooth camera transitions from the district level to each school's neighborhood.
- Shareable views: Each school assessment and retailer view has its own link, making it easy to share a specific school with colleagues.
- Quality checks: Automated tests verify the ranking and data values, and end-to-end tests walk through the full workflow, from the Top 5 list to the retailer view and back.
- Deployment: The app is deployed on Vercel.
4. Team Workflow
We combined education-research expertise in defining and interpreting the indicators with software engineering to turn them into a working tool. AI-assisted tools supported us throughout: Google Stitch for interface design, Claude Code as a coding partner, and HyperFrames to produce our intro video from real app screens.
Challenges we ran into
Integrating Data Across Geographic Levels
School-level and census-tract-level data describe different populations. A school's campus census tract does not necessarily represent where its students live.
We therefore had to distinguish between characteristics of students attending a school and socioeconomic conditions in the neighborhood surrounding its campus.
Developing Defensible Indicators
Student economic disadvantage, community poverty, SNAP participation, and grocery access are related but distinct concepts.
We developed transparent definitions and avoided treating these indicators as direct measurements of individual children's food insecurity.
Moving Beyond Data Visualization
A map or ranking alone is not enough to support meaningful decisions.
One of our central challenges was designing a workflow that could help food-bank staff move from reviewing data to verifying existing partnerships and identifying potential outreach opportunities.
Accomplishments that we're proud of
We're proud that we turned a complex social challenge into a practical, data-driven solution with a clear path toward community impact.
- Connecting two perspectives: We successfully integrated school-level data from the Florida Department of Education with Beacon's community food-access indicators for 139 elementary schools in Orange County, Florida.
- Building a transparent framework: We developed seven explainable indicators to identify overlapping socioeconomic disadvantages and potential food-access challenges, rather than relying on a black-box algorithm.
- Making data actionable: We created an interactive map and a dynamic Top 5 priority list that helps food-bank staff investigate schools, review supporting evidence, and identify potential partnership opportunities.
- Putting people first: Our solution supports human judgment rather than replacing it. Food-bank staff can review existing partnerships and focus their attention on schools that may benefit from additional outreach.
Our proudest accomplishment is turning disconnected public datasets into a tool designed to support real-world decisions.
What we learned
This project taught us three important lessons.
1. Connecting the data works.
School-level and community-level data can be integrated to provide a more comprehensive perspective on potential food-access needs.
2. Connected data can create actionable priorities.
Instead of reviewing hundreds of schools individually, food-bank staff can start with a focused list, examine the evidence, and identify schools worth investigating for potential partnerships.
3. Data cannot tell the whole story.
Our indicators cannot fully capture children's daily experiences or confirm unmet food-assistance needs. Quantitative evidence is a starting point, not a substitute for human judgment and local knowledge.
Data guide us where to look. Communities help us decide what to do.
What's next for No Child Left Hungry
Our next goal is to move beyond a hackathon prototype and develop a practical, community-informed tool that food banks can use to plan and coordinate school partnerships.
1. Perspectives — Bring more voices into the process.
Engage food-bank practitioners, educators, families, and children through appropriate community engagement to understand their experiences, validate potential needs, and improve our indicators.
2. Collaboration — Build stronger connections.
Work with food banks, schools, and community organizations to review priority schools, identify existing food assistance programs, and explore opportunities for new or strengthened partnerships.
3. Action — Turn insights into meaningful outcomes.
Develop features that support coordinated outreach, partnership tracking, and follow-up. Work with community partners to explore targeted food assistance programs and evaluate whether support reaches families who need it.
Over time, we hope to expand beyond Orange County and make the approach adaptable to other communities.
Our goal isn't just another dashboard. It's to connect data, people, and organizations to create meaningful change for children and families.
Better Data + Community Voices + Collaboration = Meaningful Change.
Built With
- claude
- gemini
- googlestitch
- javascript
- lucidchart
- maplibre
- next.js
- tailwind
- zustand

