-
-
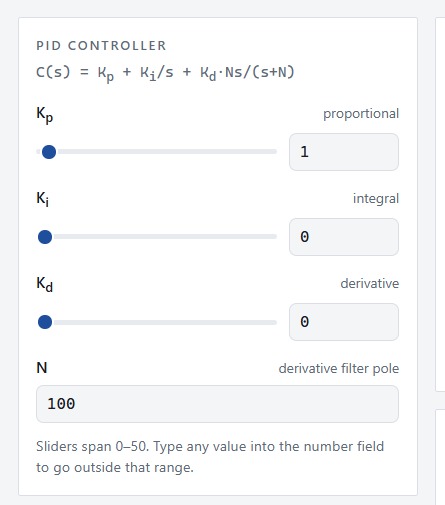
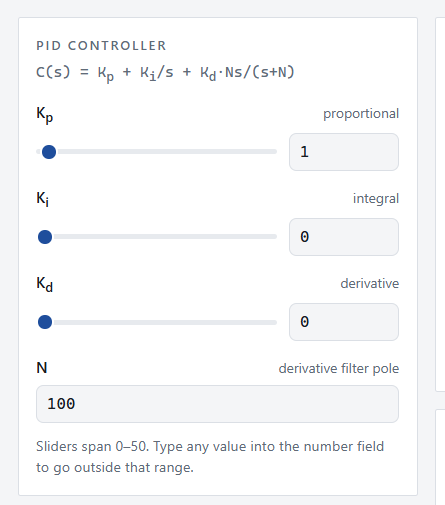
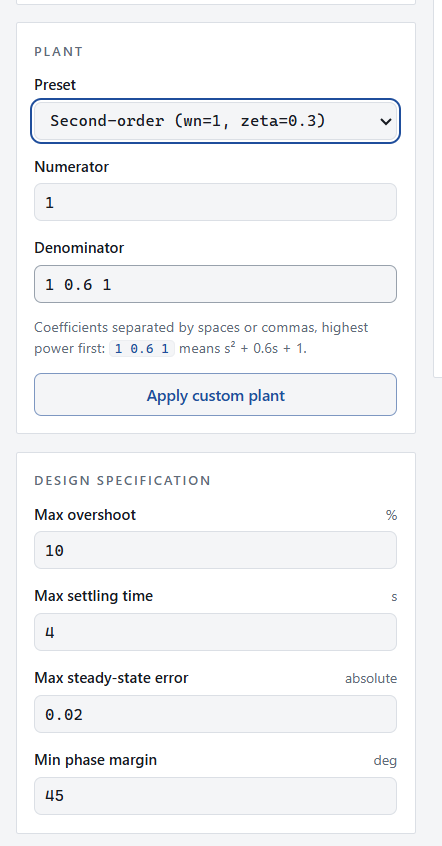
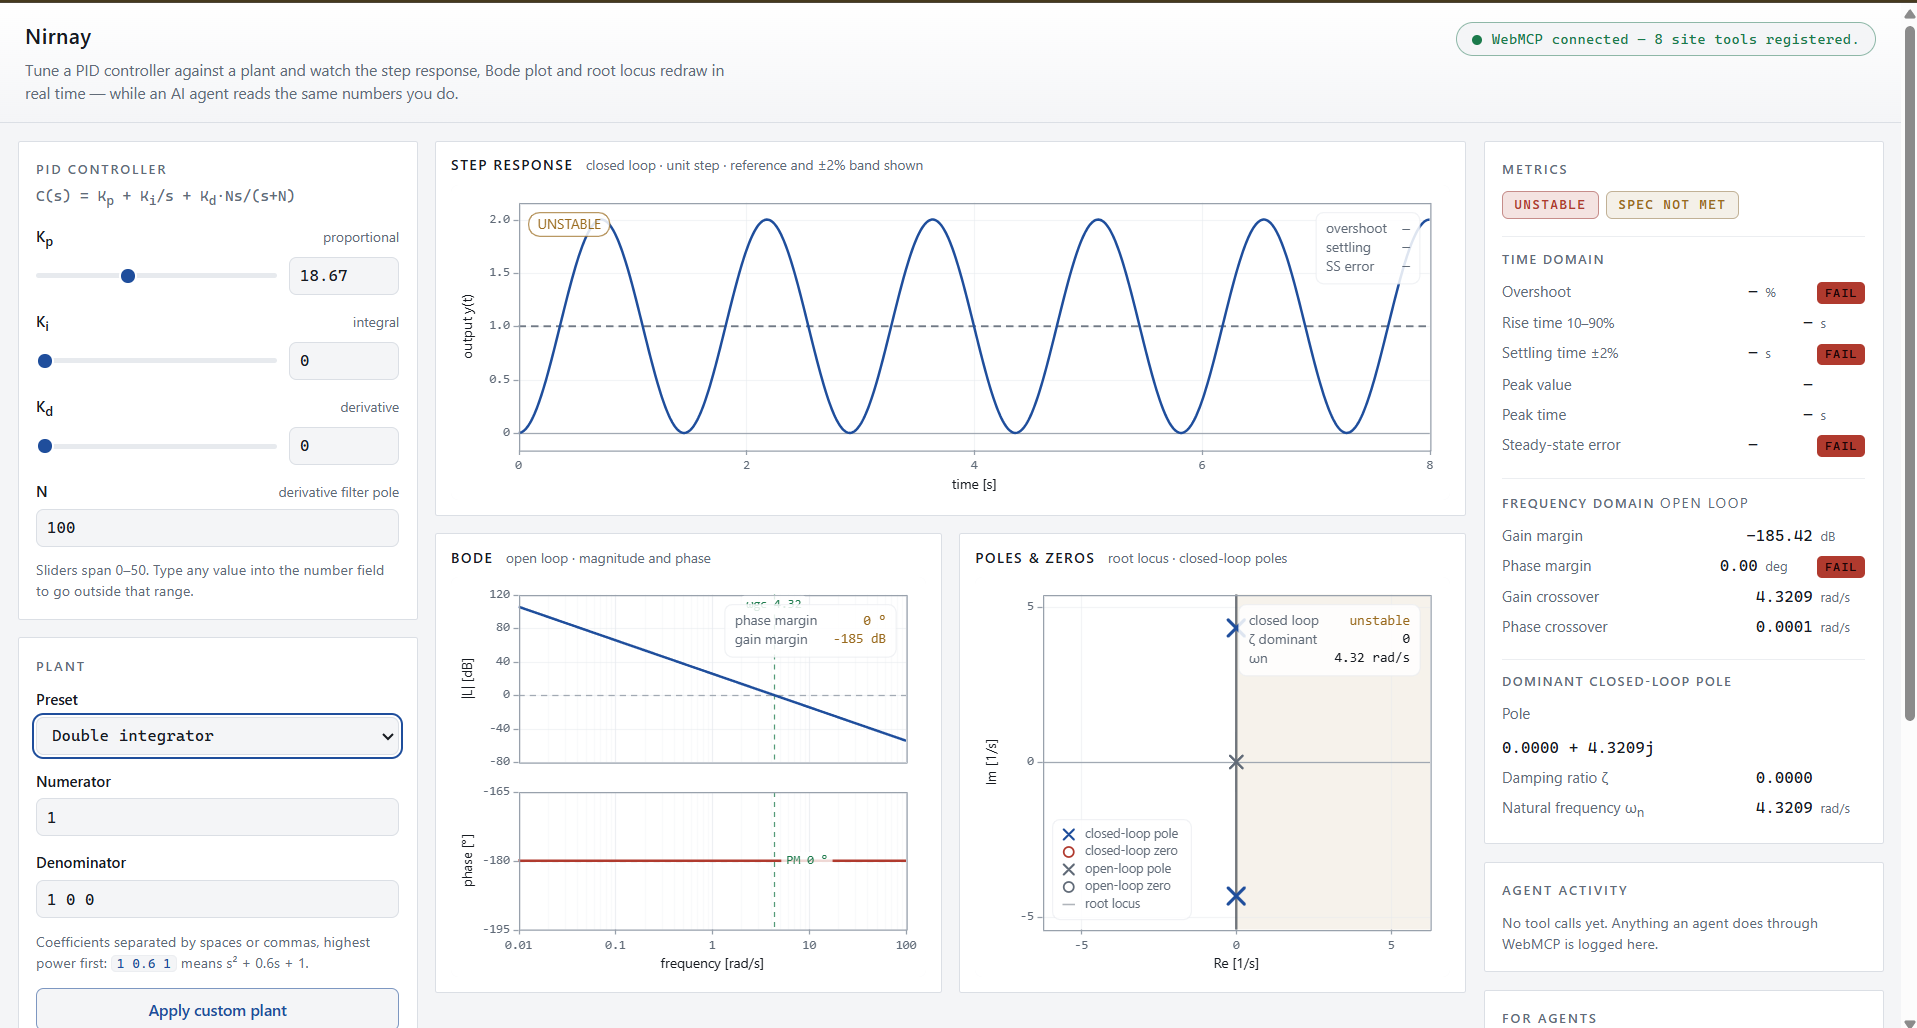
These are the Parameters 1 a
-
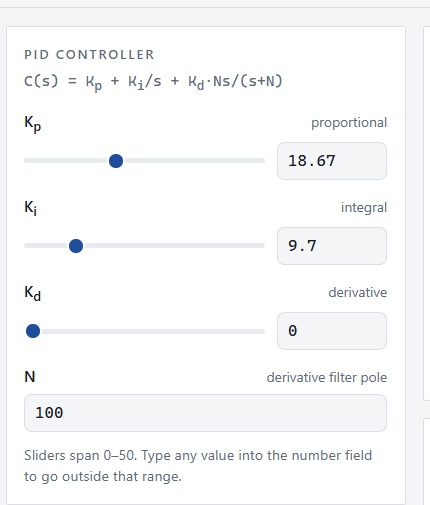
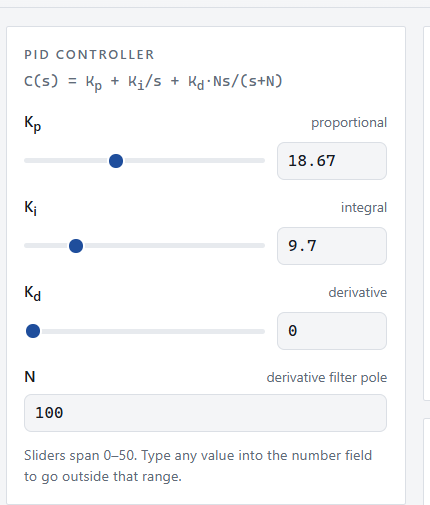
These are the Parameters 2 a
-
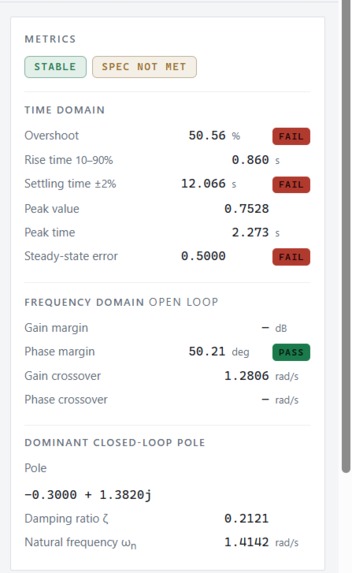
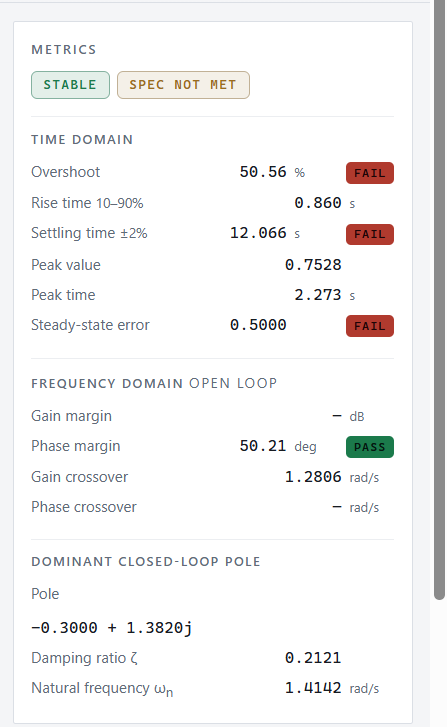
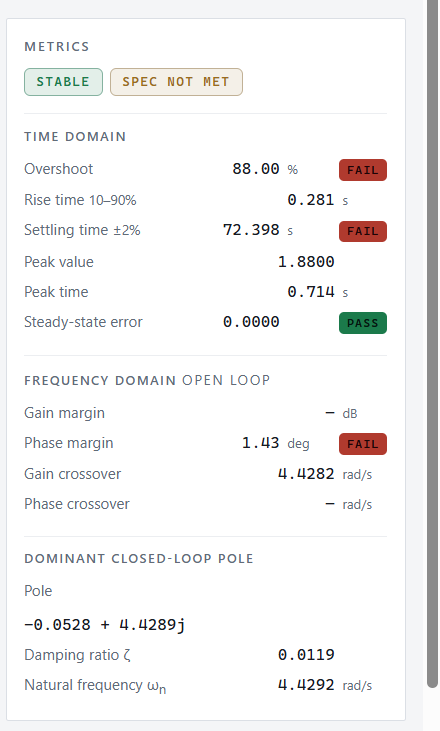
These are the test results got by setting the parameters as in the Image Nirnay-Parameters 1 b and 1 a
-
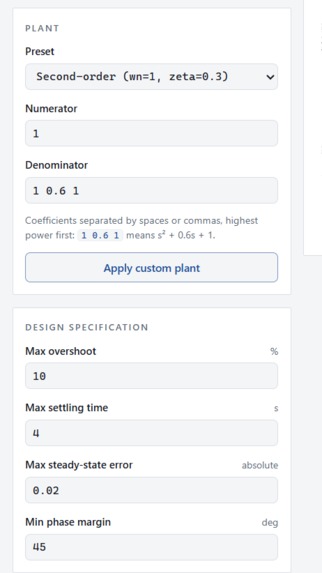
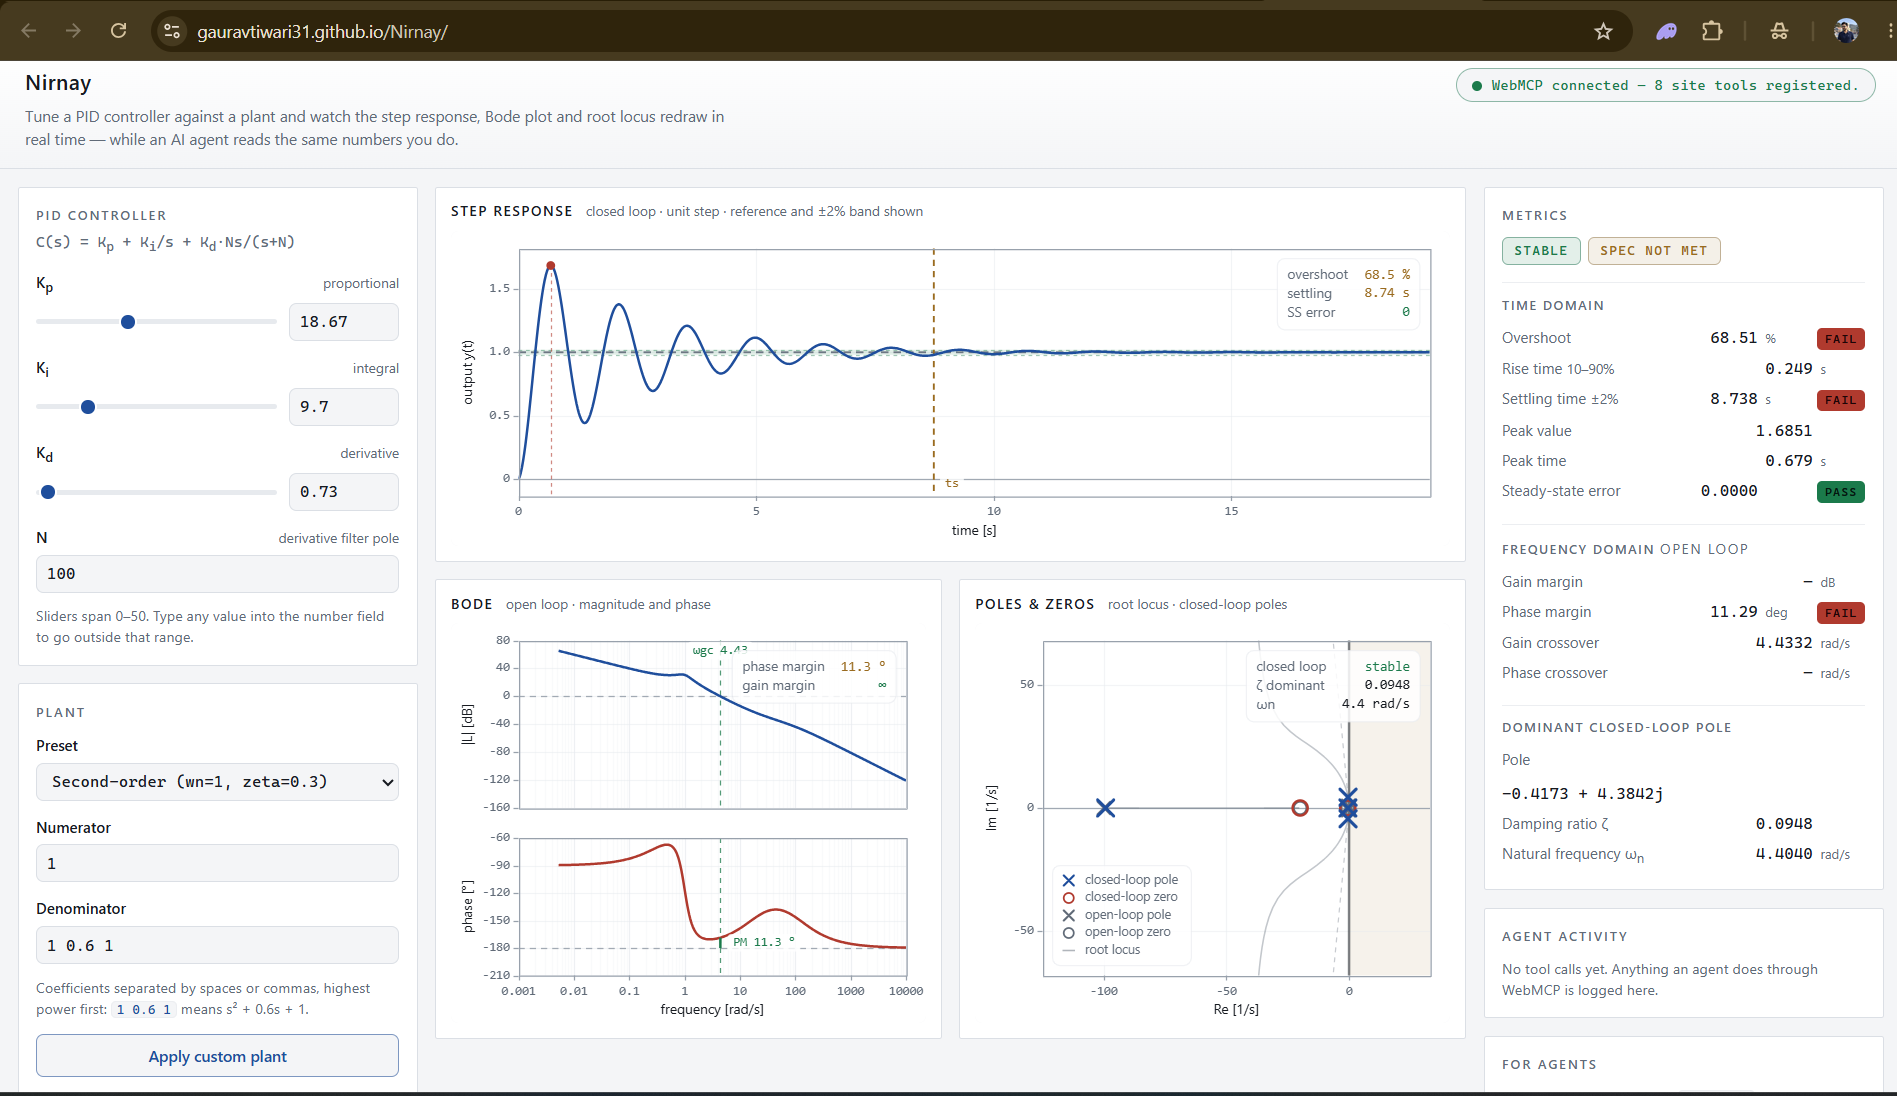
These are the Parameters 1 b
-
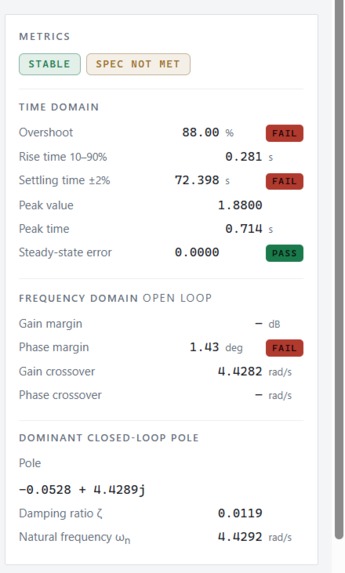
These are the test results got by setting the parameters as in the Image Nirnay-Parameters 2 b and 2 a
-
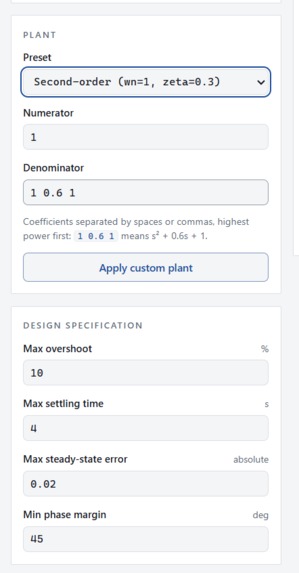
These are the Parameters 2 b
-
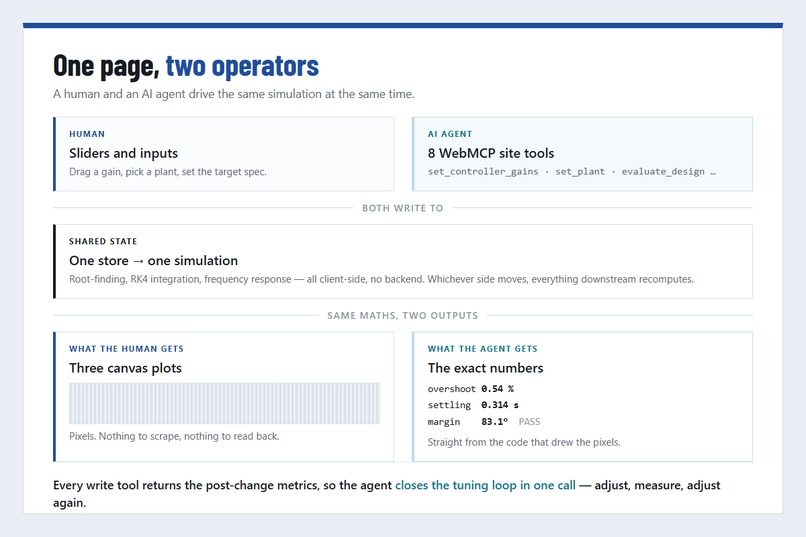
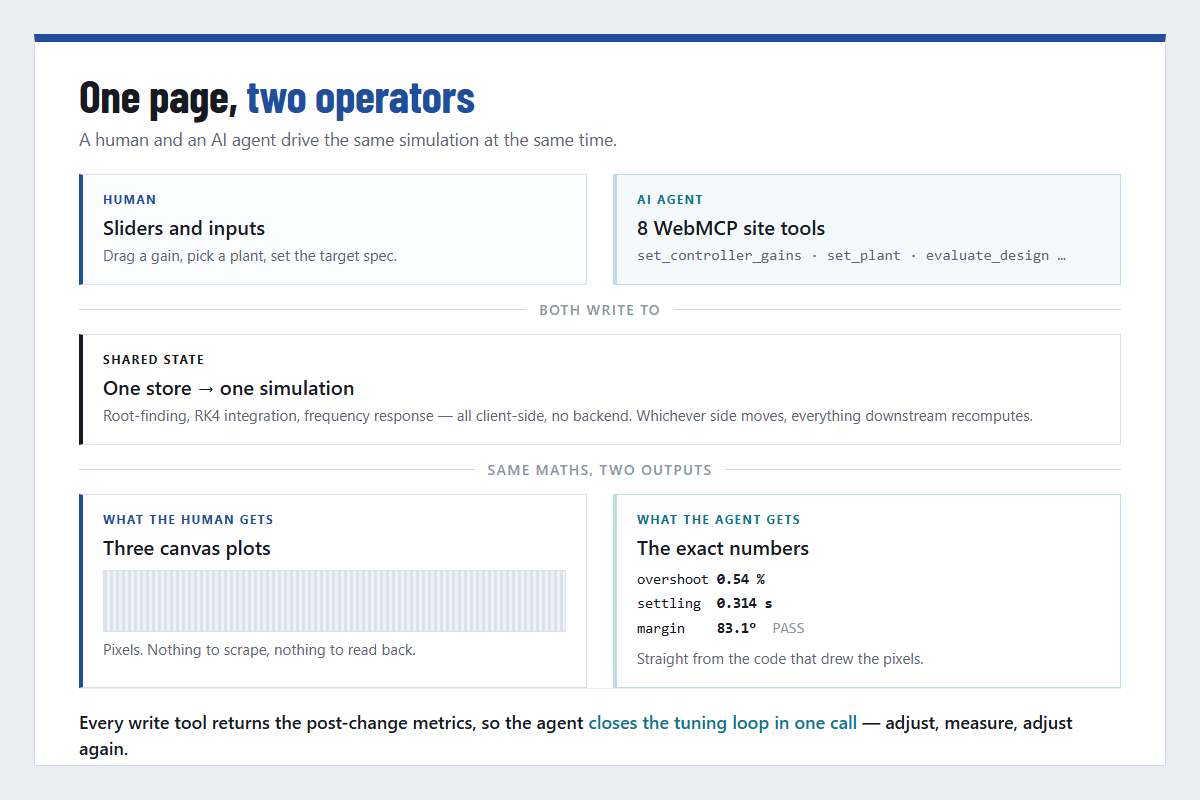
This is image that depicts how Nirnay works.
-
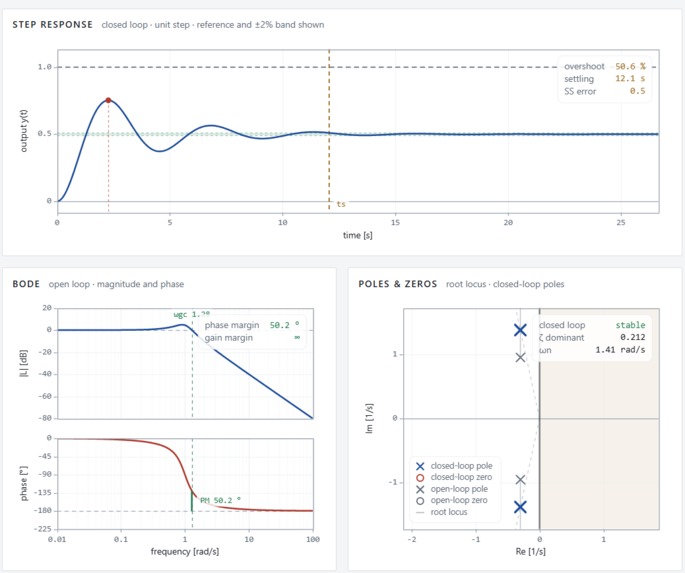
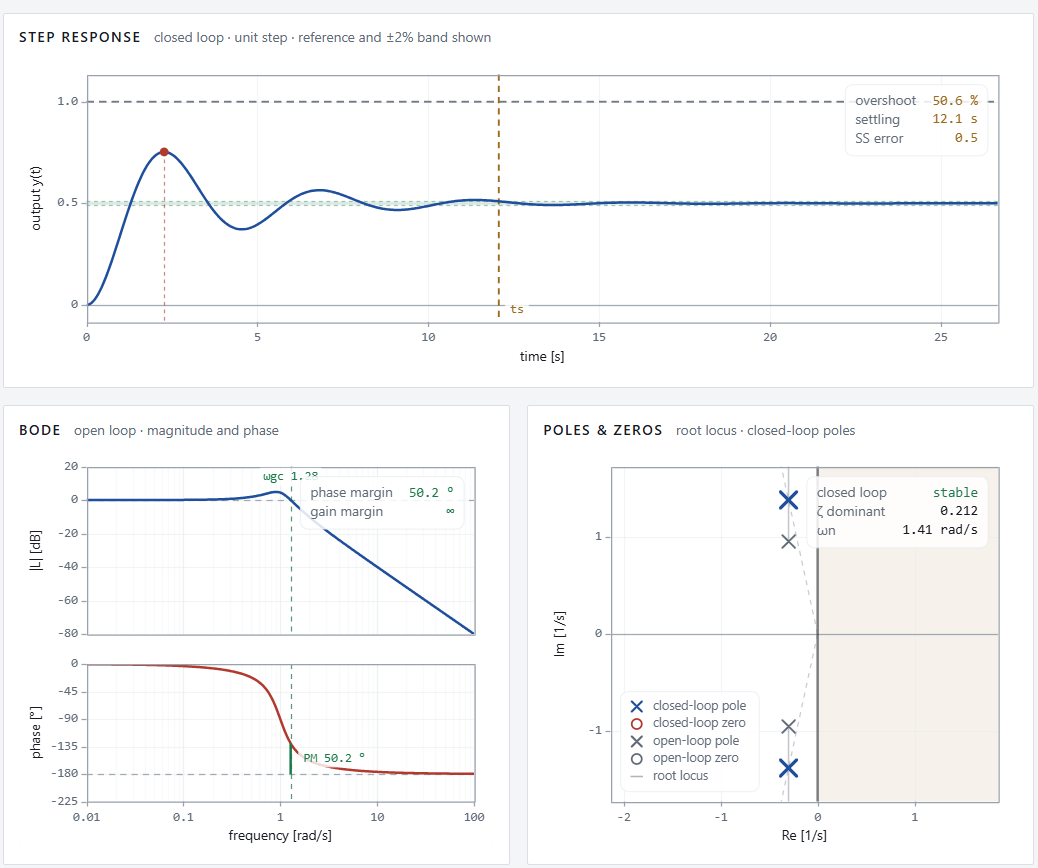
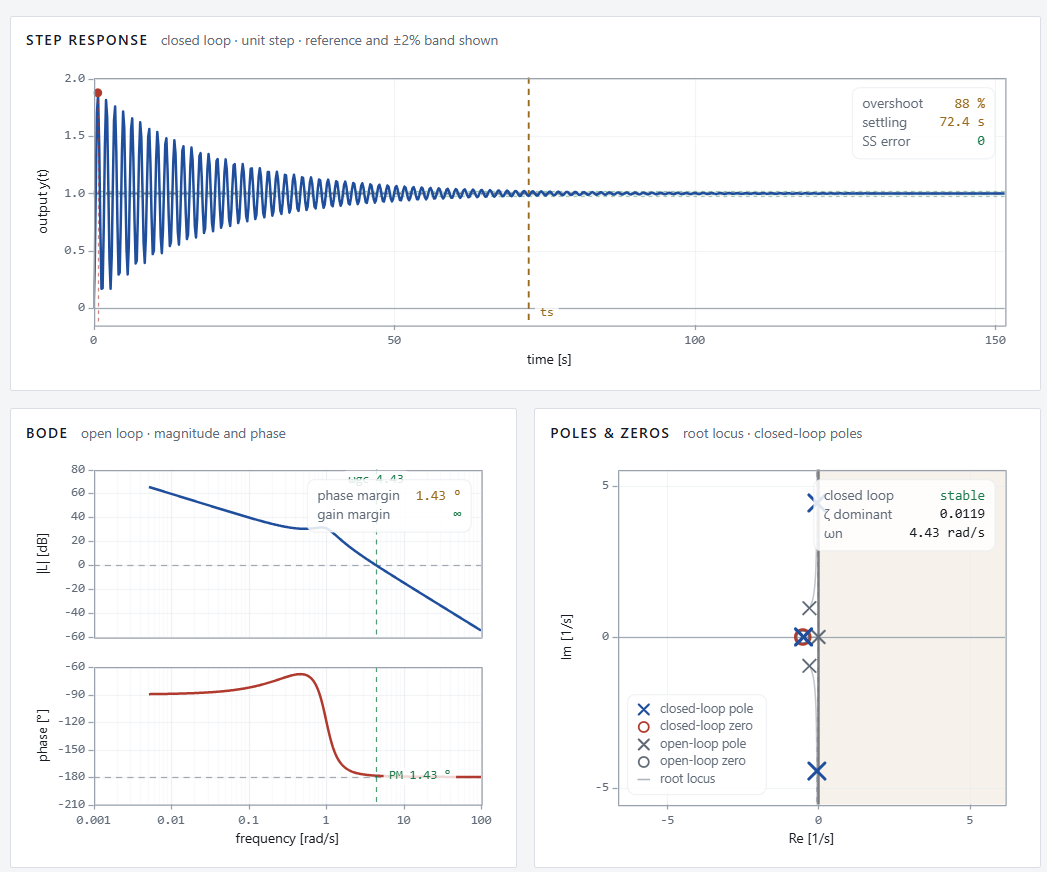
These are the Graphs got by setting the parameters as in the Image Nirnay-Parameters 1 b and 1 a
-
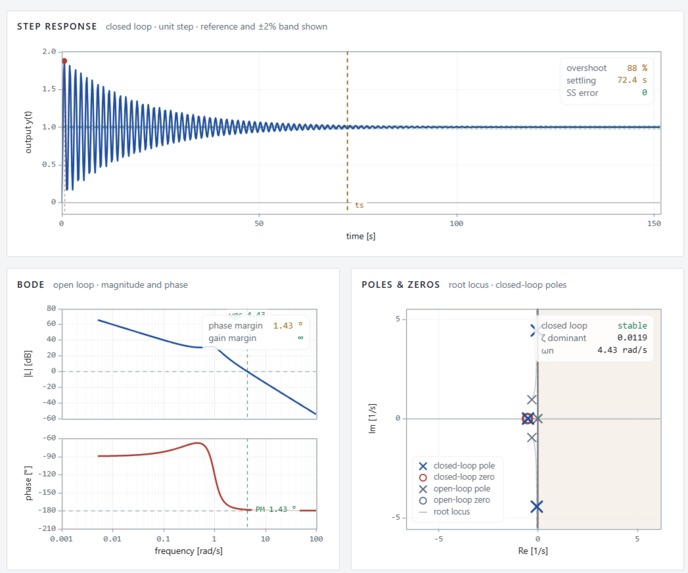
These are the Graphs got by setting the parameters as in the Image Nirnay-Parameters 2 b and 2 a
-
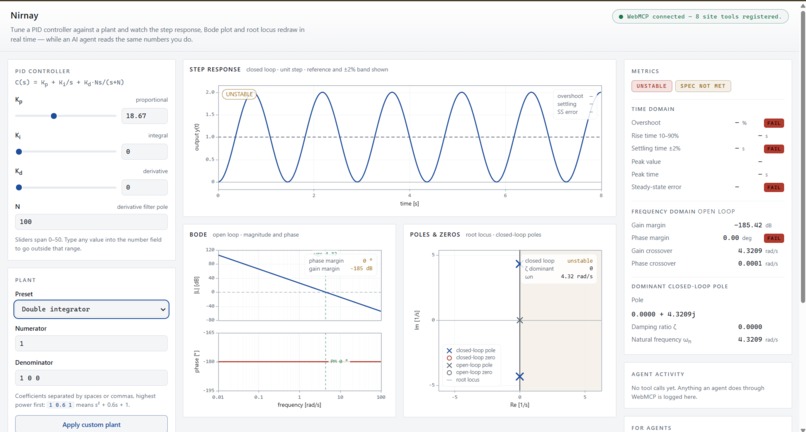
Home page After changing some parameters (Random parameters part B)
-
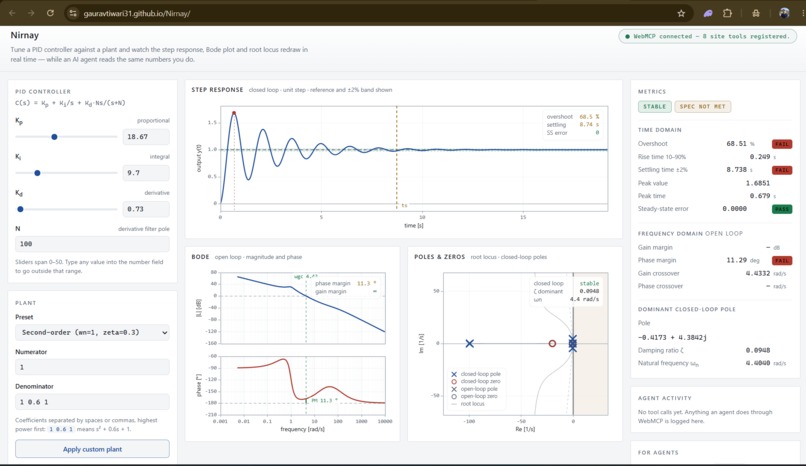
Home page After changing some parameters (Random parameters part A)
-
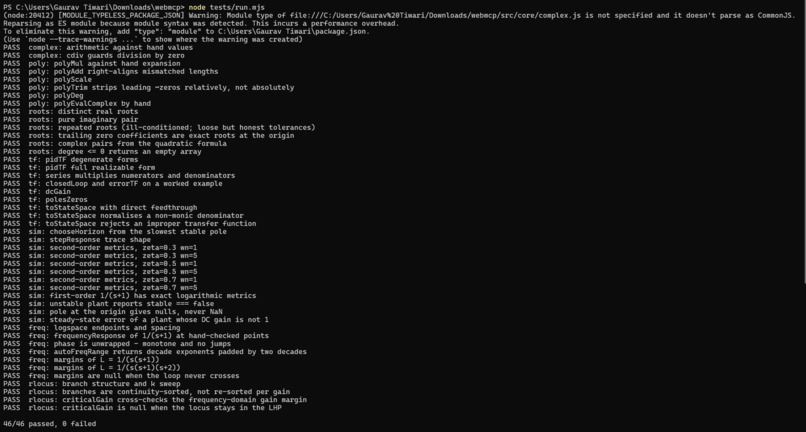
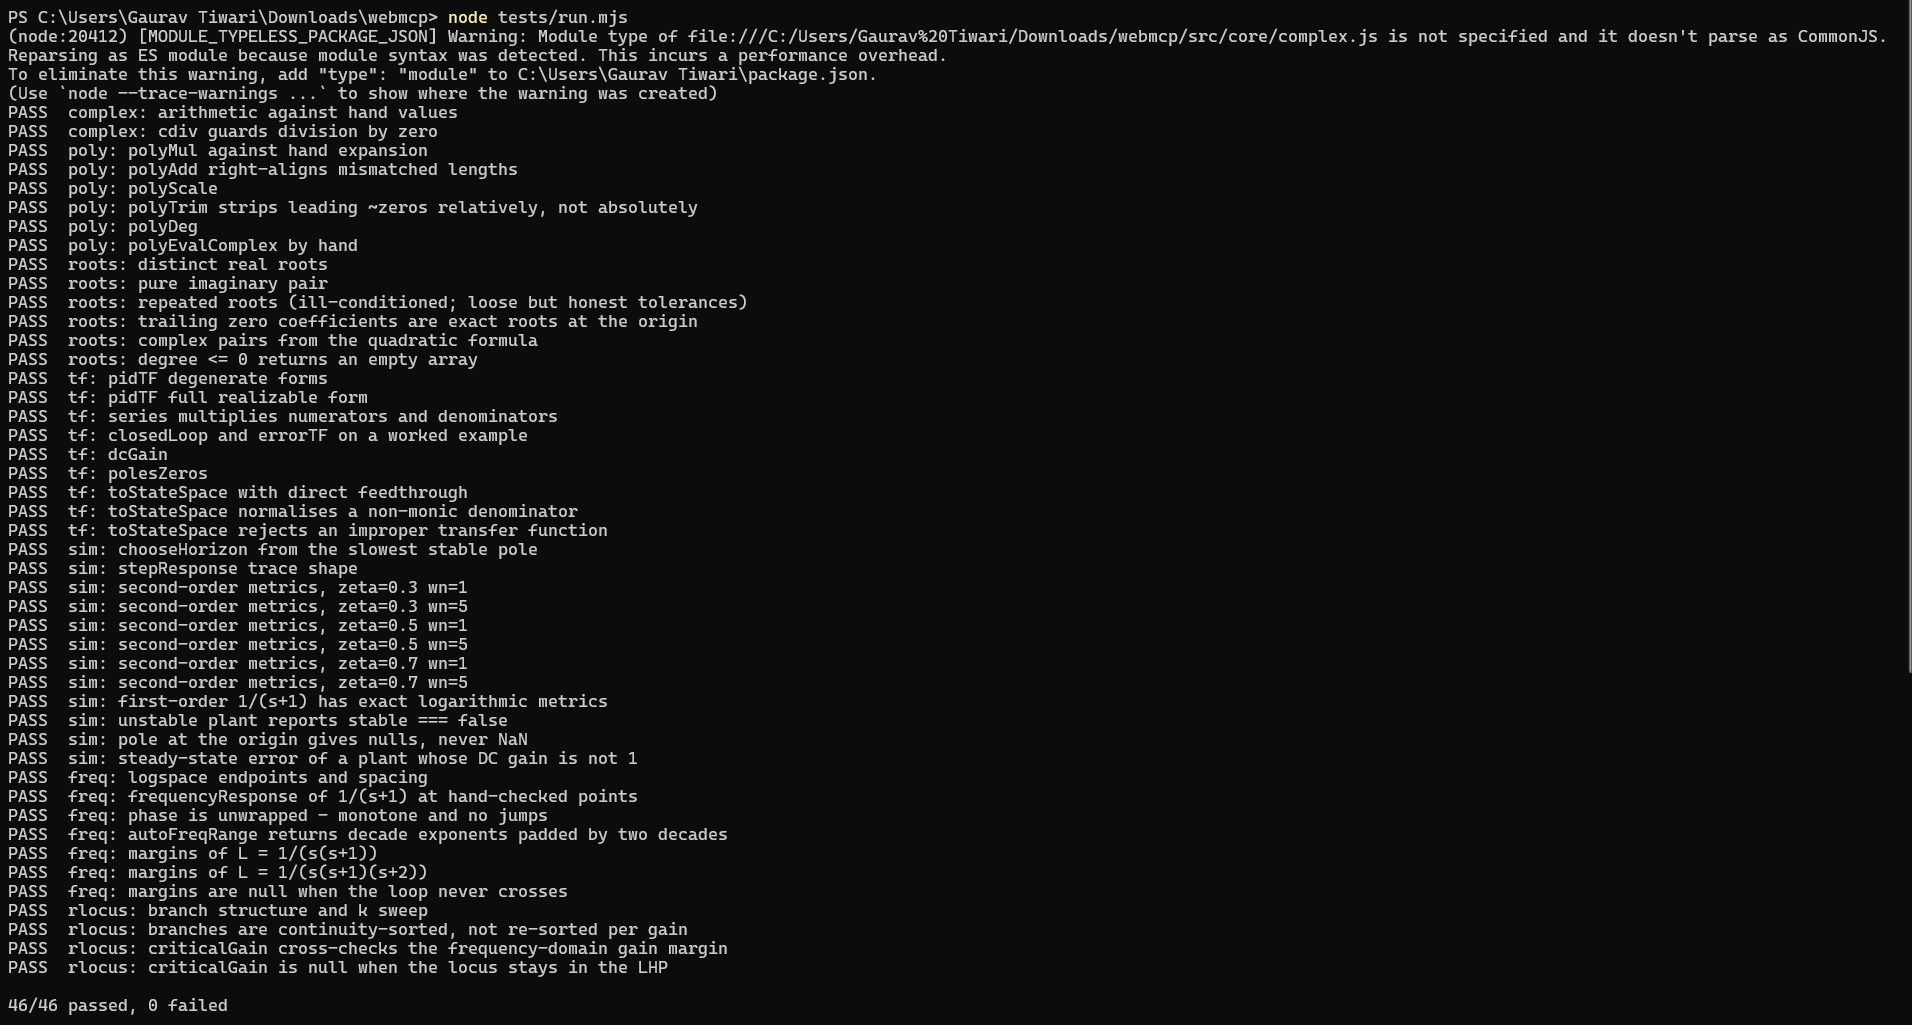
These are the test results that shows all passed 46/46
Inspiration
We spend a lot of time in control systems coursework, and tuning a controller is a strange kind of work: it is entirely about numbers, but you do all of it by staring at pictures. You drag a gain, you squint at a step response, you decide the wobble looks a bit better, you drag again.
When we started reading the WebMCP spec, the first thing we wanted to know was what an agent could actually do on a page like that. The answer turned out to be almost nothing, and the reason was specific enough to be interesting.
A step response, a Bode plot and a root locus are drawn on an HTML <canvas>.
A canvas is coloured pixels. There is no text under it, no DOM, nothing to
scrape. Hand a vision model a screenshot of a step response and ask for the
overshoot and you get "roughly 25%" — a guess read off pixel positions. You
cannot tune a controller on "roughly". The entire task is hitting a number like
"under 10%", and 12% and 18% call for opposite corrections.
So this was not a case of an agent being clumsy with a UI. The information the agent needed did not exist anywhere it could reach. It only existed as floating point numbers inside the running program. That felt like the sharpest possible answer to "why WebMCP?", so we built the page around it.
What it does
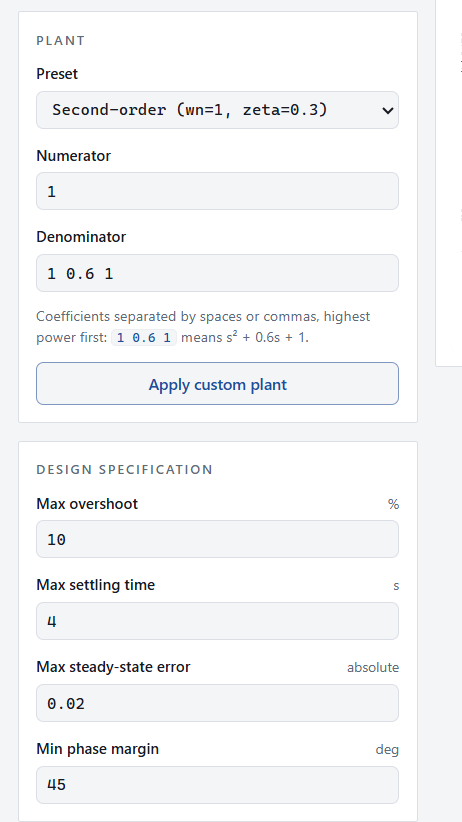
Nirnay is a control-system design bench. You pick a plant, drag sliders for the three PID gains, and three plots redraw instantly — step response, Bode, and a root locus / pole-zero map. On the right there is a scoreboard: every performance metric with a green PASS or red FAIL chip against design targets you set yourself.
The page exposes eight WebMCP tools, so an AI agent in the same page can read the exact simulation numbers and tune alongside you.
The important part is that there is one shared state behind everything. The sliders and the agent's tools write to the same place. When the agent changes a gain, the sliders physically move, the plots redraw and the scoreboard updates while you watch. You can grab a slider back mid-conversation and the agent's next reading reflects it. Neither side is driving a copy of the other's world.
There is also an agent activity log on the page that prints a line every time a tool is called, so a human watching the screen can see exactly what just happened and why.
The page opens in a deliberately failing state — 50.6% overshoot against a 10% target, three of four specs red. That is on purpose. It gives the agent something real to fix instead of a victory lap.
The eight tools
Five read, three write.
Read: get_system (full current setup), run_step_response (exact overshoot,
rise time, settling time, steady-state error), get_frequency_response (gain and
phase margins, crossover frequencies), get_pole_zero_map (closed-loop poles,
damping, and how far the gain can be pushed before instability), evaluate_design
(score against targets, and what is still failing and by how much).
Write: set_controller_gains, set_plant, set_design_spec.
Three design decisions shaped how well this actually works:
Every write tool returns the full measured result. set_controller_gains does
not reply "done". It replies with the new overshoot, settling time, margins, pole
positions and a pass/fail verdict. The obvious design is write-then-read, two
calls per attempt. Returning the measurement with the write halves the round trips,
but the real reason is that it keeps the agent anchored to a measurement instead of
to its own prediction of what those gains would do. Agents are good at confidently
predicting the wrong outcome.
No tool ever returns a bare OK. Every response carries numbers the agent can check itself against. That is what lets it notice a change made things worse and back it out, rather than marching in the wrong direction.
Bad input gets a sentence, not a stack trace. Pass a string where a number
belongs and you get Error: Kp must be a finite number, got a string. A crashed
tool call teaches an agent nothing. A sentence naming the mistake lets it retry.
Read tools are marked with readOnlyHint so the browser does not interrupt with a
confirmation prompt on every measurement, which matters a lot once the agent starts
iterating.
How we built it
Everything runs in the browser. No server, no backend, no libraries, no build step — plain JavaScript files the browser loads directly. That was a deliberate choice: one deployable artifact, one failure point, and nothing between the plot and the tool that could make them disagree.
The numerics, roughly in layers:
- Polynomial arithmetic as the base, since transfer functions are ratios of polynomials.
- Durand–Kerner for root finding, which chases all roots simultaneously. Roots sitting exactly at zero stall it, so those get peeled off first.
- RK4 integration for the step response, running twenty times finer than it records so the stored curve is smooth and trustworthy.
- Bisection to locate the gain and phase crossover frequencies exactly, rather than reporting the closest point on a sampled grid.
- Root locus by sweeping gain and matching each root to its nearest previous position, so drawn branches follow one root smoothly instead of jumping where two roots pass close together.
Tool registration sits behind a feature check, so in a browser without WebMCP the page is simply a complete engineering tool with no agent. Nothing breaks and nothing looks broken.
Who built what
Nirnay was built by two of us.
Challenges we ran into
The bug that the cross-check caught. The gain at which a system goes unstable can be computed two entirely different ways: from the root locus, tracking roots in one mathematical space, and from the frequency response, tracking phase in a completely different one. They share no code. We wrote a test asserting they agree.
They did not. The root locus said 6, the frequency path said 6.0577. The root locus was right. The bug was a rare edge case in the frequency path: the search grid happened to land exactly on the answer, which broke an assumption the refinement step depended on.
We would never have found that by looking at a graph. Both curves looked fine. It is exactly the kind of quiet wrongness that makes a tool useless to an agent, because the agent has no way to sanity-check what it is handed — it will act on 6.0577 with total confidence.
Testing before implementing. The test suites were written independently of the implementation and check against answers known from theory, not from our own code: closed-form textbook formulas for second-order overshoot and peak time, matched to within 0.5%, and classic worked examples whose margins can be derived by hand. 46/46 numerics tests and 111/111 browser tests pass from a fresh clone.
Testing the browser half. Node cannot test browser behaviour, so there is a second suite that loads the real page markup, fakes the WebMCP connection, and checks the things that only exist in a browser: that all eight tools register, that each describes its inputs properly, that read tools are correctly marked read-only, that bad input produces a readable error, and that when a tool changes a gain, the sliders on the page actually move. That last assertion is the entire human-and-agent premise in one line.
Learning the platform. A few things cost us time and are not obvious from the
spec alone: it is document.modelContext, not navigator.modelContext, which many
older examples still use. Tools registered inside iframes are not discovered, even
same-origin, so everything has to live on the top-level page. The declarative HTML
form API is not supported yet, so registration is JavaScript only. And WebMCP is a
secure-context feature, so opening the file over file:// silently gives you no
tools at all.
Writing descriptions the agent actually reads. Our first pass had terse tool
descriptions and the agent kept reaching for generic browser control before listing
site tools. Tightening the input schemas — real descriptions on every property,
additionalProperties: false — was what made it go straight to the right tool.
What we learned
The thing we did not expect is how much the shape of the return value determines agent behaviour. Same tools, same schemas: return "OK" and the agent drifts, because it has to fall back on predicting the effect of its own change. Return the measurement and it self-corrects. Almost all of the quality difference came from what the tools hand back, not from what they accept.
The other lesson is that a canvas is not an accessibility problem to work around. It is a category of information that genuinely does not exist in the DOM, and the right fix is to expose the source numbers rather than to make the picture more legible.
Known limitations
The model assumes unconstrained control effort. Real actuators saturate, and the aggressive gains that produce the fastest settling times here would demand more authority than a real system has. Saturation is not modelled yet, and pretending it does not exist is the most common way a good paper design fails in hardware. It is the first thing on the list below for that reason.
What's next for Nirnay
- Actuator saturation limits, so designs are physically honest.
- Disturbance and noise simulation — how well does a design reject a shove, not just follow a command?
- Discrete-time control, since real controllers run on a clock.
- Letting the agent export a tuning session as a written design report, so the conversation ends in something you can hand to someone else.


Log in or sign up for Devpost to join the conversation.