-
-
grapgs_and_data
-
night_heatmap
-
sources
-
heatmap_data
-

heatmap_data
-
heatmap_data
-
heatmap_data
-
signals_page
-

heatmap_data
-
-
sources_information
-
toolkit_knowledge
-
main_page
-

map_with_information


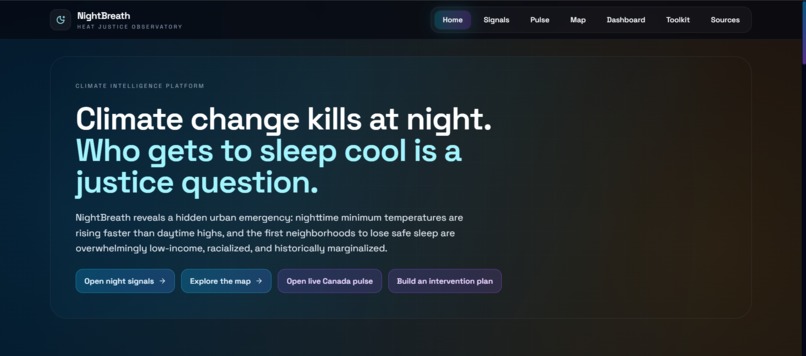
NightBreath
The heat doesn't leave when the sun does.
Inspiration
In the summer of 2024 — the hottest year in recorded human history — emergency departments across North America saw a pattern that most climate dashboards completely miss. The patients arriving with heat stroke, cardiac events, and organ failure weren't collapsing at 3 PM under the blazing sun. They were being found at 6 AM, in their bedrooms, after nights where the temperature never dropped below 28°C.
Heat kills more people annually than hurricanes, floods, tornadoes, and lightning combined. And the science tells us something that almost no public tool visualizes: the majority of heat deaths happen at night (Murage et al., 2017).
The biology is simple and terrifying. During the day, your core temperature rises. At night, your body must shed that accumulated heat through thermoregulation — a process that requires ambient air to drop below roughly 25°C. When nighttime temperatures stay above that threshold — which is happening more frequently in cities worldwide — the body cannot recover. Cardiovascular strain accumulates. After three to four consecutive nights without physiological recovery, organs begin to fail.
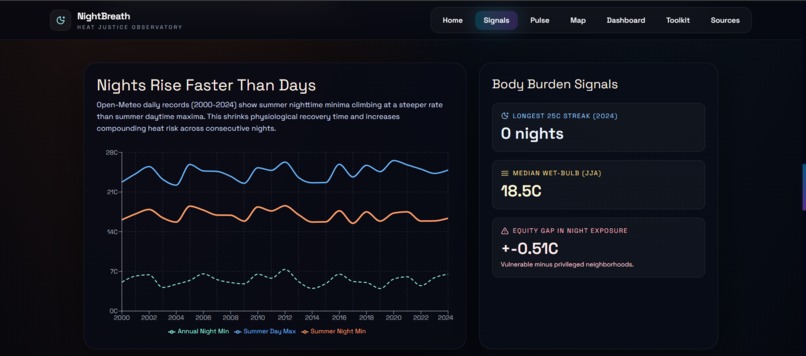
And here is the part that turned this from a science problem into a justice problem for our team: nighttime minimum temperatures are rising nearly twice as fast as daytime maximums (Zhao et al., 2014). The neighborhoods losing their cool nights first are almost perfectly correlated with historically marginalized communities — less tree canopy, more heat-absorbing pavement, older housing stock, lower incomes, and less access to air conditioning.
Every city has daytime heat maps. Almost none have nighttime vulnerability tools. No one is mapping who can't sleep, who can't recover, and who will die when the next multi-night heat event arrives.
NightBreath exists to change that.
What It Does
NightBreath is an interactive climate intelligence platform that makes the invisible nighttime heat crisis visible and translates vulnerability data into equity-first action plans. It is designed for city climate offices, public health teams, community organizations, and anyone who believes that who gets to sleep cool should not be determined by postal code, income, or the color of your skin.
The platform has six integrated modules:
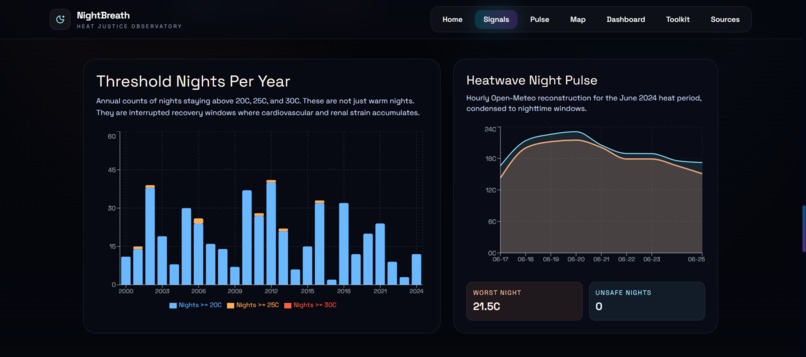
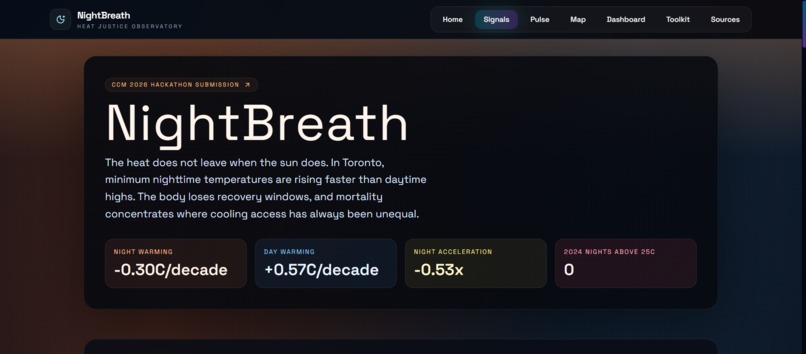
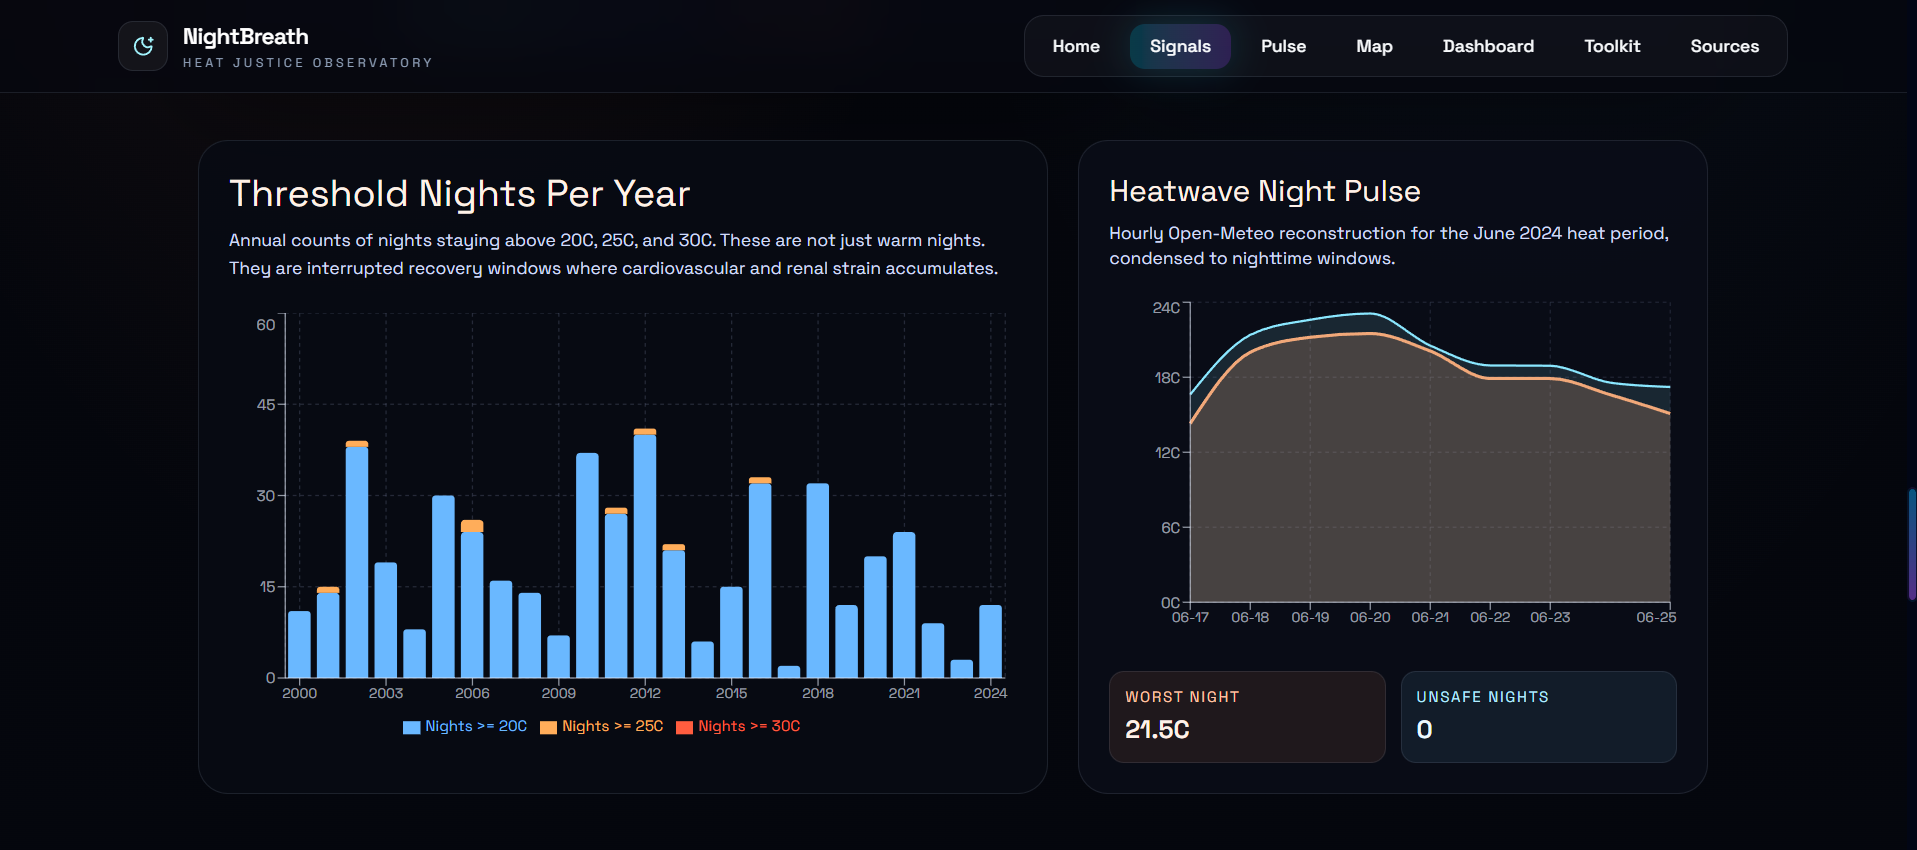
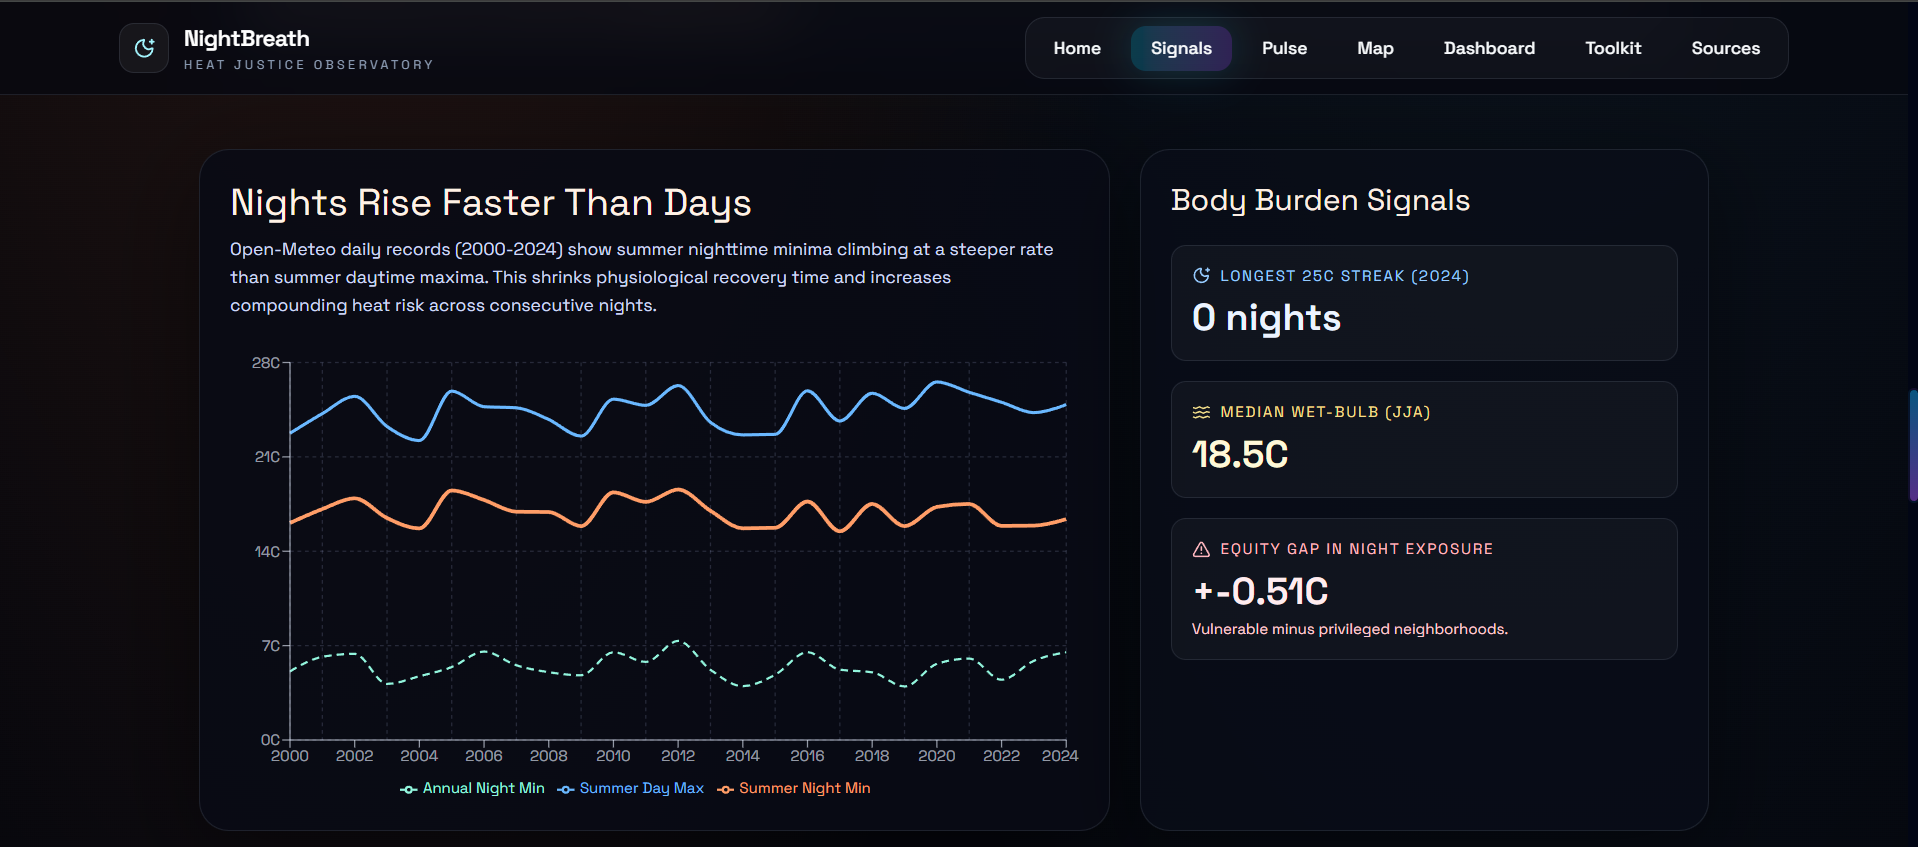
Night Signals (/nightbreath)
A data story experience that visualizes 24 years of real climate data from NASA POWER and Open-Meteo, showing:
- Nighttime minimums rising faster than daytime maximums — animated trend lines that make the divergence undeniable
- The growing number of "threshold nights" per year (nights that never drop below 20°C, 25°C, 30°C)
- Wet bulb temperature trends that show when nights become not just uncomfortable but physiologically unsurvivable
This module exists so that anyone — a mayor, a community organizer, a resident — can understand the science in under 60 seconds.
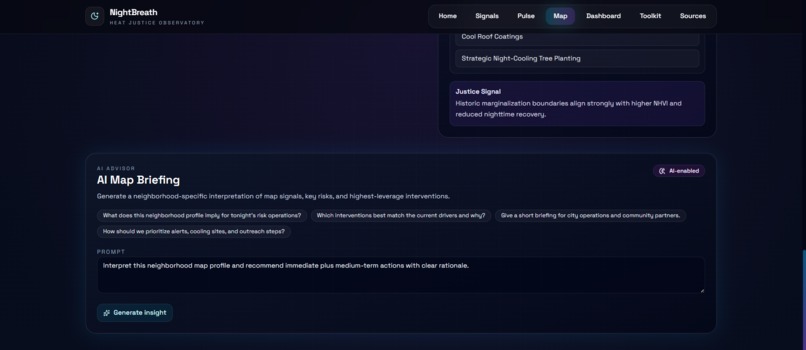
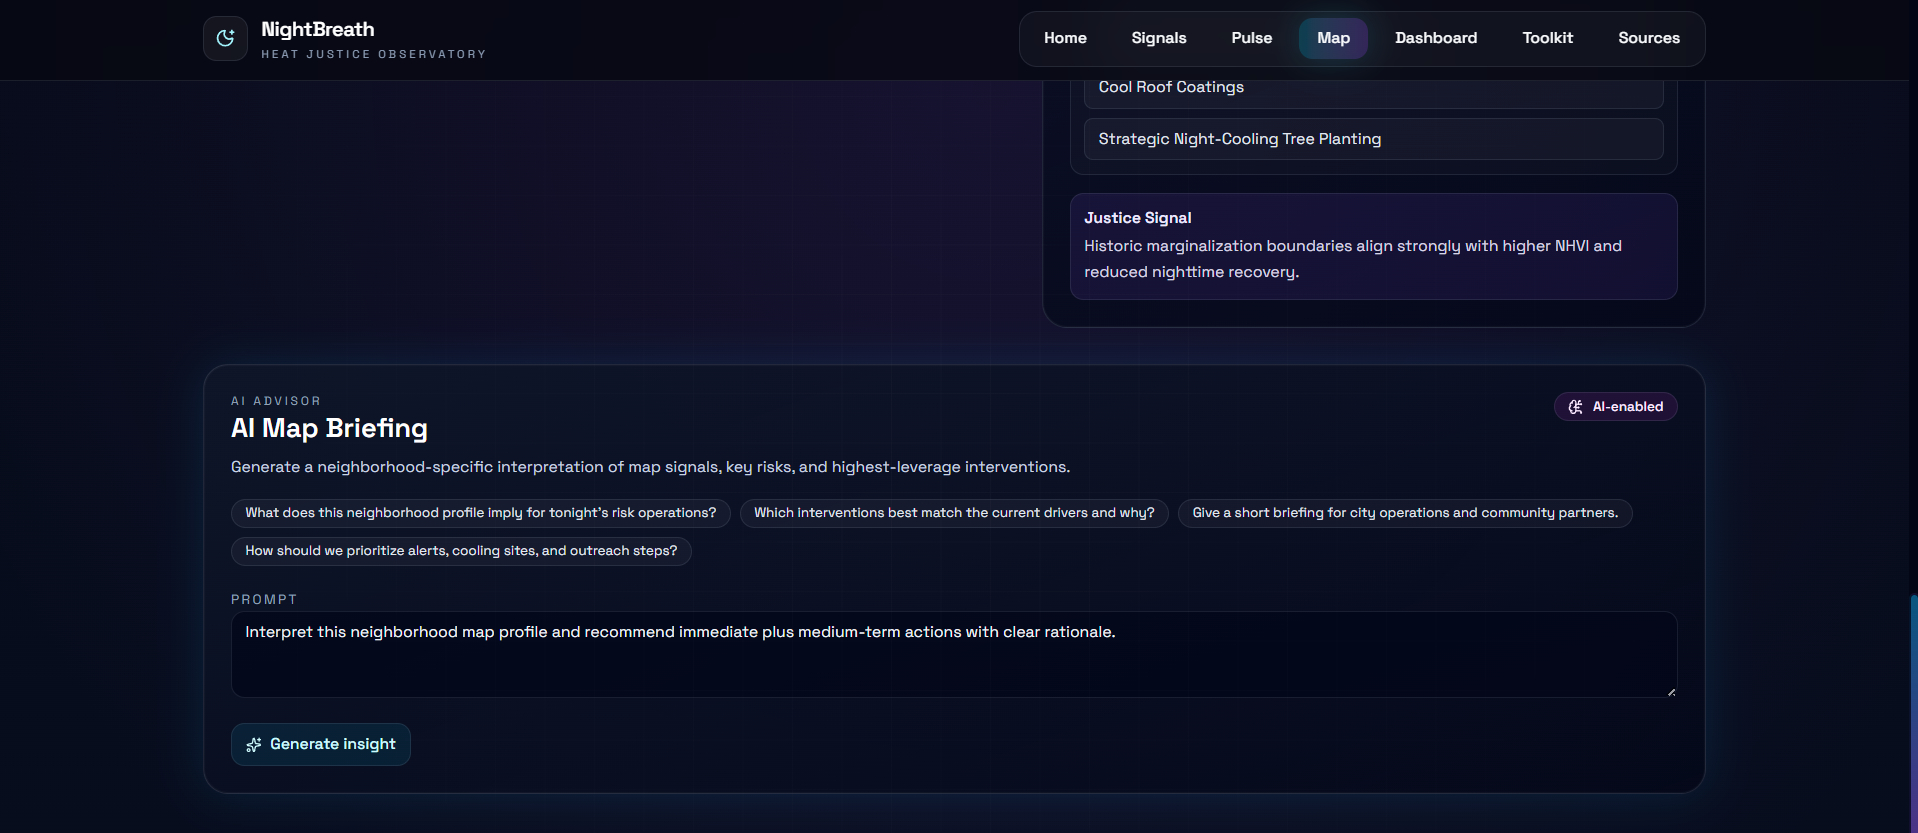
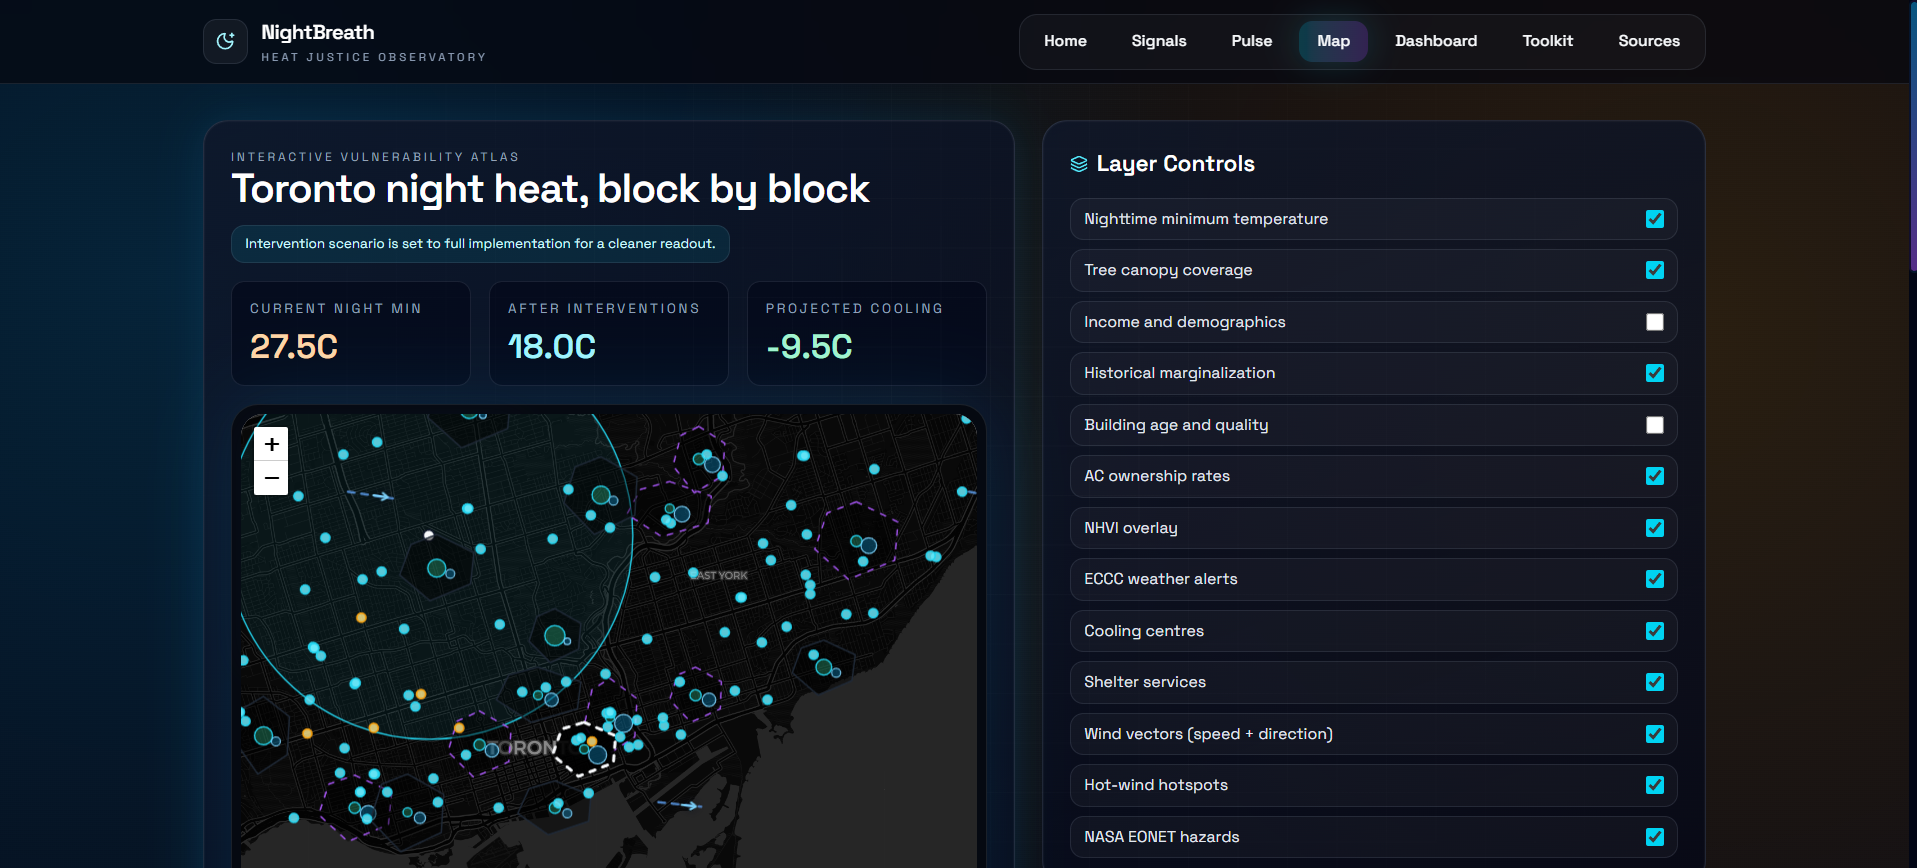
Night Heat Vulnerability Map (/map)
A full-screen interactive map of the Toronto metropolitan area showing block-by-block nighttime heat vulnerability, built on real geospatial data with operational overlays:
- Nighttime temperature heatmap — cool blue to dangerous red
- Tree canopy coverage — revealing the gaps that trap heat
- Demographic and income layers — showing who lives in the hottest zones
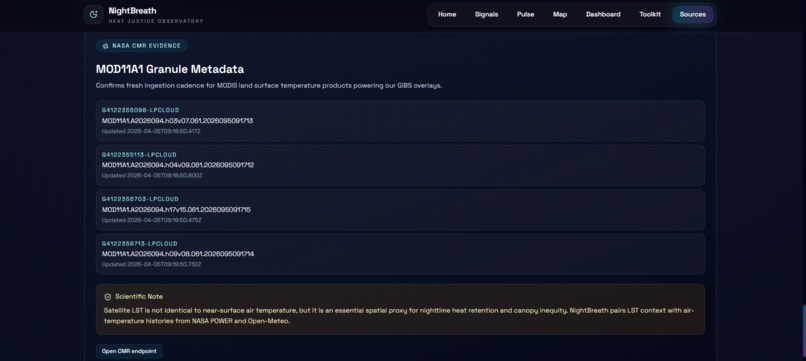
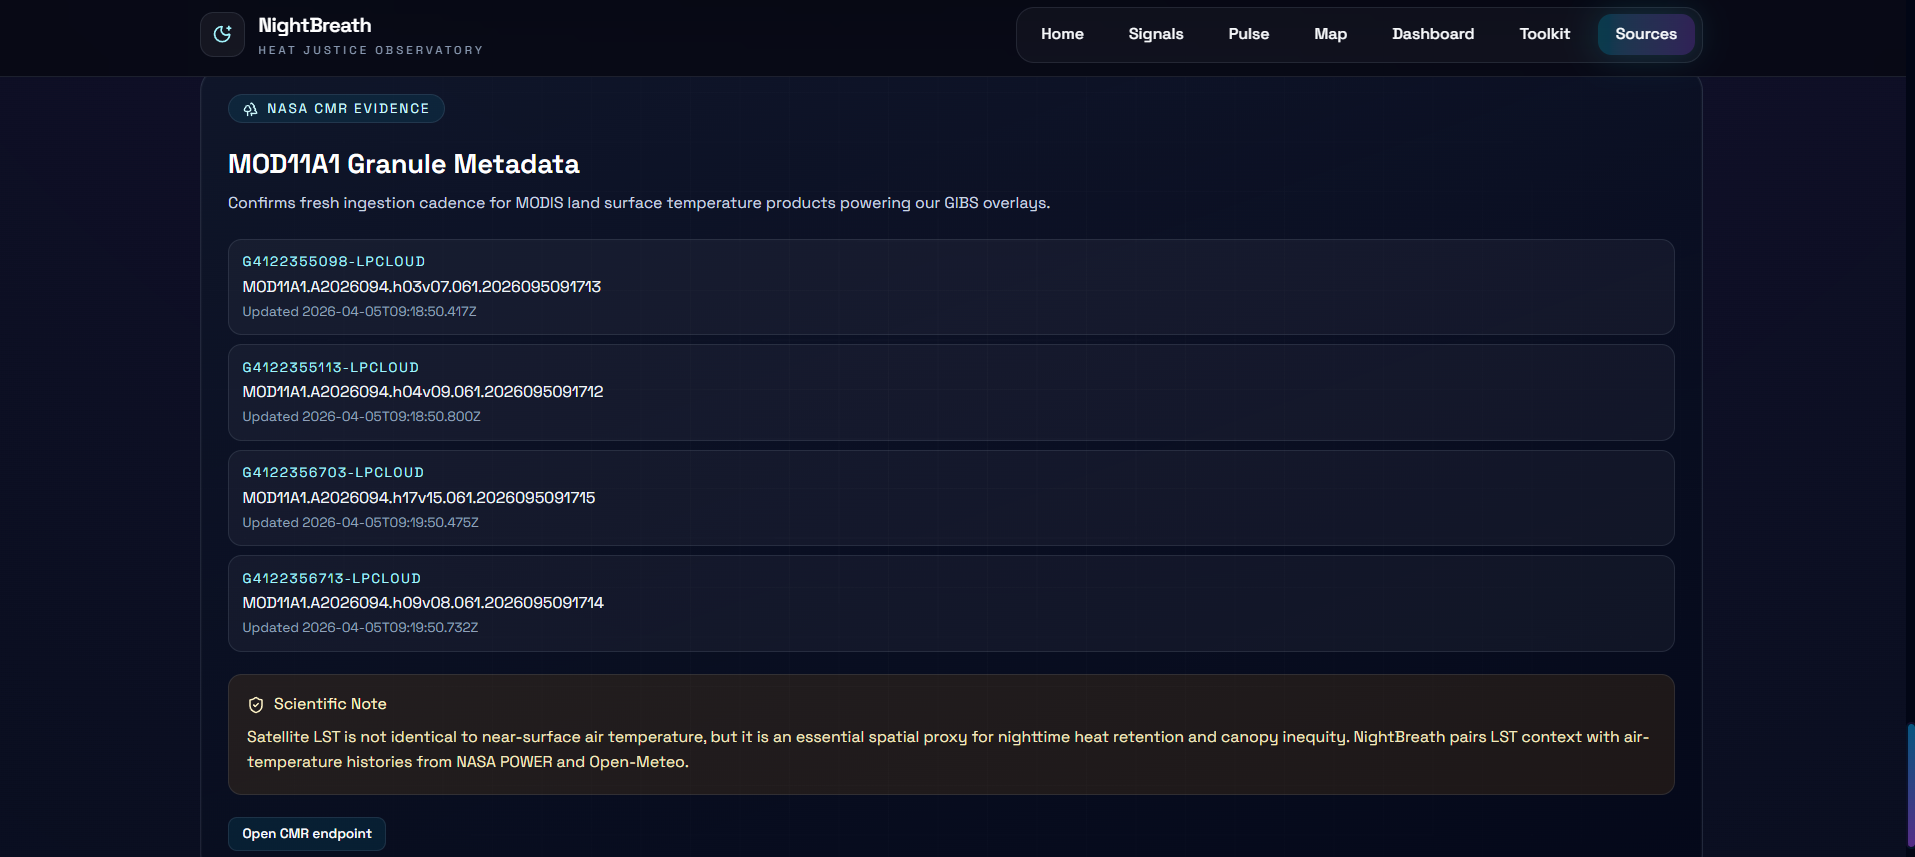
- NASA GIBS satellite imagery — real MODIS nighttime land surface temperature tiles overlaid on the city
- Live natural event data from NASA EONET — wildfires, storms, and active hazards in real time
- Wind trajectory overlays with computed vector fields showing how (or whether) cool air reaches each neighborhood at night
Click any neighborhood to see its full vulnerability profile and auto-generated intervention recommendations.
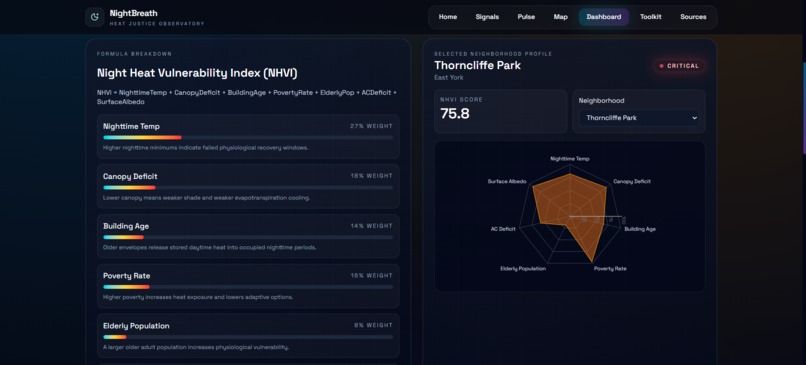
NHVI Dashboard (/dashboard)
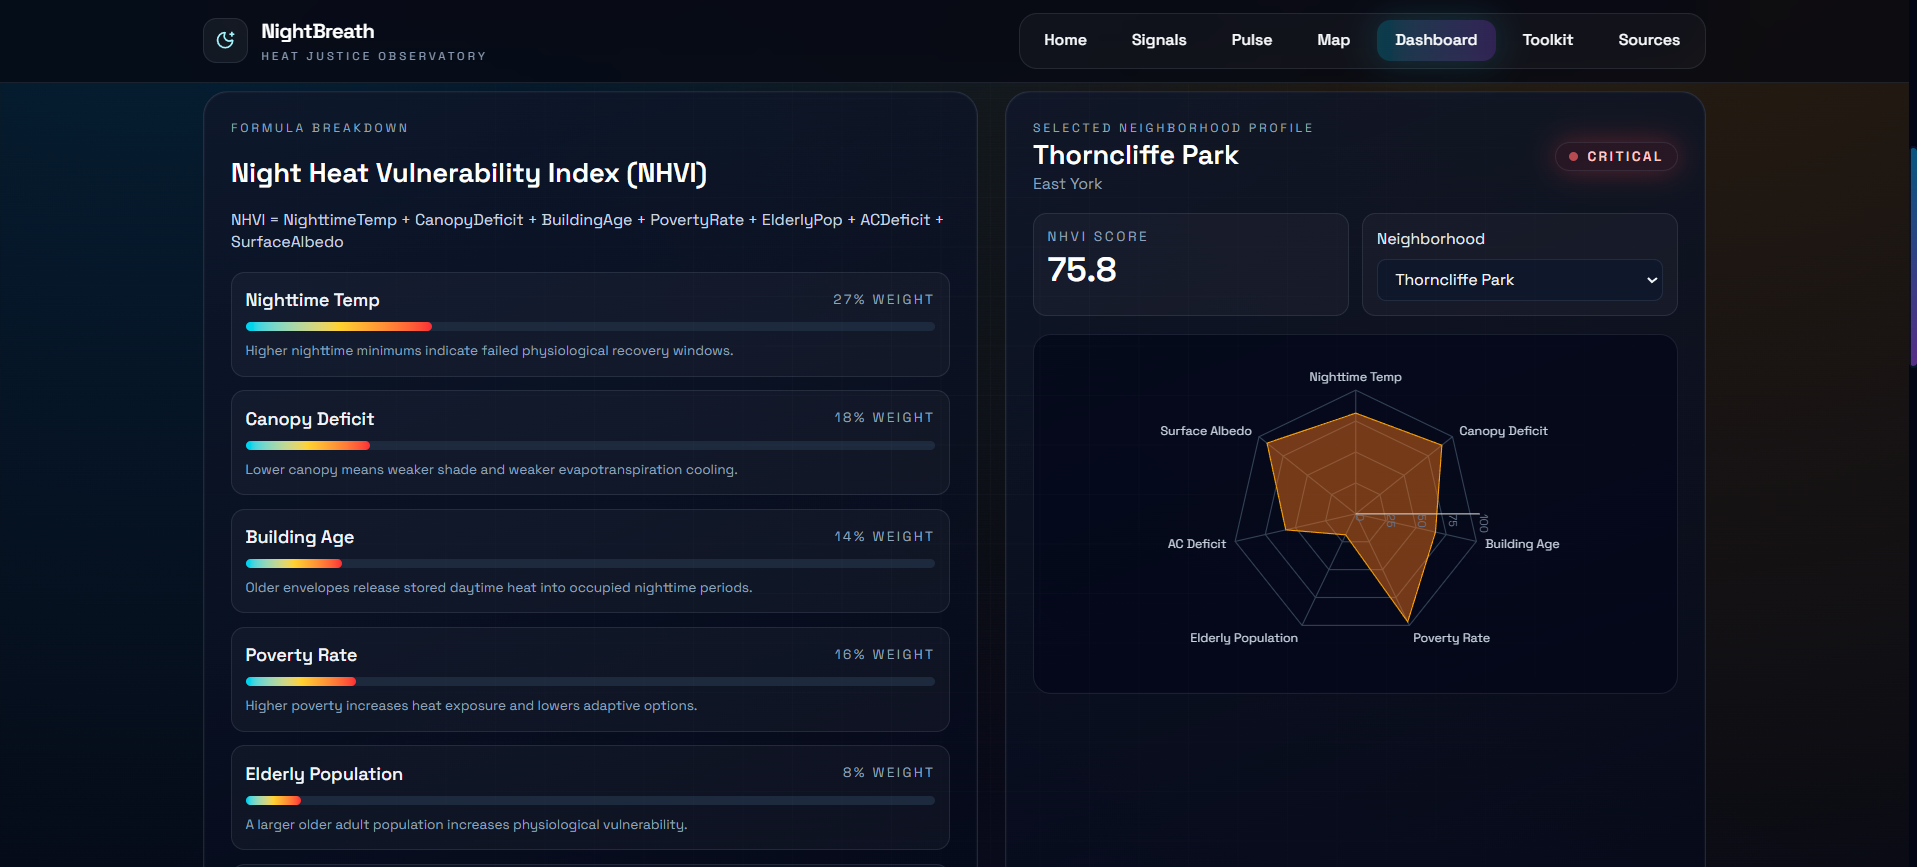
The Night Heat Vulnerability Index is a weighted composite score (0-100) that quantifies each neighborhood's nighttime heat risk:
NHVI = w₁(NighttimeTemp) + w₂(CanopyDeficit) + w₃(BuildingAge) + w₄(PovertyRate) + w₅(ElderlyPopulation) + w₆(ACDeficit) + w₇(SurfaceAlbedo)
The dashboard breaks this down transparently:
- Radar charts showing each factor's contribution for any selected neighborhood
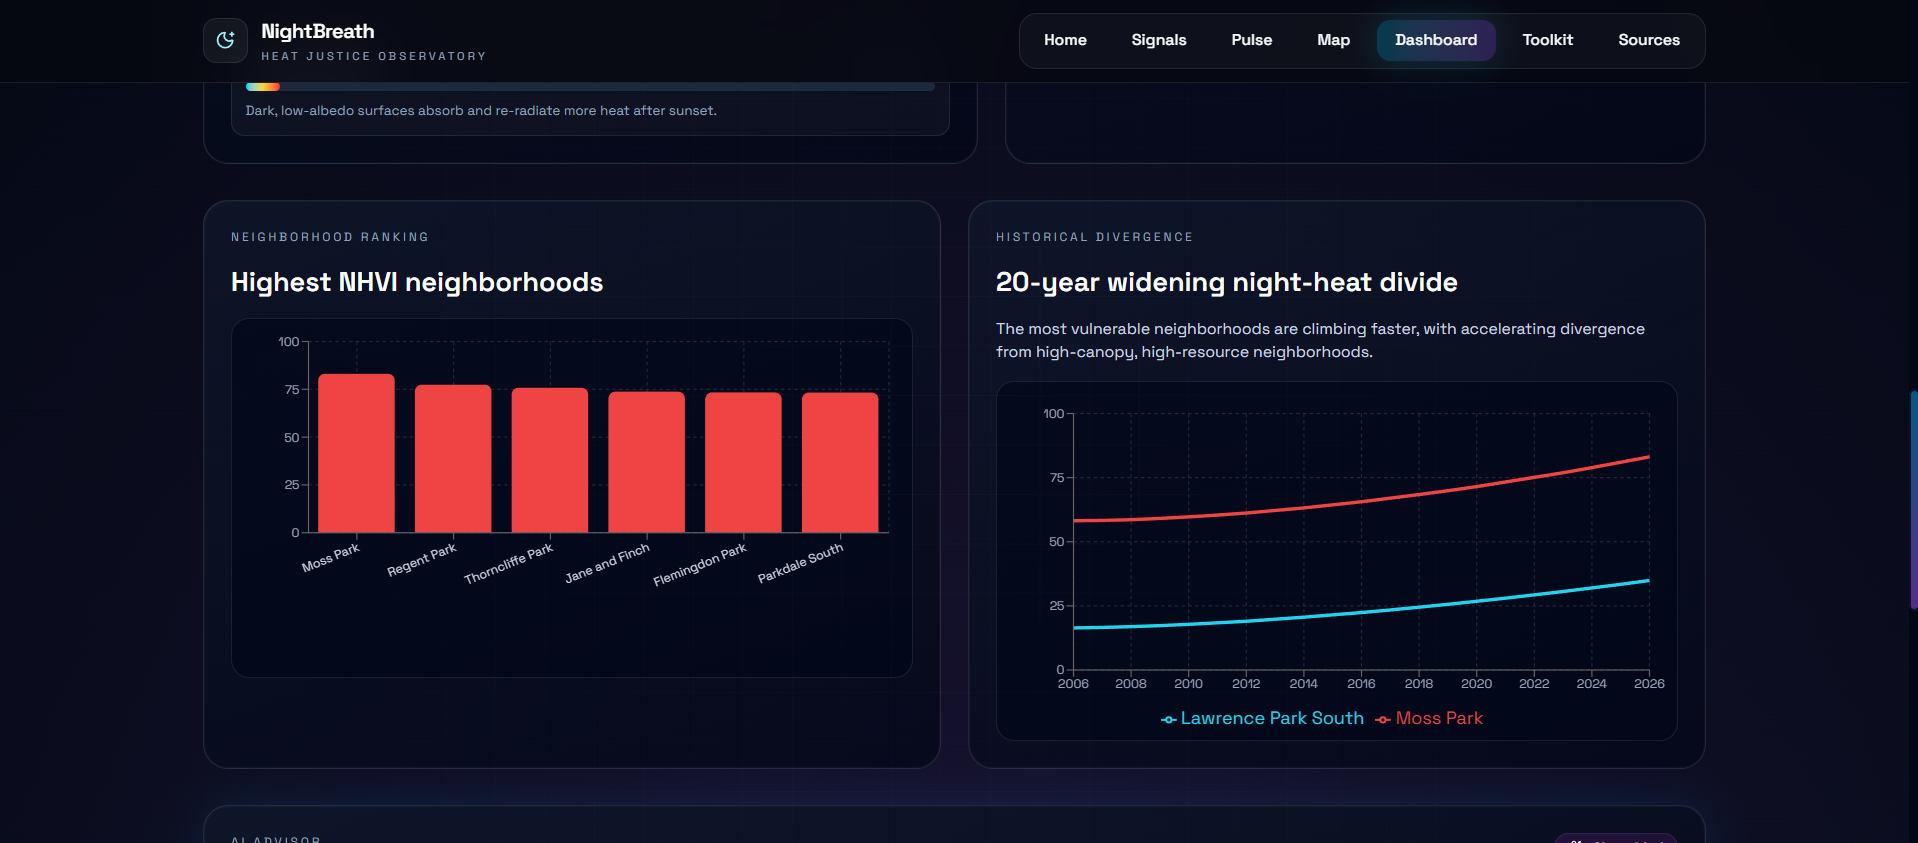
- Side-by-side comparisons of neighborhoods ranked by vulnerability
- Risk tier classification: Low (0-25), Moderate (26-50), High (51-75), Critical (76-100) with visual urgency scaling
- 20-year historical trend showing NHVI scores diverging — vulnerable neighborhoods getting worse faster than privileged ones
- A prominent Equity Gap metric: the spread between the 90th and 10th percentile NHVI scores across the city — a single number that tells policymakers whether adaptation resources are reaching the right places
Every weight, every assumption, every data source is visible. Transparency is not optional when lives are at stake.
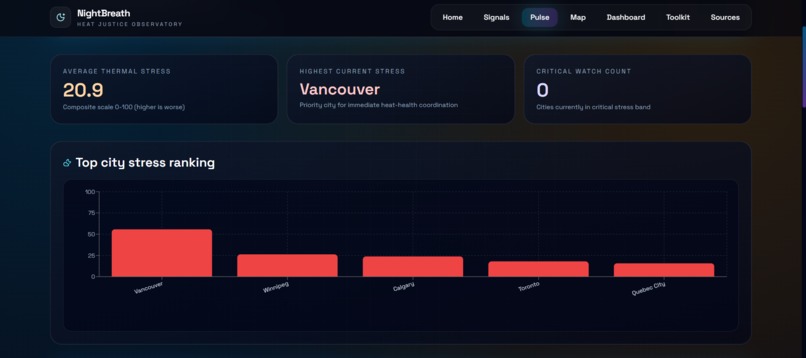
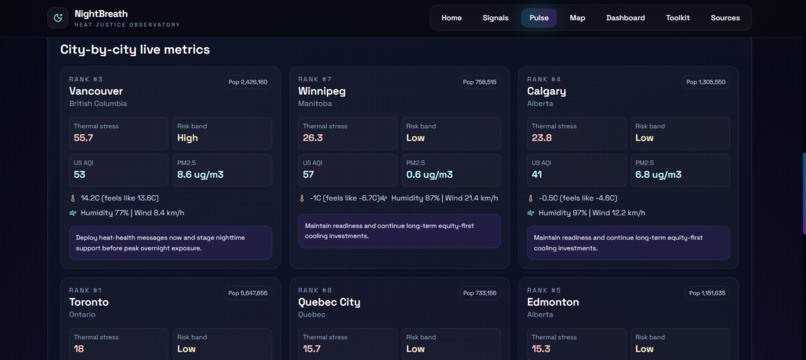
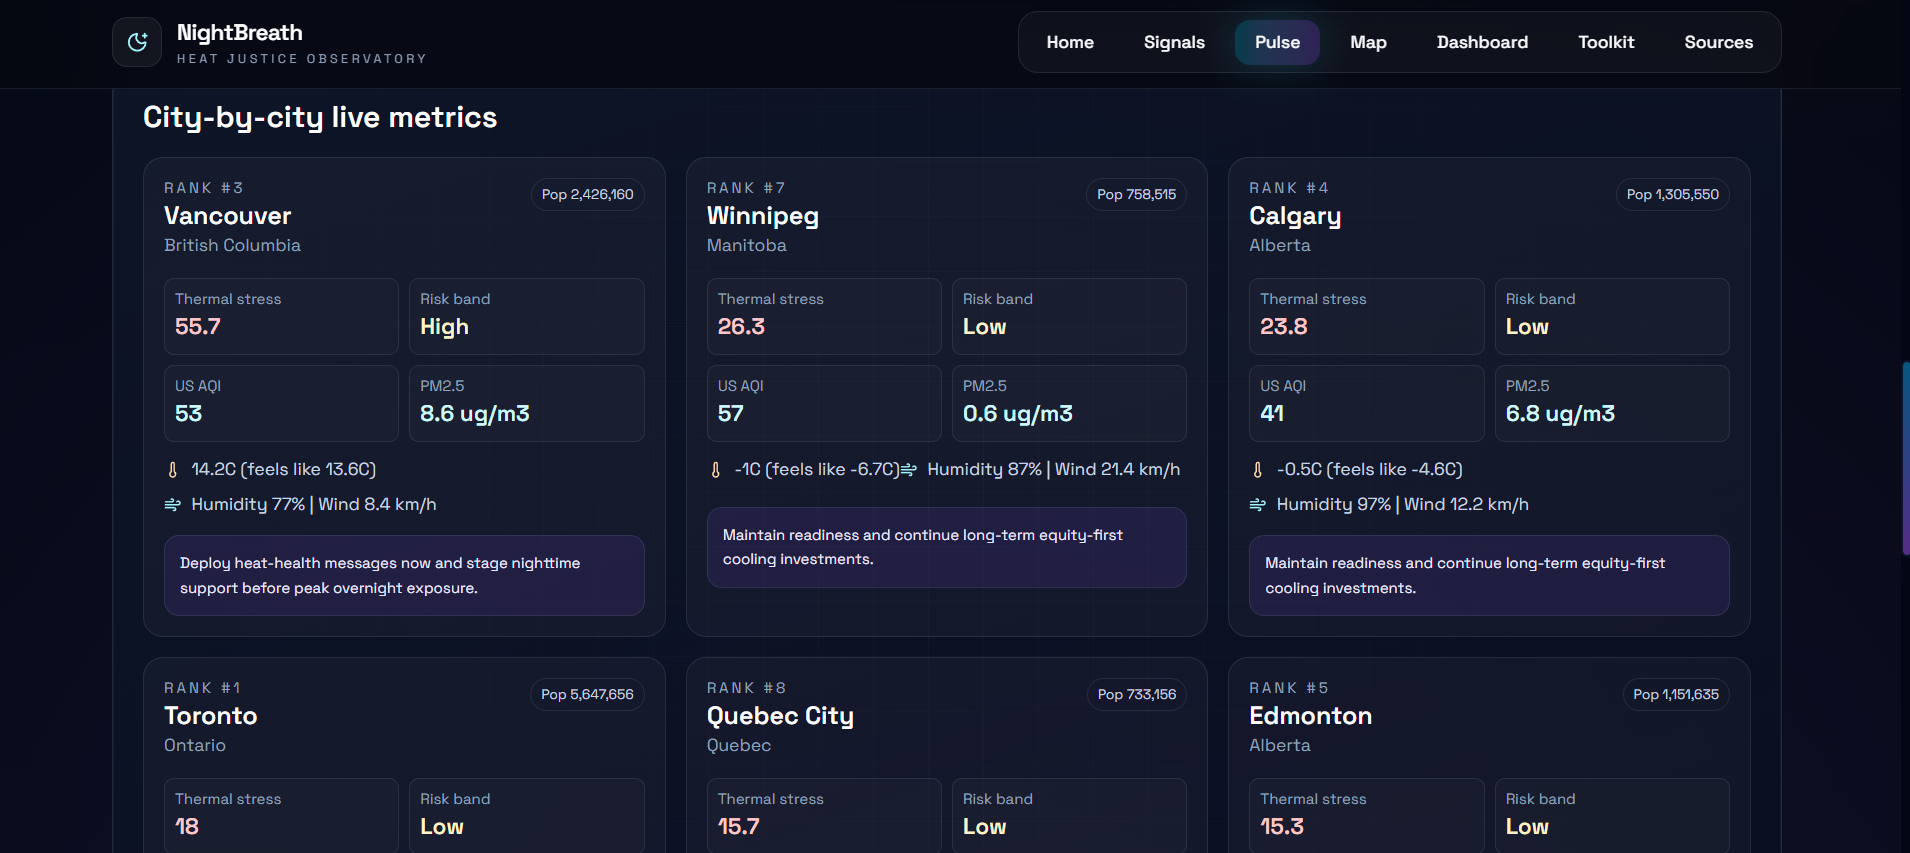
🇨🇦 Canada Pulse (/pulse)
A real-time thermal stress tracker for major Canadian cities, pulling live data from Environment and Climate Change Canada (ECCC GeoMet) and Open-Meteo. Shows current nighttime conditions, active alerts, and comparative risk across regions. Because this crisis is not limited to Toronto.
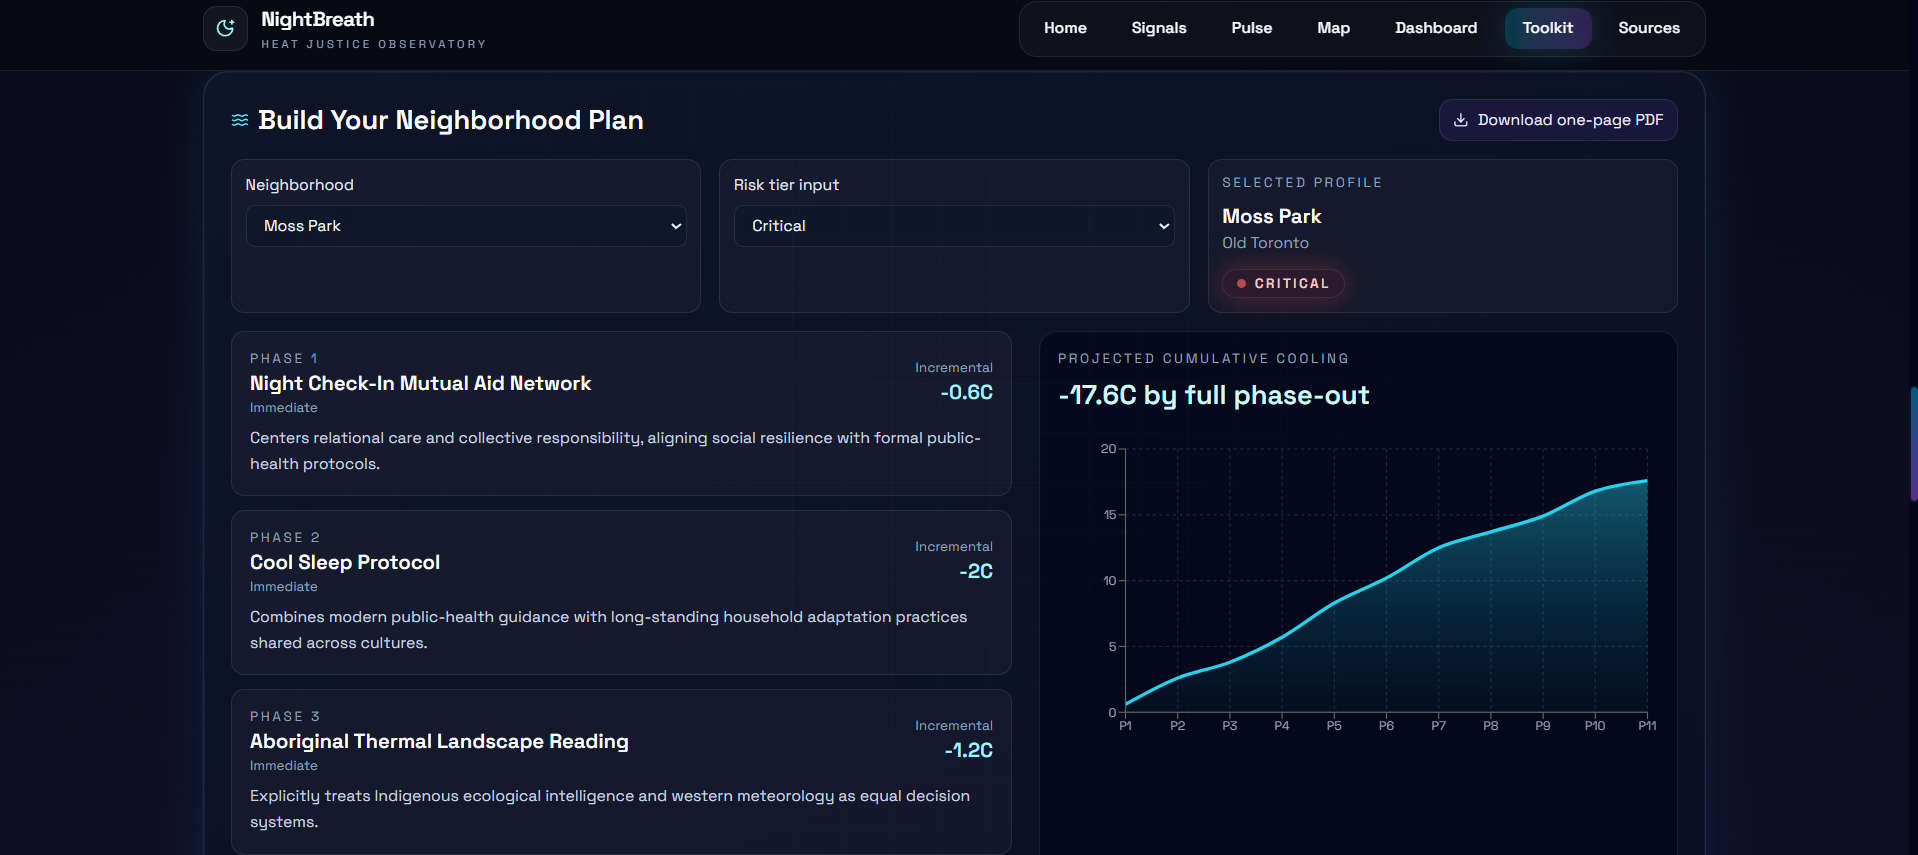
Cooling Justice Toolkit (/toolkit)
This is the module we are most proud of. Most climate tools stop at visualization. NightBreath converts every insight into a phased, costed, equity-weighted action plan.
Interventions are organized by timeline:
| When | What | Cooling Impact | Cost |
|---|---|---|---|
| Tonight | Mutual aid check-in networks for isolated elderly and vulnerable residents | Saves lives directly | Near zero |
| This week | Cool sleep guidance — room selection, hydration protocols, wet sheet techniques | 2-4°C perceived cooling | Near zero |
| This month | High-albedo cool roof coatings on highest-vulnerability buildings | 2-5°C indoor reduction | \$1-5/m² |
| This season | Strategic tree planting — species selected for high evening evapotranspiration | 3-8°C localized cooling at maturity | Moderate |
| This year | Radiative cooling panels emitting heat at the 8-13μm atmospheric window | 5-10°C below ambient | Emerging |
| 1-3 years | Nighttime ventilation corridor redesign in urban planning | Systemic cooling | Policy investment |
| Long-term | Phase-change materials in building envelopes | Stabilized indoor temps | Infrastructure scale |
Each intervention card shows: cooling impact, cost, equity priority rating, implementation complexity, scientific basis, and systems trade-off warnings.
The Systems Trade-Off Watchlist is critical: will adding green infrastructure drive up property values and displace the people it was meant to protect? Will cool roof programs reach renters or only homeowners? NightBreath flags these risks before any decision is made.
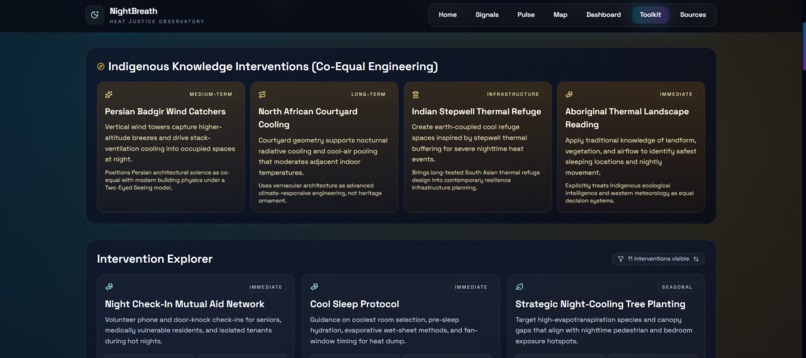
Indigenous Knowledge — Prominently Integrated, Not Decorative:
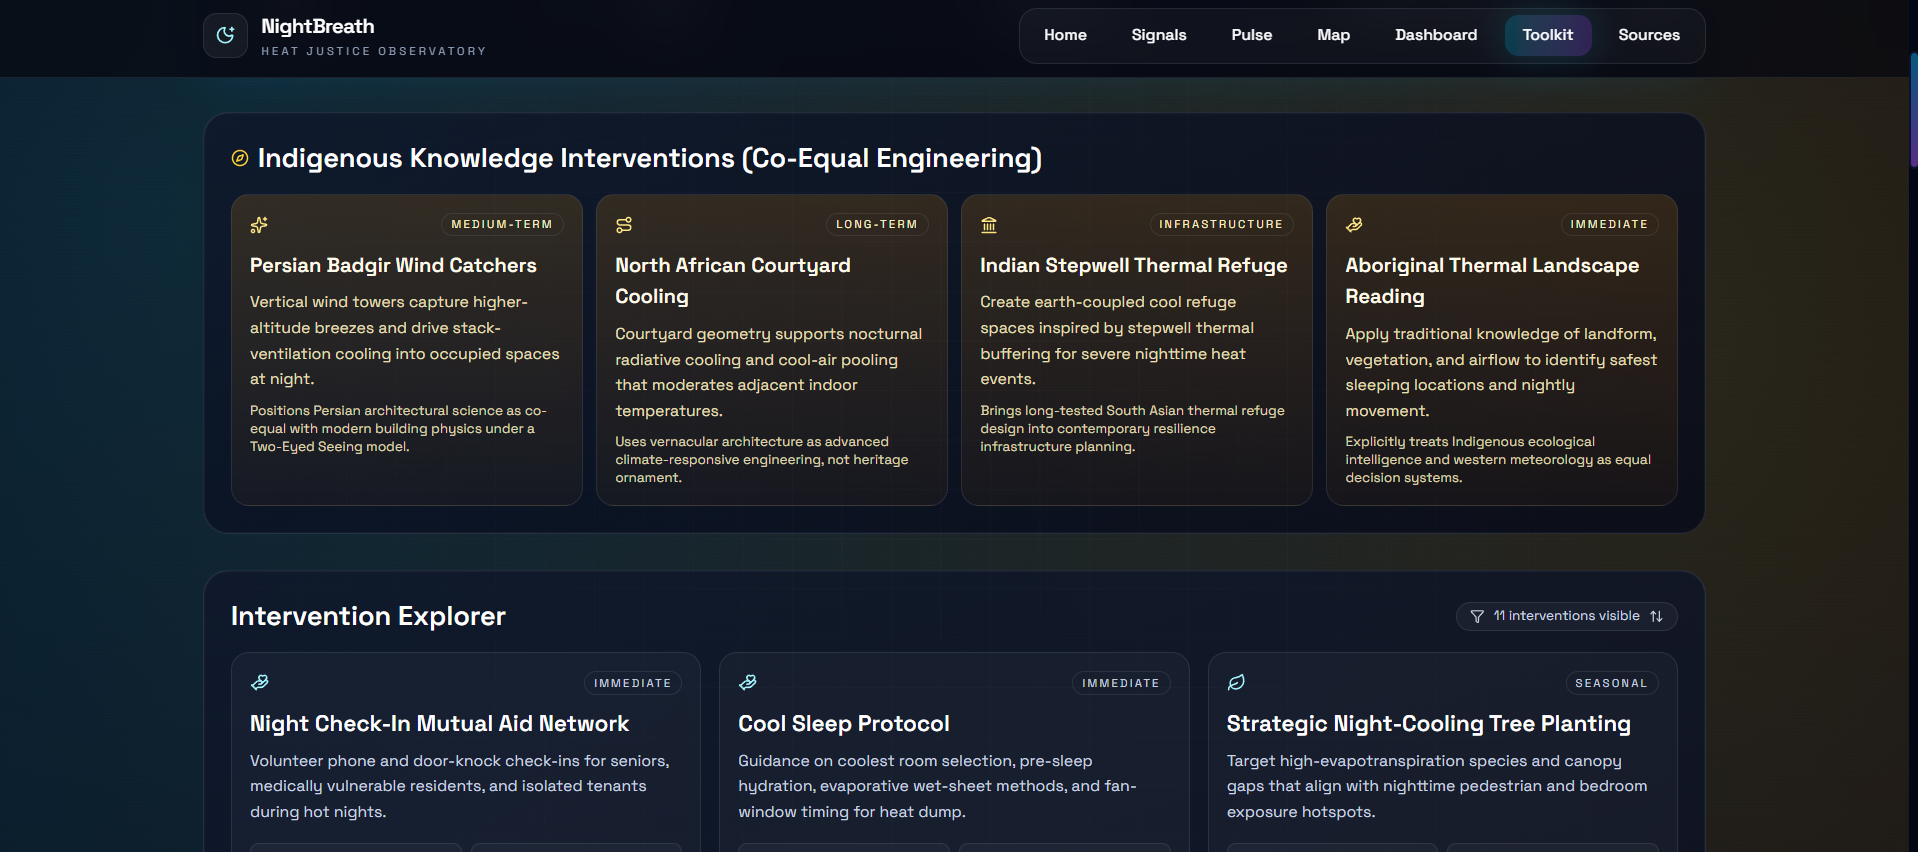
Our toolkit highlights centuries-proven indigenous and traditional cooling engineering as co-equal knowledge systems alongside modern climate science, following a Two-Eyed Seeing approach:
- Persian bâdgir (wind catchers) — passive stack-ventilation systems used for 3,000+ years, scientifically validated as effective nighttime cooling architecture that requires zero energy input
- North African courtyard houses — enclosed courtyards that create cool air pools through nocturnal radiative cooling of interior surfaces, a thermodynamic principle that modern architects are only now rediscovering
- Indian stepwells — underground thermal refuges providing stable cool temperatures year-round through earth-coupling, a model for modern community cooling centers
- Aboriginal Australian thermal landscape knowledge — traditional practices of reading landform, vegetation, and airflow to identify the coolest sleeping locations, representing thousands of years of empirical climate adaptation science
These are not historical curiosities. They are engineering solutions validated across millennia that modern cities have systematically forgotten. NightBreath brings them back into the decision-making conversation — not as decoration, but as foundational design knowledge.
Build Your Neighborhood Plan: Users select their risk tier and the toolkit generates a phased intervention roadmap showing projected cumulative temperature reduction as actions stack over time, with milestone targets and equity checkpoints.
PDF Brief Generator
One-click export of a concise implementation brief summarizing the vulnerability assessment, recommended interventions, assumptions, confidence levels, and 90-day action milestones. Designed to be handed directly to a city councilor, a public health director, or a community board — because the gap between insight and action is often just a readable one-page document.
How We Built It
| Layer | Stack | Purpose |
|---|---|---|
| Framework | Next.js (App Router) + TypeScript | Modular routing, server-side data fetching, deployment-ready architecture |
| Interface | React + Tailwind CSS | Responsive, dark-themed, atmospheric design system |
| Visualization | Recharts | Transparent, explainable trend and decomposition charts |
| Mapping | React Leaflet + NASA GIBS tiles + custom overlays | Place-based vulnerability targeting with real satellite imagery |
| Data Validation | Zod | Schema-safe handling of external API payloads |
| Data Fetching | SWR + API route caching | Resilient refresh behavior during live monitoring |
| Export | jsPDF | Rapid one-page brief generation for stakeholders |
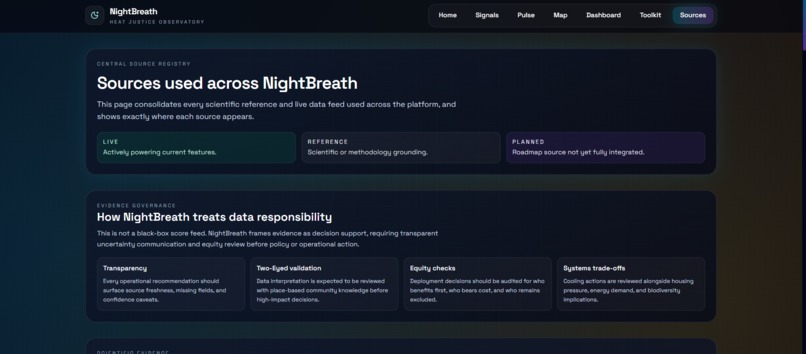
Live Data Sources (All Free, No API Keys Required)
| Source | What We Pull | Why It Matters |
|---|---|---|
| NASA POWER API | 24 years of daily T2M_MIN, T2M_MAX, humidity, wind, radiation for Toronto grid points | Core evidence for nighttime warming trends |
| NASA GIBS | MODIS nighttime land surface temperature tiles + NDVI vegetation tiles | Real satellite thermal imagery on our map |
| NASA EONET | Live global natural event tracking (wildfires, storms, heat events) | Real-time crisis context layer |
| Open-Meteo Historical API | Hourly/daily temperature archives back to 2000 | High-resolution nighttime pattern analysis |
| ECCC GeoMet (Environment Canada) | Canadian weather alerts + real-time conditions | Live national thermal monitoring |
| Toronto Open Data | Neighborhood boundaries, demographics, canopy coverage | Local equity and vulnerability indicators |
The Four Lenses — Built Into Architecture, Not Added as Afterthoughts
Equity & Justice
Equity is not a section of NightBreath. It is the architecture.
The NHVI index mathematically weights poverty, demographics, building quality, and cooling access alongside temperature — ensuring that the neighborhoods scored as most vulnerable are the ones that historical segregation made hottest. The Equity Gap metric tracks whether the spread between the most and least vulnerable neighborhoods is narrowing or widening over time. Intervention recommendations prioritize highest-burden zones first. The Systems Trade-Off Watchlist guards against adaptation strategies that could cause displacement or gentrification in the communities they claim to serve.
Who gets to sleep cool is a justice question. NightBreath treats it as one.
Two-Eyed Seeing
Indigenous cooling knowledge is woven throughout the toolkit — not as historical references, but as co-equal engineering knowledge validated over centuries. Persian wind catchers, North African courtyard thermodynamics, Indian earth-coupled cooling, and Aboriginal Australian thermal landscape reading are presented alongside modern radiative cooling science and urban forestry research. Both knowledge systems inform the intervention recommendations. Neither is subordinate to the other.
We also designed the platform to complement institutional climate science with community-level observation — recognizing that the people who live in vulnerable neighborhoods hold knowledge about their environment that satellite data alone cannot capture.
Practical
Every module produces actionable output. The toolkit generates phased 90-day implementation roadmaps with specific milestones. The PDF brief exporter creates documents designed to be handed to decision-makers. Interventions span from zero-cost mutual aid deployable tonight to infrastructure investments over years. A city pilot could begin with \$200 worth of temperature loggers and a neighborhood volunteer network.
We designed NightBreath to close the gap between knowing and doing.
Systems Thinking
Nighttime cooling is not an isolated problem. It connects to public health, energy poverty, urban forestry, food security, housing justice, biodiversity, infrastructure resilience, and municipal budgeting. NightBreath's Systems Trade-Off Watchlist ensures that every recommended intervention is examined for second-order effects across all four hackathon themes. Solar panels reduce energy costs but rely on materials with supply chain impacts. Tree planting improves canopy but requires decades. Cool roofs help top-floor residents but may not reach renters. We surface these tensions rather than hide them.
Challenges We Ran Into
Nighttime data scarcity: Most publicly available climate tools prioritize daytime metrics. Building a night-first platform required creative use of NASA POWER's T2M_MIN parameter, MODIS nighttime land surface temperature imagery, and Open-Meteo hourly archives to reconstruct the nighttime picture that standard dashboards ignore.
Equity without reductionism: Compressing complex social vulnerability into a single index risks oversimplification. We addressed this through transparent weight decomposition — every component of the NHVI is visible, adjustable, and explainable. Users can see exactly which factors drive a neighborhood's score and interrogate the assumptions.
From visualization to action: The hardest design challenge was ensuring that NightBreath doesn't end at "here's a scary map." Every visualization connects to a recommended action. Every action connects to a timeline. Every timeline connects to a stakeholder brief. The platform is designed so that the distance between seeing a problem and beginning to solve it is as short as possible.
Respecting indigenous knowledge authentically: We committed to presenting traditional cooling practices as sophisticated engineering, not cultural decoration. This meant researching the actual thermodynamic principles behind bâdgir ventilation, courtyard radiative cooling, and earth-coupled thermal refuge — and presenting them with the same scientific respect given to modern materials science.
Accomplishments We're Proud Of
We built a night-first climate tool. In a world of daytime heat dashboards, NightBreath focuses on the hours when people actually die.
Real data, not just mockups. 24 years of NASA and Open-Meteo climate records. Live satellite imagery. Active natural event feeds. Real Toronto neighborhood boundaries and demographics.
Equity is measurable, not performative. The NHVI, the Equity Gap metric, and the prioritization logic ensure that justice is quantifiable and trackable — not just aspirational language.
Indigenous knowledge is structural. Two-Eyed Seeing is embedded in the intervention framework, not relegated to a sidebar.
Every insight leads to action. Vulnerability scores generate intervention plans. Plans generate timelines. Timelines generate exportable briefs. The platform closes the gap between analysis and implementation.
It could launch a real pilot tomorrow. The 90-day roadmap, the stakeholder brief, and the neighborhood-level specificity mean this isn't just a prototype — it's a pilot-ready tool.
What We Learned
The nighttime heat crisis is real, urgent, and almost entirely invisible in current climate tools. This gap is not a technical limitation — it is a framing failure. We need to change how cities think about heat risk.
Equity must be implemented in code, not just in copy. It is easy to write "equity-centered" in a project description. It is harder to build an index that mathematically prioritizes marginalized neighborhoods and a watchlist that flags gentrification risk. The second version is the one that matters.
Indigenous knowledge systems contain engineering brilliance that modern climate adaptation desperately needs. A Persian wind catcher achieves passive nighttime cooling with zero energy input using principles that contemporary HVAC engineers are still trying to replicate. Respect for these systems is not just ethically right — it is scientifically necessary.
Transparency builds trust. When every weight in an index is visible, when every assumption is stated, when every limitation is acknowledged — the tool becomes something a community can own rather than something imposed on them.
The distance between a dashboard and a decision is often one readable page. The PDF brief generator may be the simplest feature we built and potentially the most impactful.
What's Next
90-Day Municipal Pilot Plan
| Phase | Timeline | Objective |
|---|---|---|
| Baseline & Partnerships | Days 1-30 | Deploy temperature loggers in 3 pilot neighborhoods. Establish partnerships with community organizations, indigenous knowledge keepers, and municipal public health teams. Validate NHVI scores against ground-truth conditions. |
| Rapid Response Deployment | Days 31-60 | Launch mutual aid check-in networks and cool sleep guidance in highest-risk zones. Begin cool roof coating program on most vulnerable buildings. Initiate community co-design sessions for neighborhood-specific interventions. |
| Evaluation & Scale Decision | Days 61-90 | Compare intervention neighborhoods against control areas. Publish findings openly. Present recommendations to city council. Define 12-month expansion roadmap. |
Longer-Term Vision
- Multi-city expansion with modular data adapters for any city with open data infrastructure
- Community co-design integration — residents of vulnerable neighborhoods participate in defining intervention priorities, not just receiving them
- Public health linkage — connecting nighttime heat exposure data with emergency department admissions and mortality records
- Policy template library — model bylaws for nighttime thermal impact assessment, Right to Cool Sleep frameworks, and energy poverty interventions that any municipality can adapt
- Open-source release — because this tool should belong to every city that needs it, not just the ones that can afford it
Built With
Next.js · TypeScript · React · Tailwind CSS · Recharts · React Leaflet · SWR · Zod · jsPDF · NASA POWER API · NASA GIBS · NASA EONET · Open-Meteo · ECCC GeoMet · Toronto Open Data
References
- Zhao, L. et al. (2014). Strong contributions of local background climate to urban heat islands. Nature, 511, 216-219.
- Murage, P. et al. (2017). What individual and neighbourhood-level factors increase the risk of heat-related mortality? Epidemiology, 28(1), 32-37.
- Heaviside, C. et al. (2017). The Urban Heat Island: Implications for health in a changing environment. Current Environmental Health Reports, 4(3), 296-305.
- Mora, C. et al. (2017). Global risk of deadly heat. Nature Climate Change, 7, 501-506.
- He, B.J. et al. (2022). Nighttime warming and its impacts. Science of The Total Environment, 806, 150396.
AI Disclosure & Responsible Use Statement
How AI Was Used In This Project
We believe in full transparency about AI usage in our development process. AI-assisted tools were used as accelerators for specific workstreams, while all domain decisions, scientific framing, equity analysis, and final implementation remained human-led.
| Area | How AI Assisted | Human Oversight |
|---|---|---|
| Code Development | AI coding assistants helped scaffold components, debug implementation patterns, and accelerate frontend development | Every module was reviewed, tested, and integrated by team members. All architectural and design decisions were made by the team. |
| Research Synthesis | AI tools helped identify and summarize relevant climate science literature and data source documentation | All scientific claims were verified against original peer-reviewed sources. Citations reference original papers, not AI summaries. |
| Writing & Communication | AI assisted with drafting and refining project descriptions and presentation materials for clarity | Team reviewed all text for factual accuracy, appropriate tone, and alignment with project values. No AI-generated text was used without human editing. |
| Data Analysis | AI tools supported exploration of data structures and API response formats | All data interpretation, vulnerability modeling logic, and equity analysis were designed and validated by the team. |
What AI Did NOT Do
- AI did not design the NHVI methodology or choose its weights
- AI did not make any equity or justice framing decisions
- AI did not determine intervention recommendations or trade-off assessments
- AI did not select or validate indigenous knowledge references
- AI did not generate our scientific conclusions or policy recommendations
- AI was not granted autonomous decision-making authority at any point
Responsible Use Commitment
- NightBreath is decision-support software, not autonomous policy software. It is designed to inform human decision-makers, not replace them.
- All outputs carry stated assumptions and confidence contexts. We do not present modeled estimates as certainties.
- Any real-world deployment requires local validation, community co-governance, and public health oversight. A prototype cannot substitute for institutional process and community consent.
- We are committed to open development. Our methodology, weights, data sources, and limitations are fully transparent and documented within the platform itself.
General Disclaimer
AI-generated content can contain errors, omissions, or overgeneralizations. All external-facing outputs from NightBreath — including vulnerability scores, intervention recommendations, and implementation briefs , should be validated by qualified professionals with local context before being used in operational or policy decisions. Climate adaptation decisions carry life-safety implications and require domain expertise, community input, and institutional governance that no software tool can replace.
NightBreath was built with urgency, care, and the belief that climate adaptation must center the people most at risk ; not as an afterthought, but as the starting point.
The heat doesn't leave when the sun does. Neither do we.
Built With
- api-first
- architecture
- date-fns
- eccc-geomet-api
- framer-motion
- javascript
- jspdf
- leaflet.js
- lucide-react
- nasa-cmr-api
- next.js-16
- node.js
- open-meteo-api
- openai-sdk
- react-19
- react-leaflet
- recharts
- statistics-canada-wds-api
- swr
- tailwind-css-4
- toronto-open-data-ckan-api
- typescript
- vercel
- zod


Log in or sign up for Devpost to join the conversation.