-
-

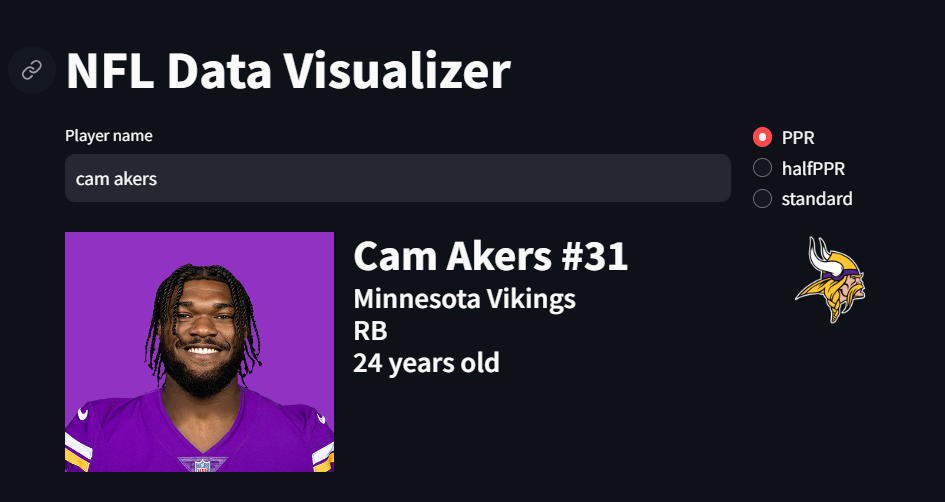
Interface demo of Cam Akers player search.
Inspiration
I have been playing fantasy football for over 10 years, and I have used a variety of platforms to acquire and analyze player data. I always felt that the interface and data provided by these sites was lacking. Despite their relevance to fantasy football, many data points, such as quarterback pass attempts and pass completions, often are difficult to find on these sites. Furthermore, there is zero attempt to graphically display data on most of these platforms. Finally, fantasy football record keeping is limited, and it is difficult to pinpoint causation and trends without perusing through archived articles for hours on end. The failures of popular analytics sites to provide all encompassing data points and player metrics led to the birth of the NFL Data Visualizer. I wanted to create a platform for serious fantasy football players to quickly make informed decisions with real-time data presented in a readily digestible format.
What it does
The NFL Data Visualizer interacts with the NFL Live In-Game Real Time Statistics NFL API built by tank01 on Rapid API. It receives user input in the form of a player name, converts the input into a usable format, and then calls multiple API endpoints to access current season data, such as fantasy points per game, touchdowns per game, and more. The program is able to showcase this data in a table, line graph, and a scatterplot at the user’s direction. The user may also compare fantasy point per game data between two players directly on a dual input line graph. Finally, articles relevant to the original player are showcased at correct data points on the line graph. These widgets contain embedded hyperlinks leading to the article in question.
How we built it
This program was built with the Streamlit platform. Rapid API calls produce JSON data which is then stored in a variety of data structures, primarily lists and dictionaries. These data structures are then accessed at various points throughout the function calls.
Challenges we ran into
One major challenge of this project was working with JSON data formatting. I have no experience with JSON, and while it was simpler than I expected, much of the early project was learning to get acquainted with this data format. A second challenge was identifying efficient methods of data storage in a way that provides optimal time complexity and limits API calls. The Rapid API I was using charged $0.01 per API call after 1000 calls per day had been reached, and I did exceed this limit as each program run calls the API approximately 7 times. Therefore, modifying the code to limit API calls was of importance. Another obstacle was posed by the vast amount of error handling required when dealing with the player data itself. The API produced strange and unexpected data points frequently, such as duplicate game history and instances where a team allegedly played against themselves. Also, team rosters remain dynamic throughout the NFL season, and understanding how to display pre and post-trade statistics for one player along with producing accurate bye week statistics was a challenging endeavor. Working through each of these problems was a valuable experience, and I was introduced to a wide array of important programming concepts.
Accomplishments that we're proud of
I am most proud of the program’s ability to showcase web articles at exact graphical data points that sync to the article’s publishing date. This is a novel feature in terms of NFL analytics, as many older articles become archived or more difficult to locate. No data analytics platform offers these articles in the same manner as the NFL Data Visualizer. Each player’s line graph features tailored news articles specifically relevant to the individual in question, allowing the user to draw conclusions and make predictions like never before. This was an original idea from the beginning phases of the project, and I am ecstatic to see its realization.
What we learned
I learned the importance of planning the specifics of data storage before writing the program. I found myself repeatedly rewriting code to find more efficient or accessible methods of data storage. On a similar note, I learned how to handle API calls more efficiently through the use of an API handler class. This was a technique I had never used before, and it eventually saved me a substantial amount of time through code reuse. Finally, I learned to work with JSON data formatting, CSS graphics formatting, and expanded upon a limited API knowledge base.
What's next for NFL Data Visualizer
Next up for the NFL Data Visualizer is enhanced error handling, expanded player news acquisition, and addition of features. I would like for the user to be able to compare up to five players at once rather than the current one to one comparison option. I also want the program to compare different metrics rather than just fantasy points per game as is currently the case. I am seeking another API tailored moreso to generating pertinent NFL articles to expand upon those entries already showcased in the interface. Finally, and most importantly, implementation of an Artificial Intelligence model to provide deeper insights and player predictions based on past trends would take the NFL Data Visualizer to the next level of data analyzing prowess.

Log in or sign up for Devpost to join the conversation.