Inspiration
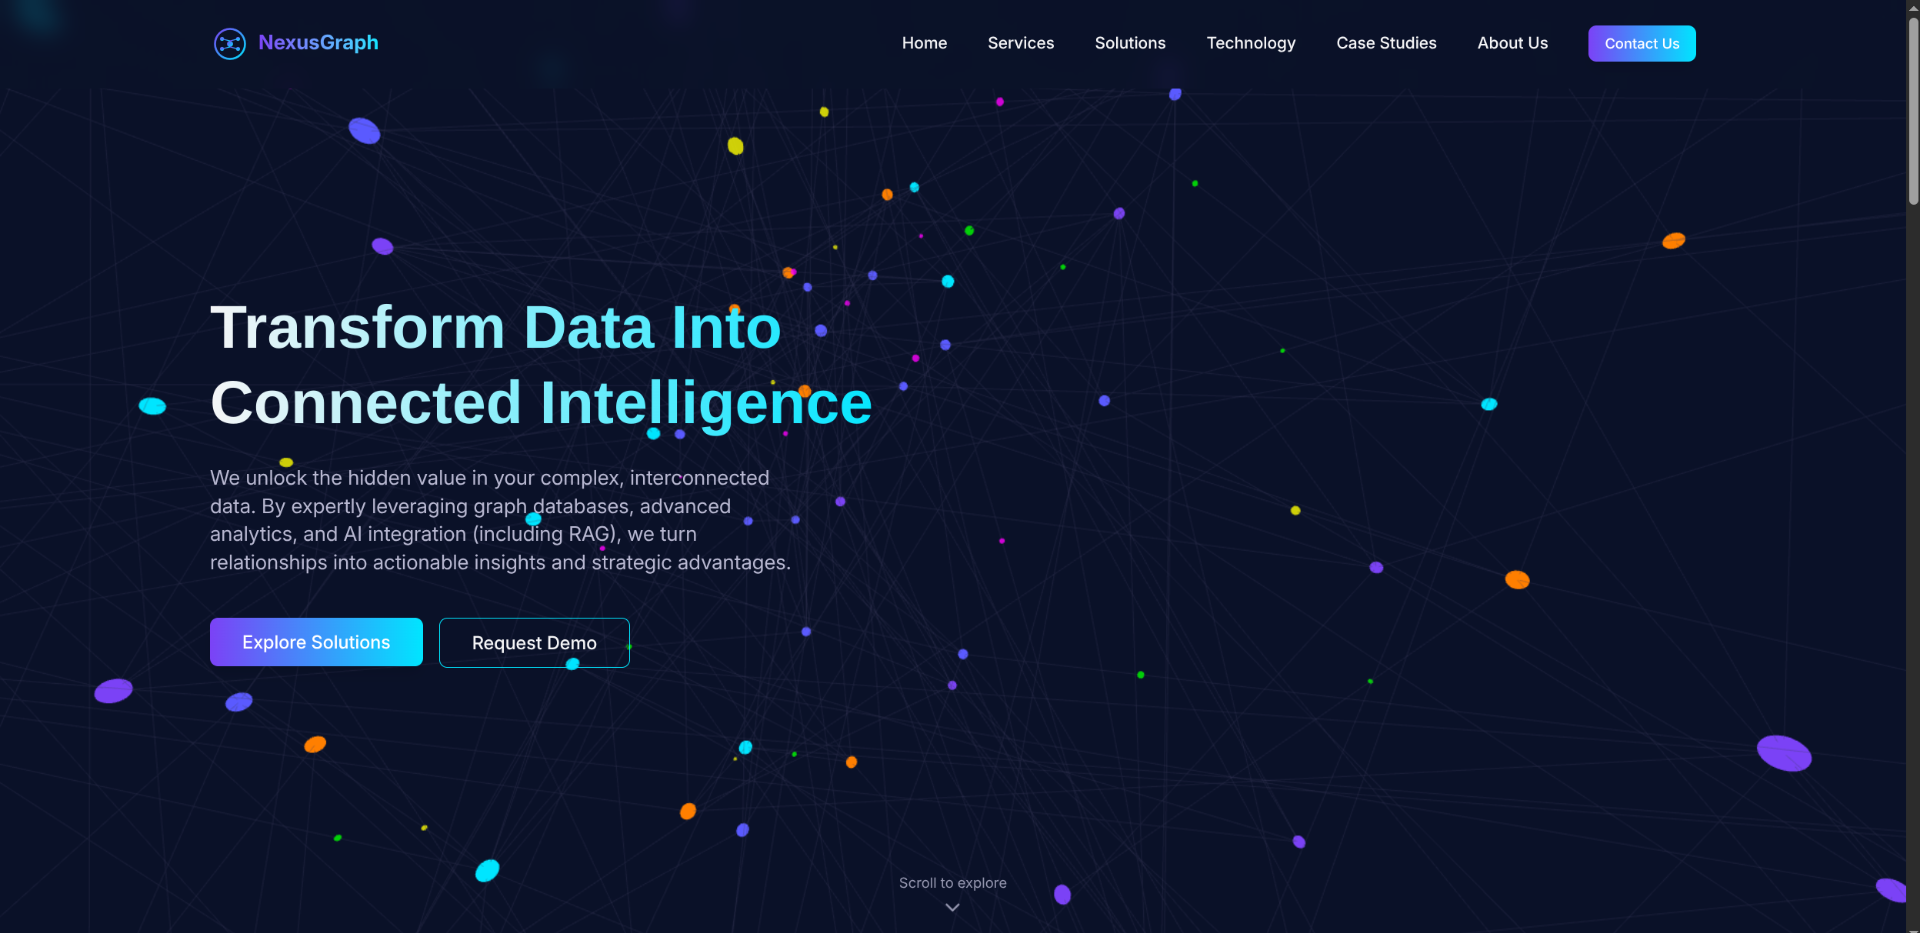
Our inspiration for NexusGraph emerged from witnessing the growing complexity in modern software architectures and the challenges developers face in visualizing and understanding system relationships. We recognized the need for a tool that could bridge the gap between complex system architecture and intuitive visual representation, making it easier for teams to collaborate and make informed decisions.
What it does
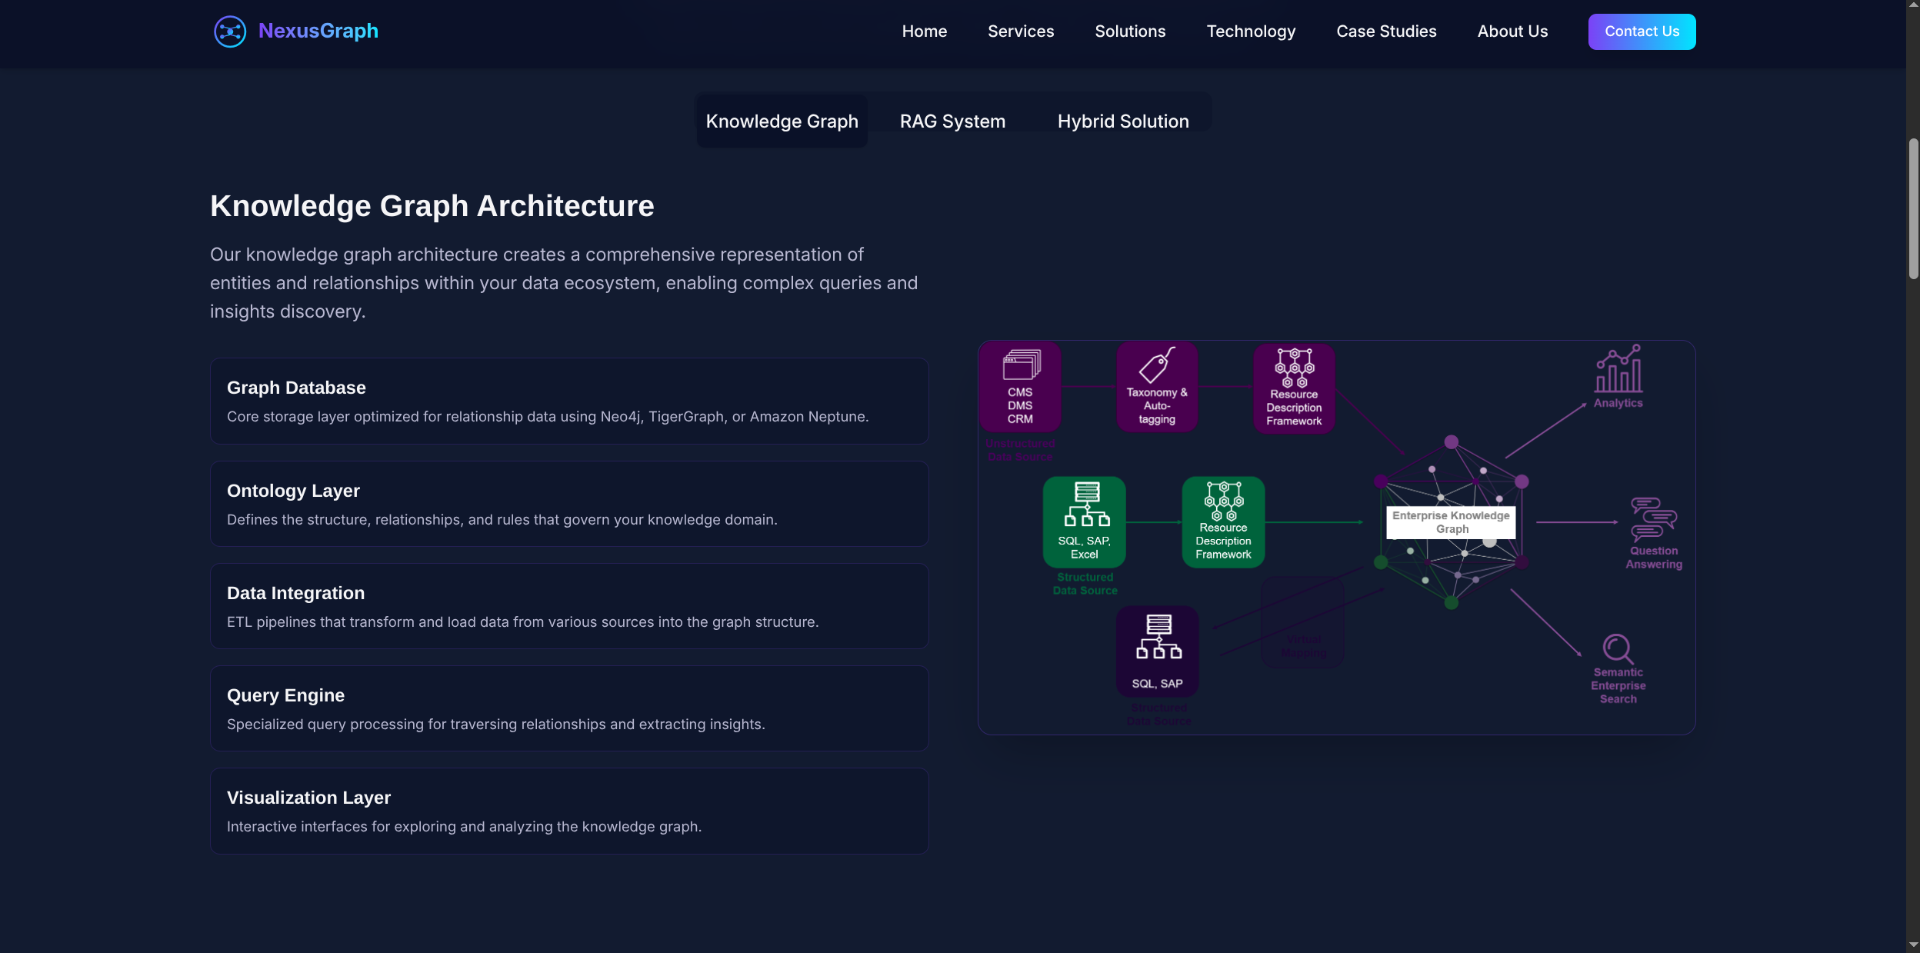
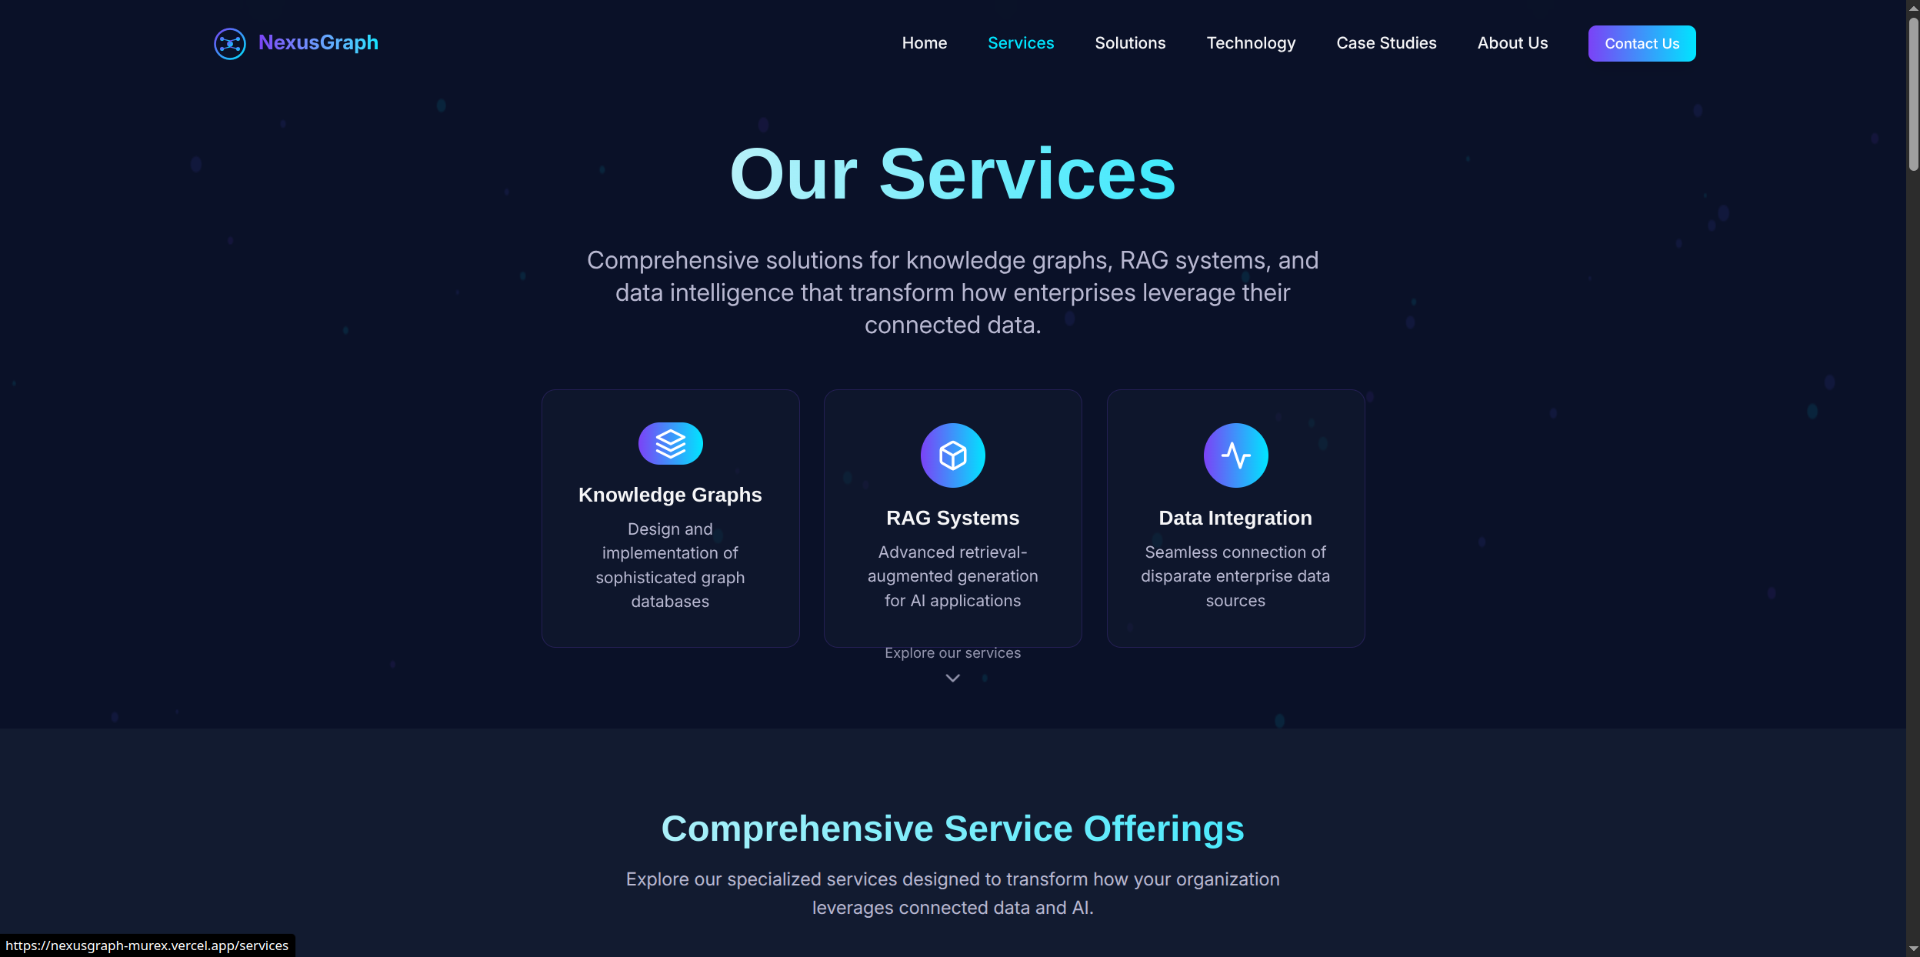
NexusGraph is a sophisticated graph visualization and analysis platform that:
- Transforms complex system architectures into interactive, visual representations
- Provides real-time relationship mapping between different system components
- Offers intelligent insights about system dependencies and potential optimizations
- Enables collaborative exploration of system architecture
- Features intuitive UI controls for deep-diving into specific system aspects
- Generates comprehensive reports and documentation automatically
How we built it
We developed NexusGraph using a modern, robust tech stack:
- React with TypeScript for type-safe, component-based frontend development
- Tailwind CSS for responsive and maintainable styling
- Shadcn/UI components for consistent and accessible UI elements
- React Router for seamless navigation
- Recharts for sophisticated data visualization
- Supabase for secure data management and real-time capabilities
- React Query for efficient data fetching and caching
- Custom graph visualization algorithms for optimal performance
Challenges we ran into
Performance Optimization: Rendering large-scale graphs while maintaining smooth user interaction required significant optimization work.
Real-time Updates: Implementing real-time updates while ensuring data consistency across multiple users was technically challenging.
Graph Layout Algorithm: Developing an algorithm that could automatically arrange nodes in an aesthetically pleasing and logical manner required multiple iterations.
Data Structure Design: Creating efficient data structures to handle complex relationships while maintaining quick query performance was challenging.
Accomplishments that we're proud of
- Successfully implemented a highly performant graph visualization engine
- Created an intuitive user interface that makes complex system visualization accessible
- Developed innovative algorithms for automatic graph layout optimization
- Achieved real-time collaboration capabilities with minimal latency
- Built a scalable architecture that can handle enterprise-level system complexity
- Maintained high code quality and test coverage throughout development
What we learned
Through building NexusGraph, we gained valuable insights into:
- Advanced graph theory and its practical applications
- Performance optimization techniques for large-scale data visualization
- Real-time data synchronization strategies
- Modern frontend architecture patterns
- User experience design for complex technical tools
- The importance of extensible and maintainable code architecture
What's next for NexusGraph
Our roadmap includes several exciting features and improvements:
AI-Powered Insights: Implementing machine learning algorithms to provide intelligent system optimization suggestions
Enhanced Collaboration: Adding more real-time collaboration features like shared annotations and comment threads
Custom Plugin System: Developing a plugin architecture to allow users to extend NexusGraph's functionality
Advanced Analytics: Introducing more sophisticated analytics tools for system performance analysis
Mobile Support: Creating a responsive mobile experience for on-the-go system monitoring
Integration Ecosystem: Building more integrations with popular development tools and platforms
We're committed to continuing development and making NexusGraph an indispensable tool for modern software development teams.
Built With
- react
- reactrouter
- shadcnui
- tailwindcss

Log in or sign up for Devpost to join the conversation.