Inspiration
With the rapid global shift toward electric mobility, urban power grids are experiencing heavy peak-demand bottlenecks, while charging station operators struggle with fragmented, clunky interfaces. We set out to design a human-centered, glance-and-act digital experience that transforms raw telemetry into actionable real-time insights.
What it does
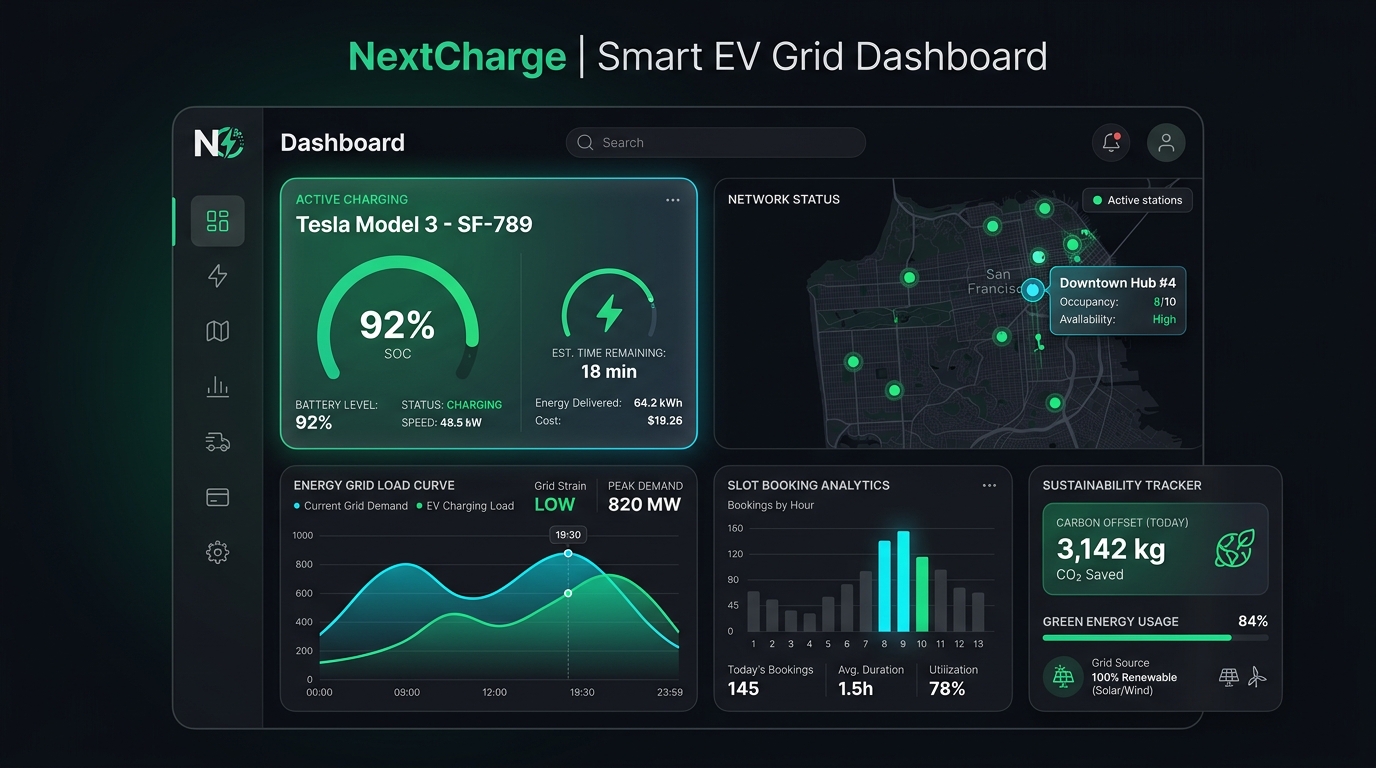
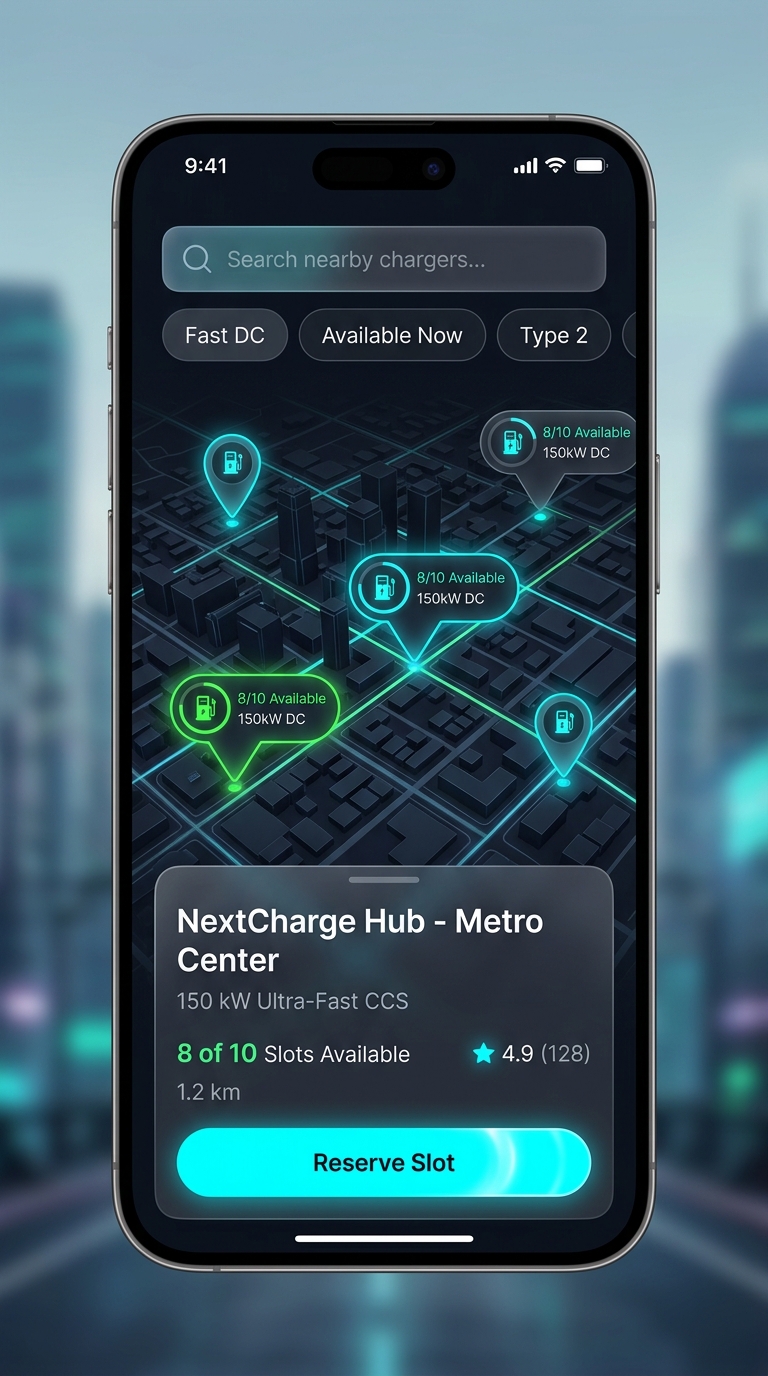
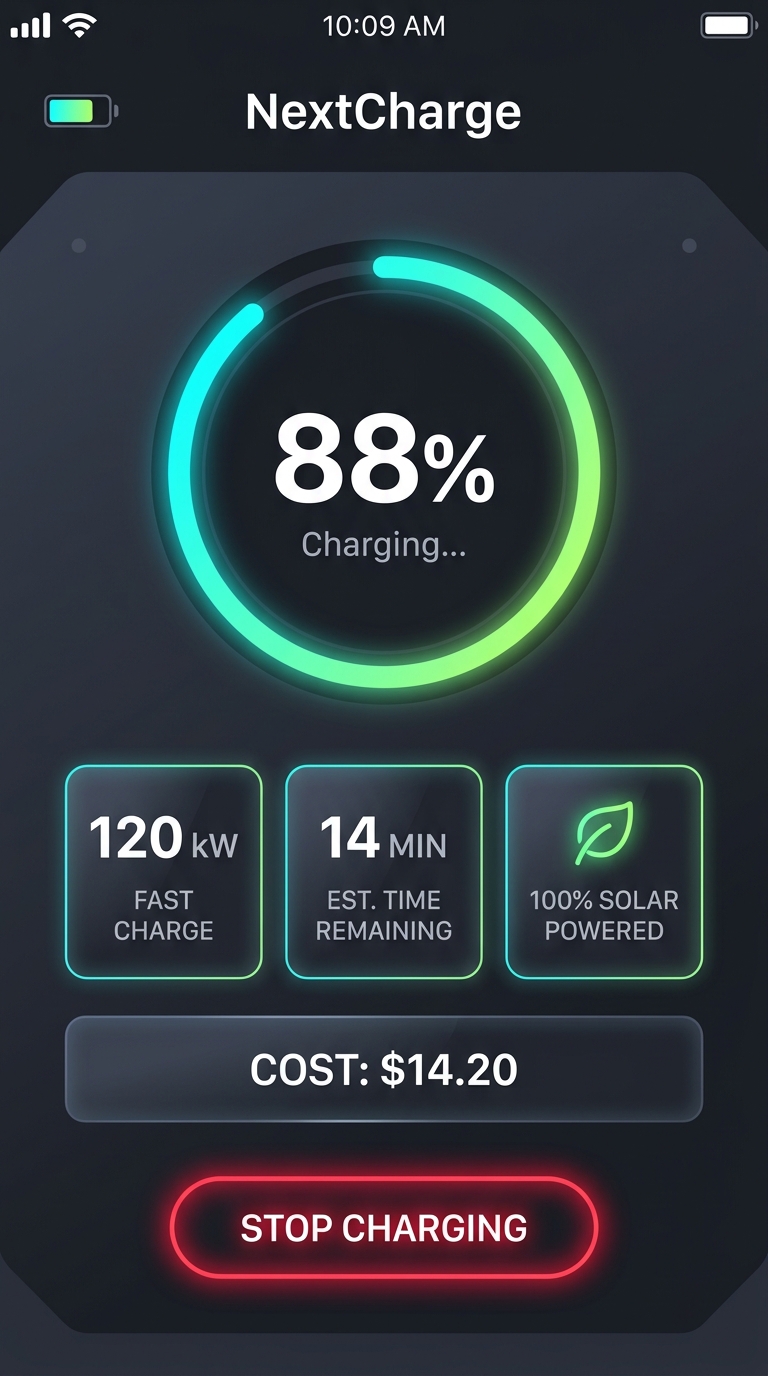
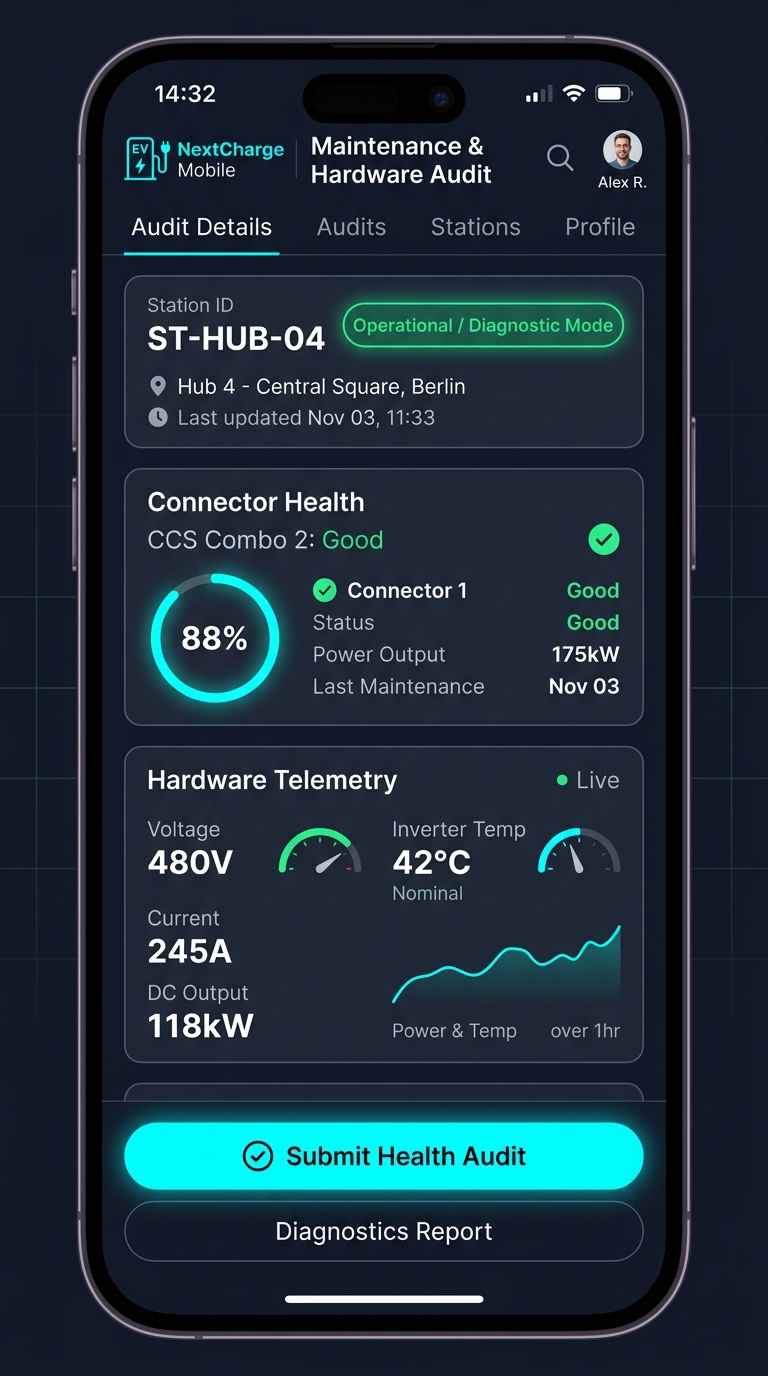
NextCharge is an integrated EV smart grid and infrastructure management interface designed for both EV drivers and station operators:
- Live Vehicle Telemetry: High-contrast radial gauge displaying real-time State of Charge (SOC), charging velocity, energy delivered, and time remaining.
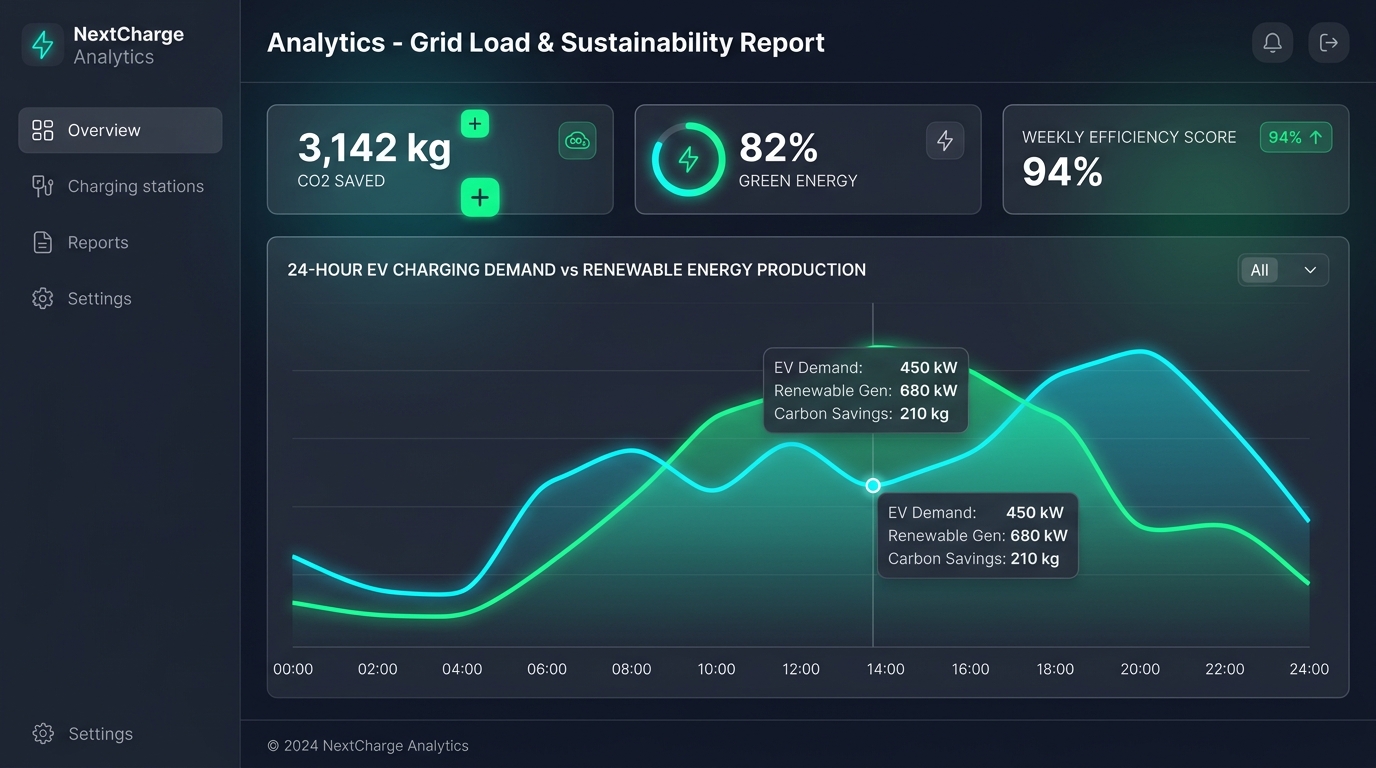
- Dynamic Energy Grid Load Curve: Real-time dual-curve visualization comparing overall grid demand against EV charging load, highlighting grid strain levels to encourage off-peak charging.
- Interactive Station Map: Clean geographic overview displaying station density, active occupancy, and slot availability across regional hubs.
- Sustainability & Carbon Offset Tracker: Instant visual feedback showing kilograms of CO2 saved and renewable energy usage percentage (solar/wind).
- Slot Booking & Predictive Analytics: Hourly booking volume analytics to optimize station throughput.
How we built it
- Design System & UX Architecture: Crafted with modern ergonomic principles, prioritizing a high-contrast dark theme (deep slate with electric cyan and neon mint accents) to eliminate eye fatigue in 24/7 control environments.
- Visual Hierarchy & Fitts's Law: Designed critical metrics (SOC %, Grid Strain, Active Stations) into high-visibility cards for sub-second comprehension.
- Frontend & Prototyping: Structured using React, Tailwind CSS design tokens, Lucide UI iconography, and interactive SVG/Canvas charts.
Challenges we ran into
Balancing complex, multi-dimensional technical data (kilowatt loads, grid strain, geographic availability, and carbon metrics) into a unified viewport without overwhelming the user was the biggest hurdle. We solved this through progressive disclosure and modular cards with distinct visual weights.
What we learned
We learned the critical importance of situational UI design—how colors, chart curves, and clean micro-layouts drastically influence user decision-making when dealing with high-stress systems like energy grids.
What's next for NextCharge
- AI-driven predictive slot reservations tailored to daily commute habits.
- Web3 green energy micro-rewards for charging during high-solar generation hours.
Built With
- design-system
- figma
- next.js
- react
- tailwind-css
- typescript
- ui/ux-design
