-
-

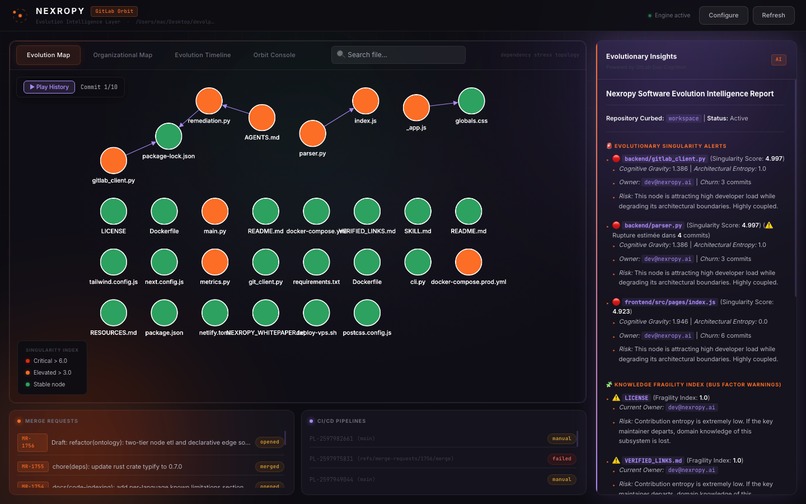
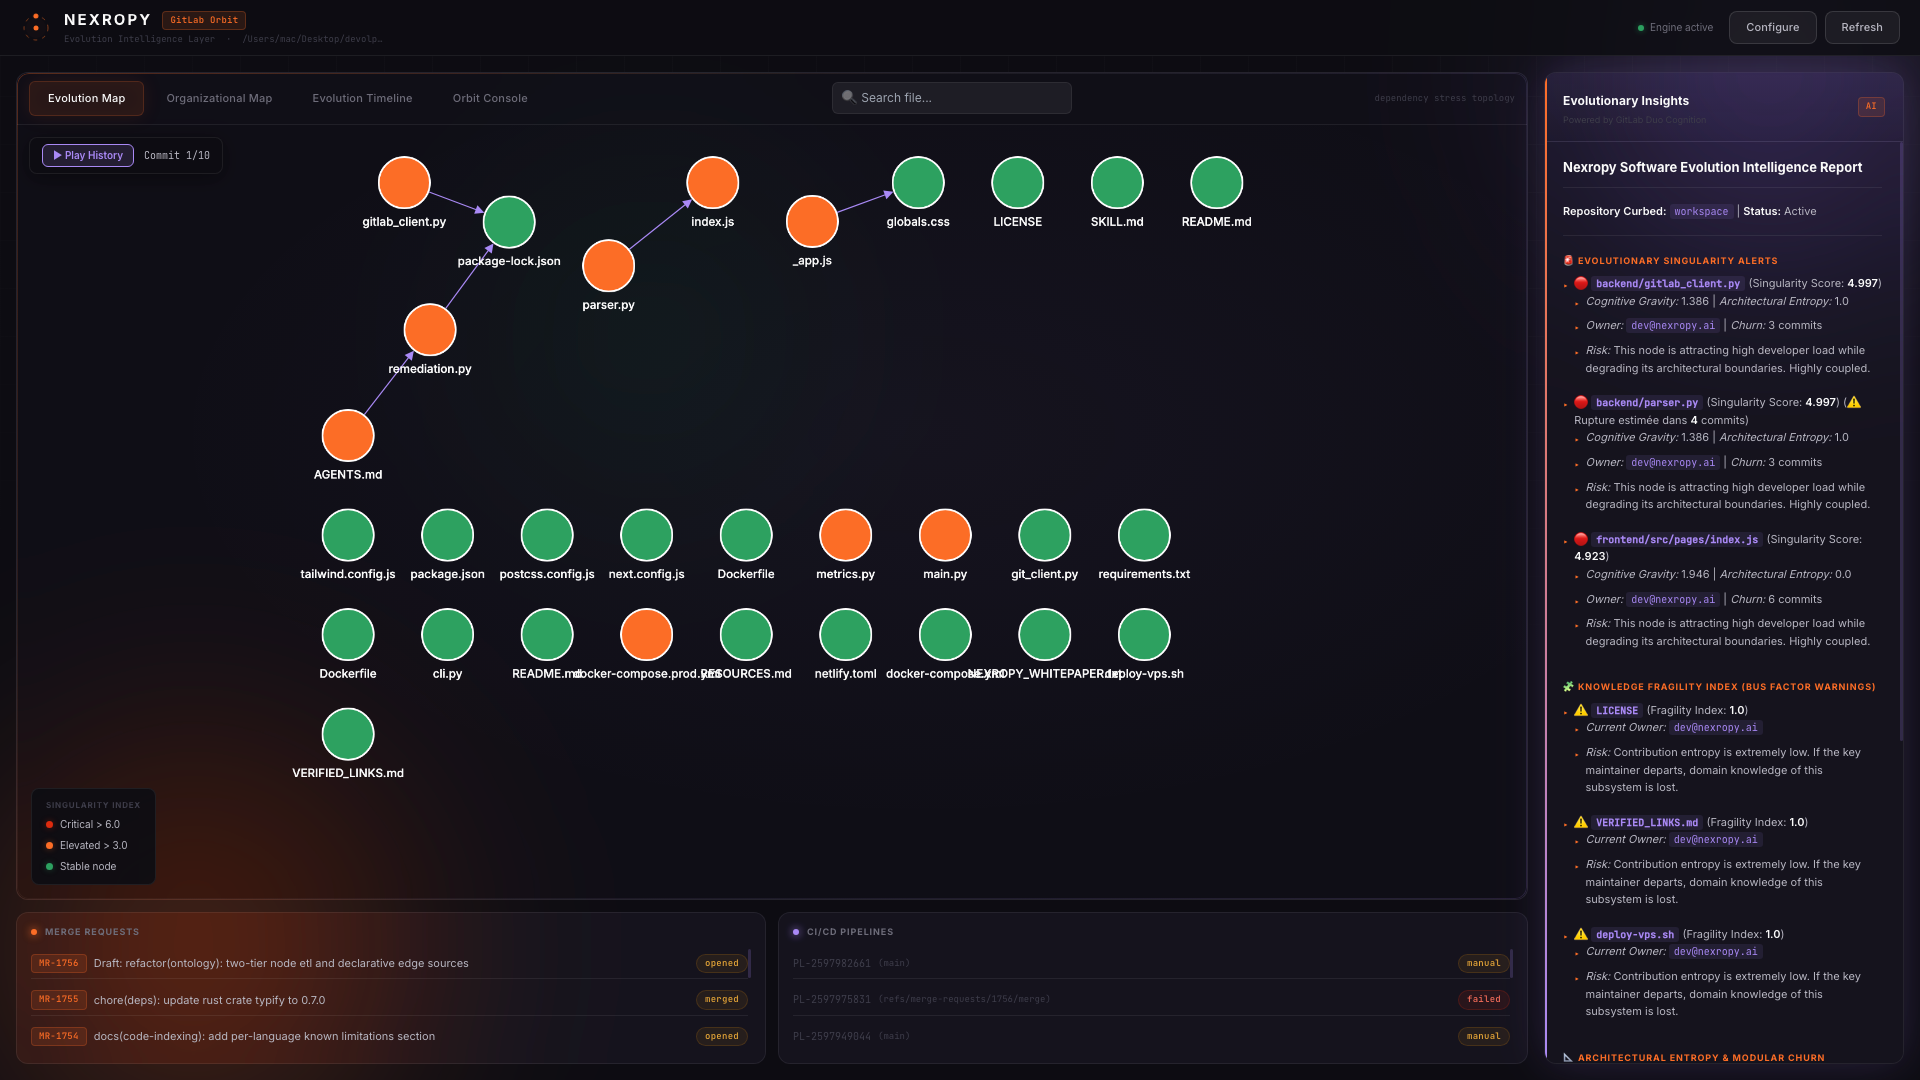
Interactive dependency stress map of Nexropy using GitLab Orbit data to highlight cognitive gravity and bottleneck nodes in real-time.
-
Premium interface mapping GitLab Orbit metrics and structural codebase dependencies queried via the GitLab Duo Agent Platform.
-
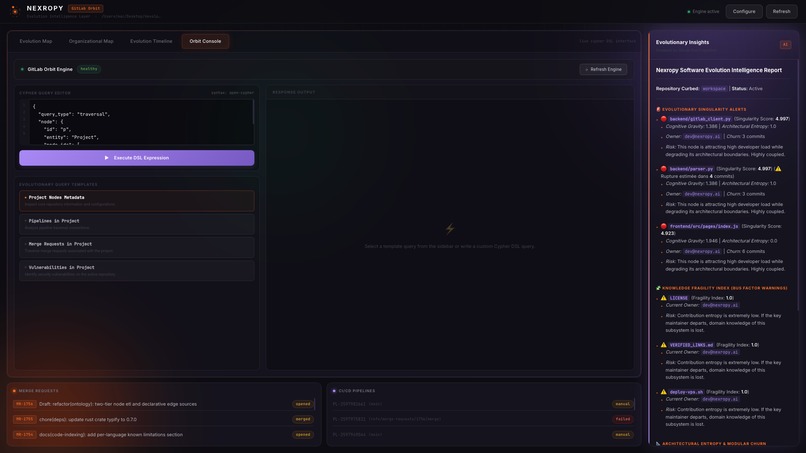
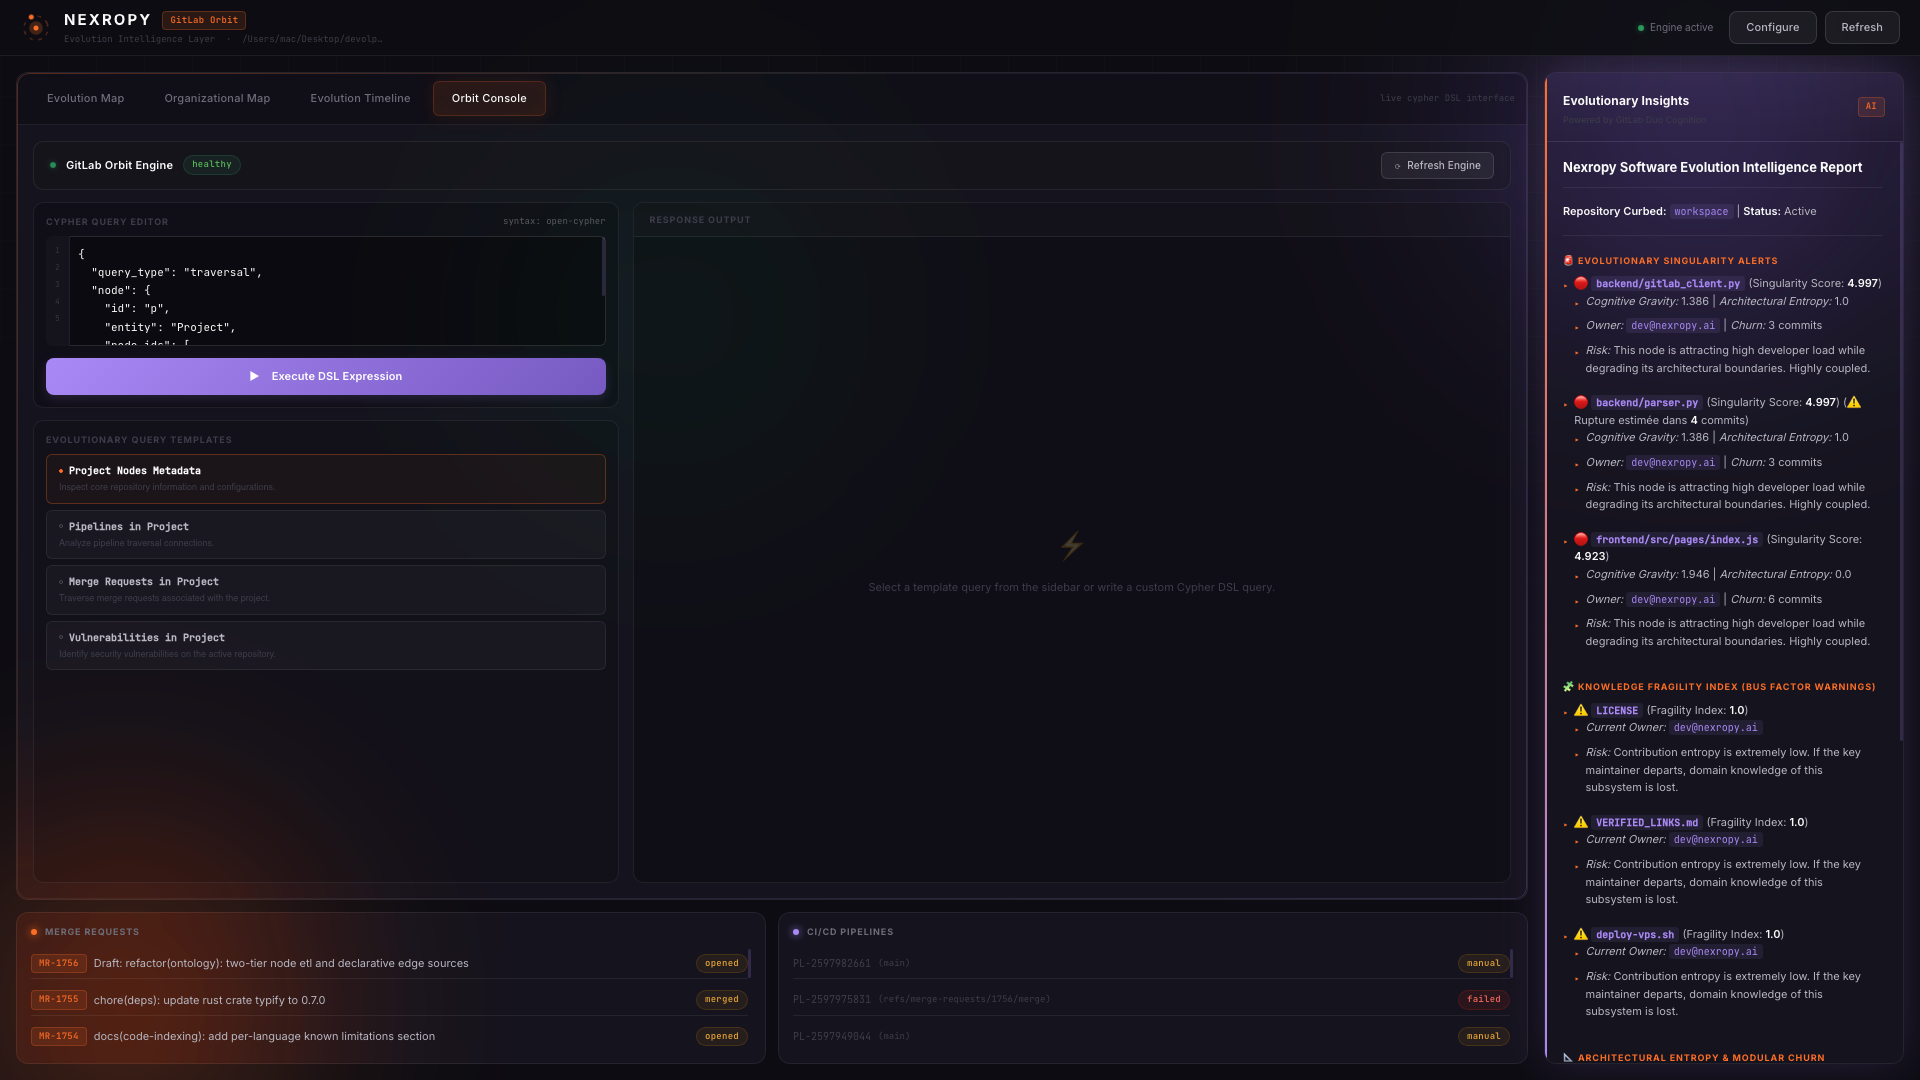
Dedicated Orbit Console for executing raw Cypher queries over the live GitLab Orbit graph directly inside the Nexropy dashboard.
-

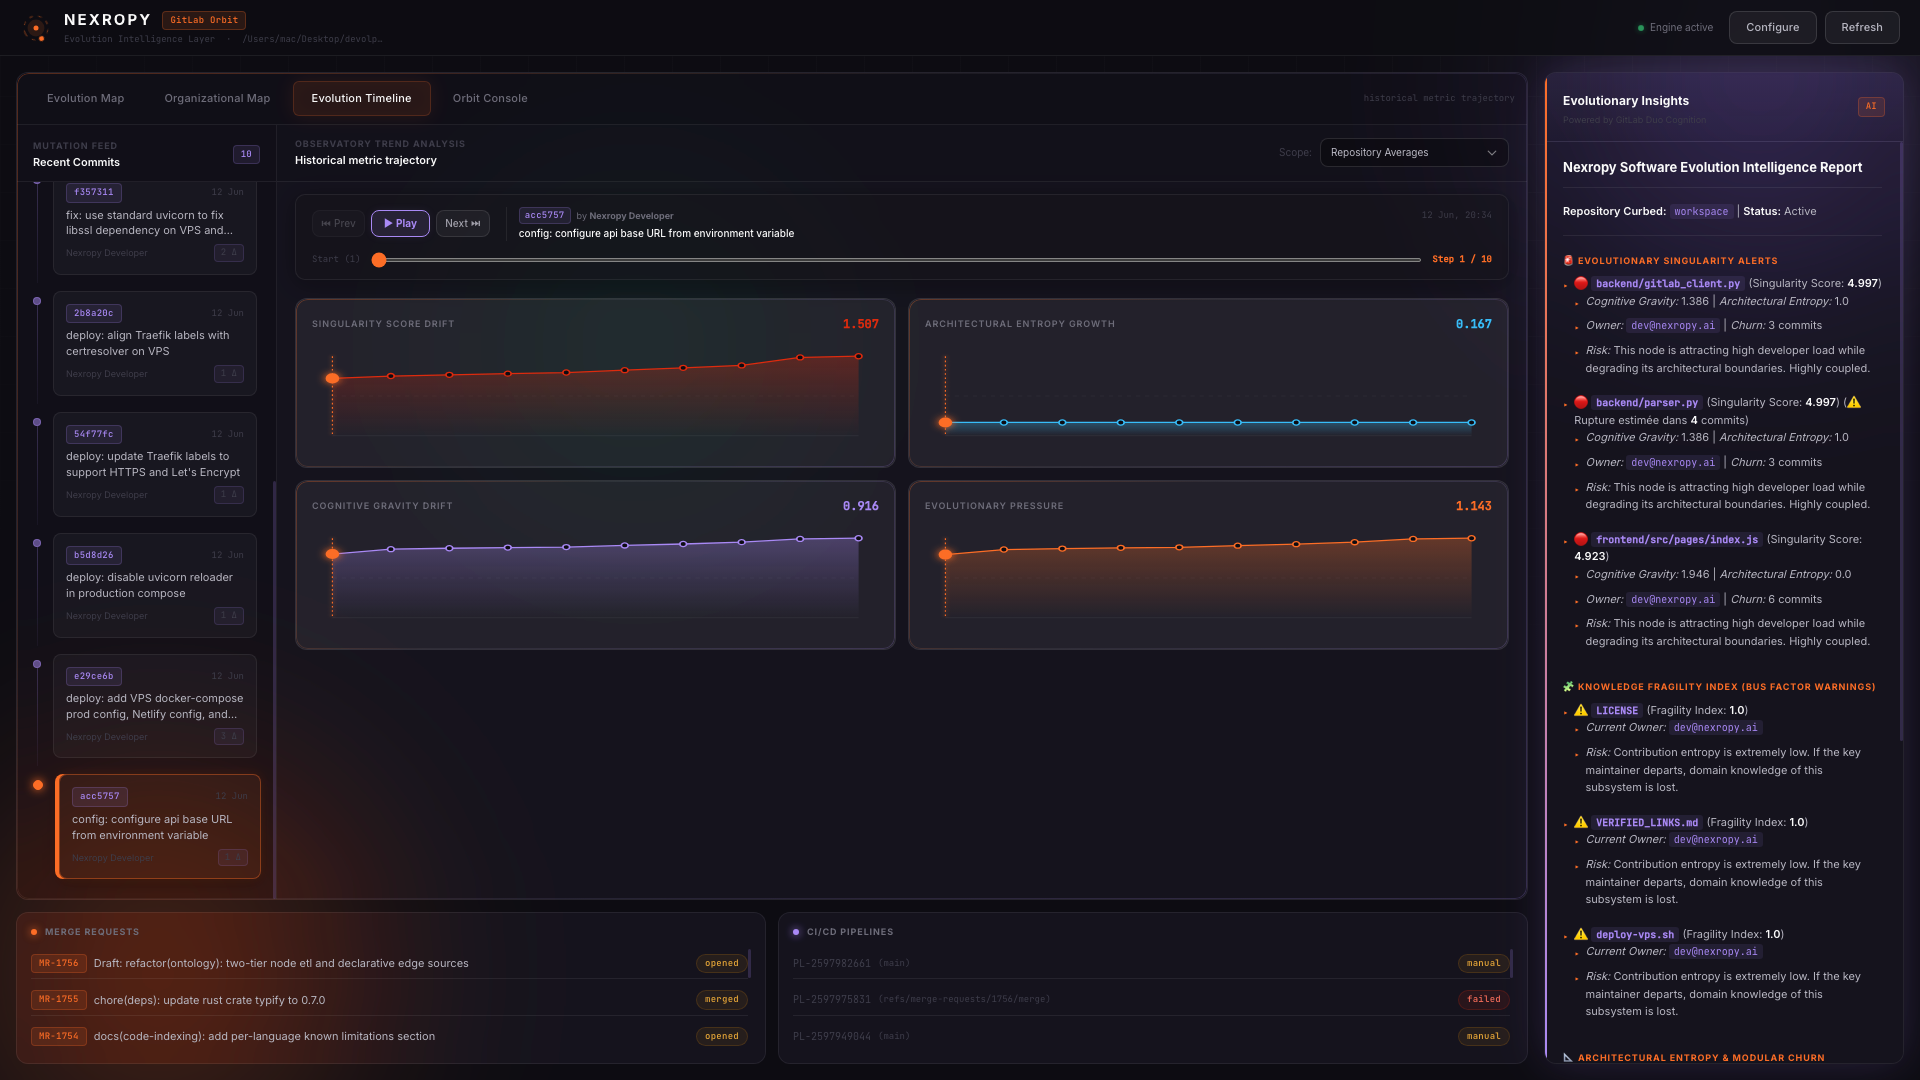
Historical metric trajectory charts tracking gravity, entropy, and fragility over the repository's GitLab commit timeline.

Inspiration
Technical debt is often an invisible force. In complex software development lifecycles (SDLC), teams struggle to quantify how architectural coupling, developer churn, and knowledge silos (the "bus factor") affect code stability. When we read about GitLab Orbit—a system capable of modeling the SDLC as a queryable property graph—we were inspired to build Nexropy.
Our vision was to create an Evolution Intelligence Layer that sits on top of GitLab Orbit. Nexropy acts as a flight telemetry board for codebases, translating raw graph data into actionable mathematical scores and visual dependency maps to help developers refactor code before it breaks.
What it does
Nexropy maps code dependencies, commit histories, pipeline statuses, and author statistics into a unified dashboard and a GitLab Duo Chat skill. It computes five key evolutionary metrics using graph theory algorithms:
- Cognitive Gravity (\(C_g\)): Concentration of developer attention. Calculated via logarithmic code churn and contributor density: $$C_g = \log(1 + \text{churn}) \cdot \max(\text{authors}, 1)$$
- Architectural Entropy (\(E_a\)): Degradation of modular boundaries, measuring the ratio of cross-directory imports: $$E_a = \frac{\text{external_dependencies}}{\text{total_dependencies}}$$
- Knowledge Fragility (\(F_k\)): Computes Shannon entropy on code ownership statistics. If a single developer maintains a file, fragility peaks at \(1.0\) (high bus factor risk).
- Evolutionary Pressure (\(P_e\)): Correlates the file mutation speed with corresponding pipeline failure history: $$P_e = \log(1 + \text{churn}) \cdot (1.0 + \text{failure_rate})$$
- Singularity Score (\(S_s\)): The convergence indicator of stress points, highlighting critical bottlenecks: $$S_s = C_g \cdot (1.0 + E_a) \cdot F_k \cdot P_e$$
Nexropy provides an interactive visualization map (powered by Cytoscape.js) to explore these metrics, a simulation engine to test proposed changes before committing them, and an AI-driven remediation planner integrated directly with GitLab Duo via a custom slash command (/nexropy).
How we built it
Nexropy is structured as a monorepo consisting of:
- Backend (Python/FastAPI): Orchestrates Git clients, resolves file dependencies using static AST analysis, queries the remote GitLab Orbit database via Cypher DSL, and computes graph metrics using the NetworkX library.
- Frontend (Next.js/React): Built as a premium dark-themed Single Page Application (SPA). It maps components dynamically using Cytoscape.js, rendering stress nodes in green, orange, or red based on their singularity threshold.
- GitLab Duo Integration: Configured via skills/nexropy/SKILL.md to parse intent and surface evolutionary reports directly inside the developer's chat console.
- Production Infrastructure: Dockerized and deployed via a secure Traefik router on a VPS for the API, and deployed on Netlify for the frontend.
Challenges we ran into
One major challenge was stabilizing the production environment under strict network constraints. We encountered Python typing import differences between standard local runtime environments and slim Docker containers, causing early service crashes. We resolved these by implementing stricter global type definitions in our API router.
Additionally, configuring SSH deployment automation while avoiding security rate-limits on our VPS required refactoring our shell script to bundle multiple remote tasks into a single, cohesive SSH session.
Accomplishments that we're proud of
We are incredibly proud of building a fully functional, high-performance, and visually stunning telemetry system in under two weeks. The simulation dashboard works in real-time, allowing developers to play through commit histories like a video player and see technical debt fluctuate dynamically on the graph map. Securing and deploying the entire stack on custom production domains was a rewarding final milestone.
What we learned
We gained deep insights into property graphs, learning how to write optimized Cypher queries to navigate pipelines and merge requests. We also realized how simple, normalized statistical metrics (like Shannon entropy) can accurately reflect real-world team risks, such as bus factors and architectural drift, when applied to codebases.
What's next for Nexropy
We plan to expand Nexropy’s predictive engine by integrating machine learning regression models to predict exactly which upcoming commit will trigger a pipeline failure. We also want to support cross-repository dependencies inside GitLab Orbit, allowing teams to analyze microservice architecture drift across the entire organization.

Log in or sign up for Devpost to join the conversation.