-
-
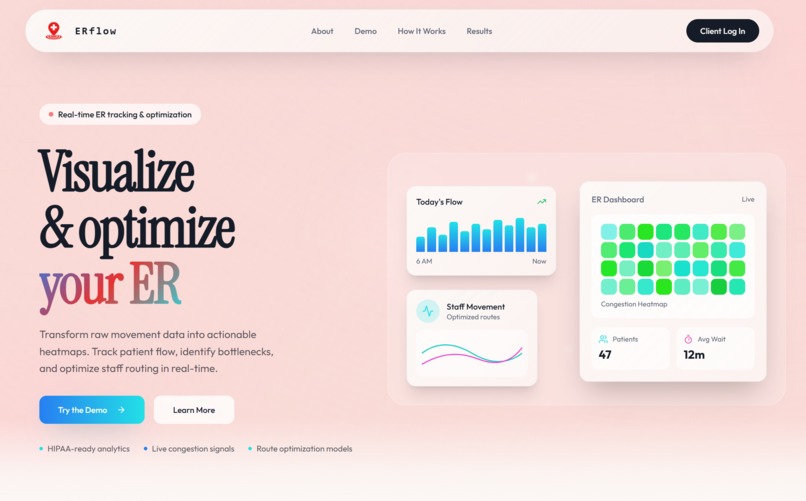
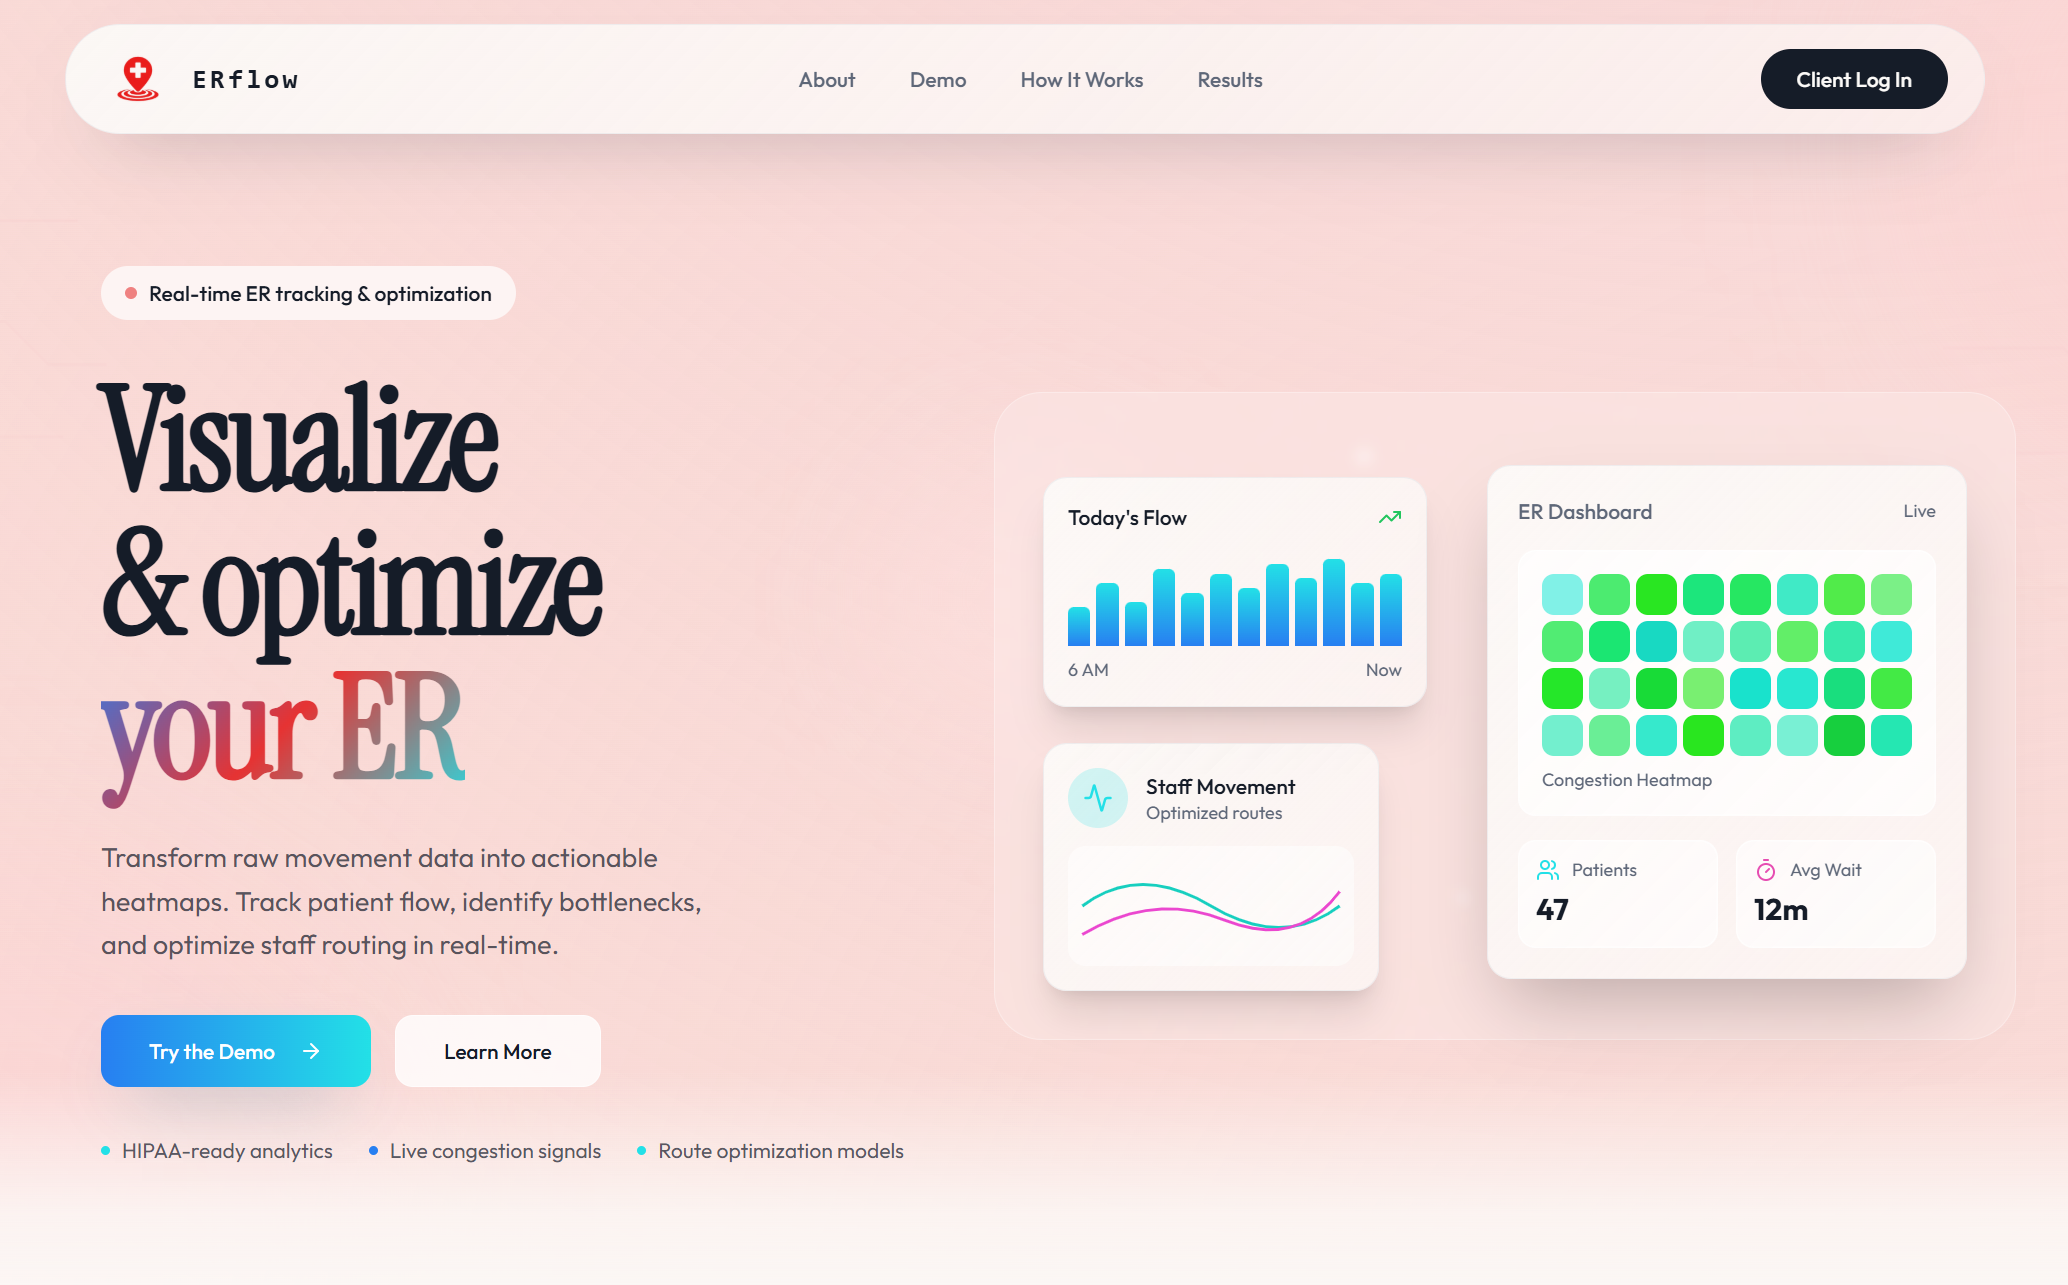
ERflow Landing Page
-

ERflow Logo

💡 Inspiration
Hospitals around the world struggle with overcrowding, especially during peak hours or emergency situations. When patient volume spikes, inefficient use of space can lead to congestion, which delays treatment, increases wait times, and places dangerous strain on medical staff. These delays are not just operational issues. They can directly impact patient outcomes, especially for those with time-sensitive or critical conditions. We were inspired by the idea that even without increasing staffing levels or building new infrastructure, better insight into how hospital space is actually used could help reduce bottlenecks, improve patient flow, and ultimately support safer, more timely care.
⚙️ What it does
ERflow works by simulating hospital movement and visualizing congestion through an interactive, web-based dashboard. The simulation models real hospital interactions, such as patients waiting in the waiting room and nurses periodically escorting patients to treatment areas. As the simulation runs, the system generates real-time heatmaps showing where patients, nurses, and doctors accumulate over time. Using anomaly detection, we identify spatial hotspots (areas that experience unusually high congestion compared to surrounding spaces). These detected hotspots are then passed into an AI system that analyzes the hospital layout and congestion patterns to generate actionable recommendations, such as rerouting patient flow, redistributing staff, or reconsidering room placement. This allows users to directly explore potential solutions through a fully functioning website interface. Users are able to log into the website to view simulation results, explore detected hotspots, and interact with the generated recommendations through a clear and intuitive interface.
🛠️ How we built it
We built a grid-based hospital simulation that models patient arrivals, staff movement, waiting areas, and treatment rooms. As the simulation runs, we track where patients, nurses, and doctors spend time and aggregate this data into a 2D congestion heatmap. To identify bottlenecks without relying on fixed thresholds, we used WoodWide AI’s anomaly detection to find locations that were significantly more congested than surrounding areas. These hotspot locations were then structured and passed into an AI system for interpretation. To make this process efficient, we used The Token Company to compress the hotspot and layout data before sending it to Gemini. This allowed us to provide sufficient context for generating insights while keeping input size manageable and reducing token usage. Gemini then produced actionable suggestions for addressing congestion issues. All graphs and visualizations were generated using Matplotlib. The website was built with React, Vite, Typescript, and Supabase.
🚧 Challenges we ran into
One significant challenge was access to real hospital video data. Due to privacy regulations such as HIPAA, obtaining footage of patient movement is extremely difficult, hence why we decided to create our own simulation. Even if we had access to real video, a single camera cannot capture an entire hospital floor, meaning multiple camera feeds would need to be combined to form a complete view of movement and congestion. Our own simulation to model hospital activity in a controlled and privacy-safe way. This allowed us to experiment with different layouts, traffic patterns, and staffing scenarios while still producing realistic congestion data for analysis.
🏆 Accomplishments that we're proud of
We are proud of building a fully functioning hospital simulation that realistically models patient flow, staff movement, and space usage. We are also proud of learning and successfully integrating tools that were new to us, including WoodWide AI for hotspot detection and The Token Company for input compression. We found these tools to be incredibly useful in streamlining our application, simplifying elements that were difficult to work with before. Applying these tools helped us better understand how to quickly learn, adapt, and iterate with unfamiliar technologies.
In addition, we are proud of the user interface and overall usability of the website. We spent significant time refining the frontend and design to ensure that congestion patterns, detected hotspots, and suggested improvements were easy to understand and navigate. We even communicated with real healthcare professionals to do UX testing with our application, with positive feedback given all across our project.
📚 What we learned
Throughout the project, we learned how to build on our existing knowledge while adapting to new technologies. Integrating unfamiliar tools such as WoodWide AI and The Token Company pushed us to carefully read, understand, and effectively use API documentation rather than relying on trial and error.
We also learned the importance of having a well-thought-out plan before starting development. Taking time early on to think through data flow, system boundaries, and end goals made the implementation process smoother and helped us avoid major redesigns later in the project
🚀 What's next for ERflow
Next, we plan to focus on securing data handling to meet HIPAA compliance requirements so the system can be used safely in real clinical environments. We also want to reach out to hospitals and clinics to better understand their operational needs and explore potential pilot use cases.
From a technical perspective, we aim to move beyond purely simulated inputs by supporting real camera feeds. This includes adapting the system to work with standard webcams and combining multiple viewpoints to better capture movement across larger spaces
Made with love by Pranay M, Zinnun M, and Ethan Z ❤️
Built With
- css
- gemini
- html
- javascript
- matplotlib
- python
- react
- supabase
- tokencompany
- typescript
- vite
- woodwide


Log in or sign up for Devpost to join the conversation.