-
-
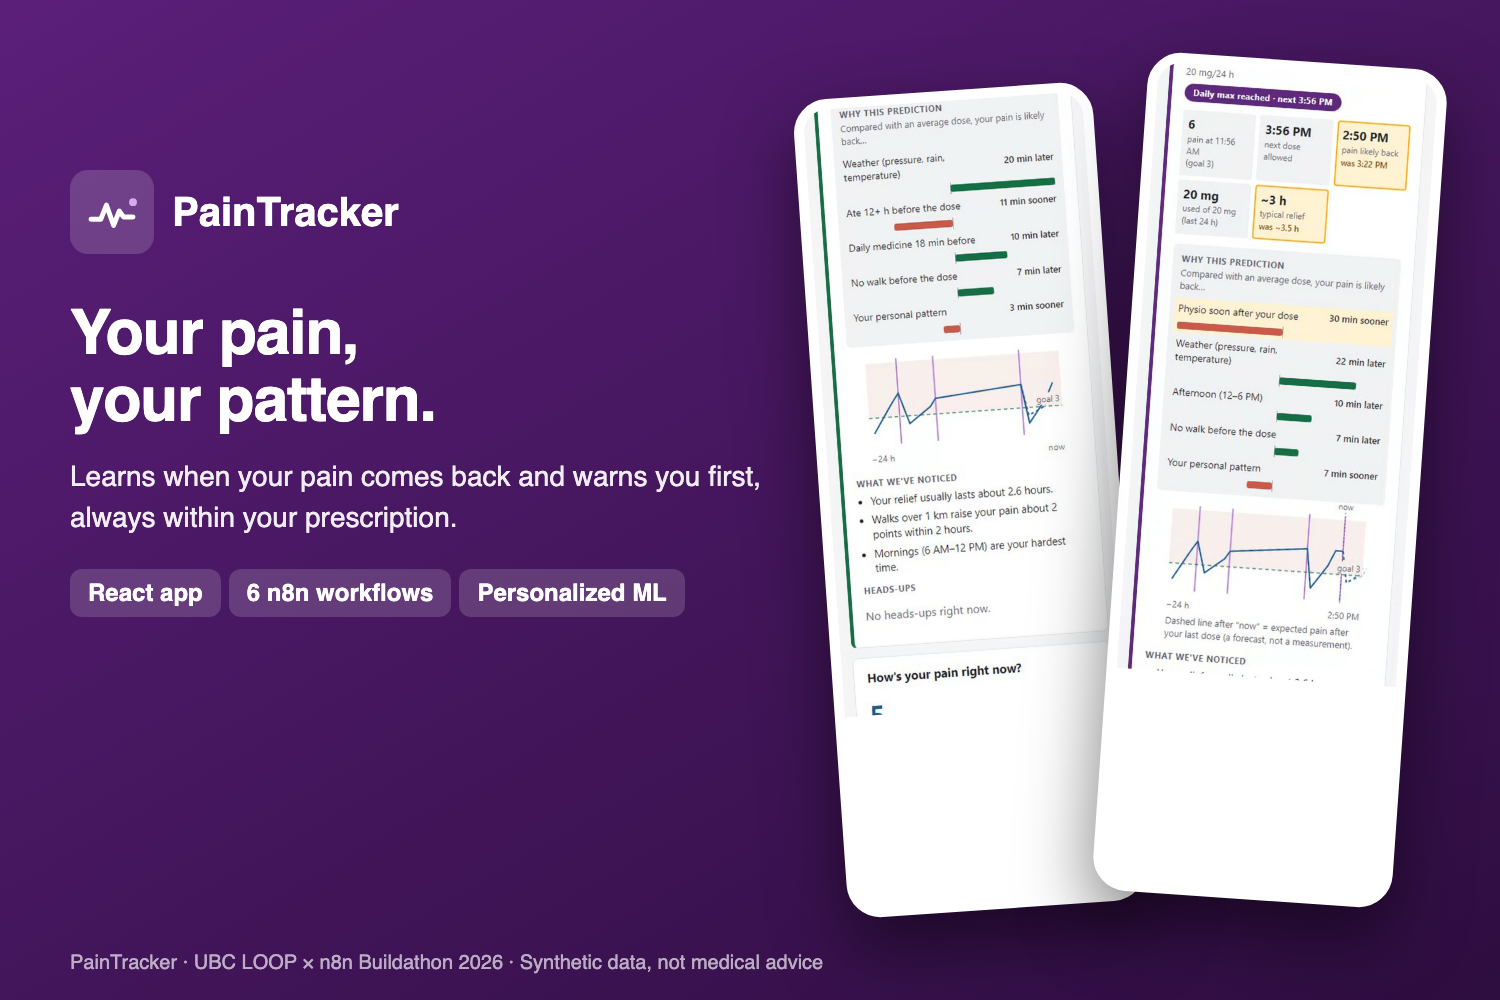
Your pain, your pattern. (logo + 2 phones)
-
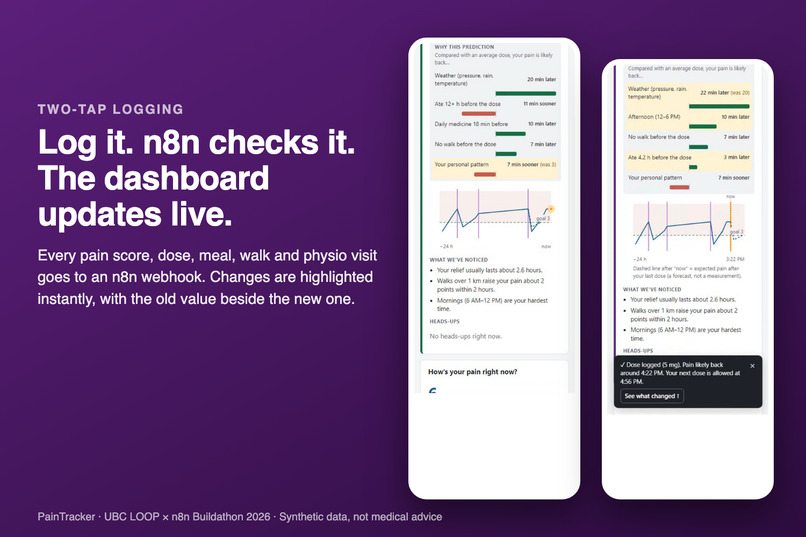
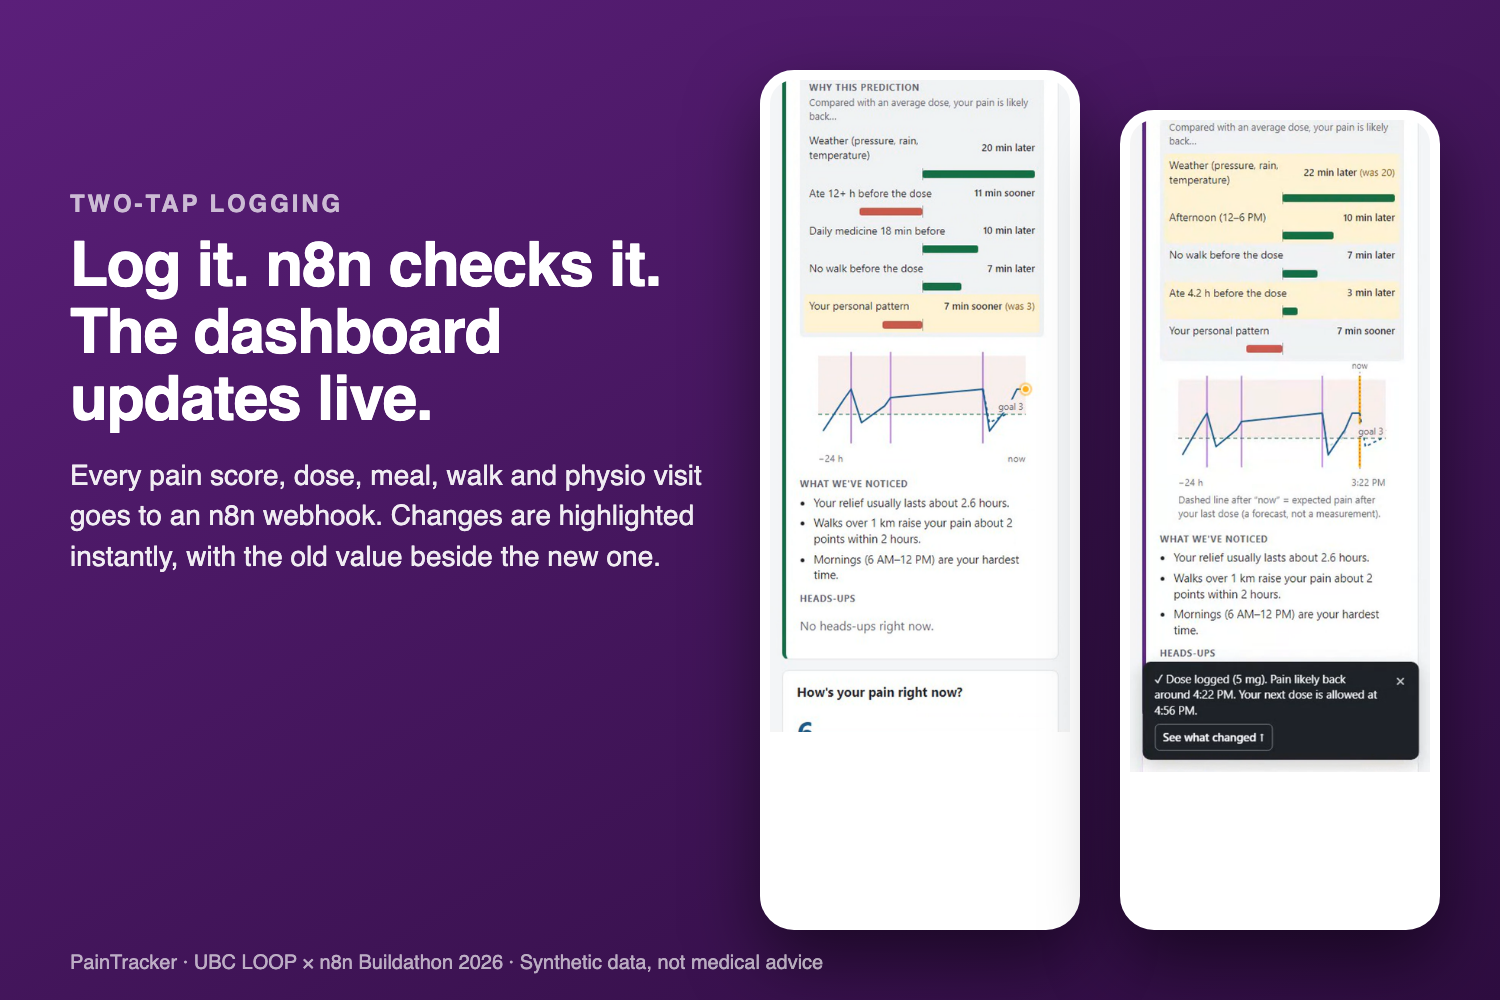
Log it. n8n checks it. The dashboard updates live.
-
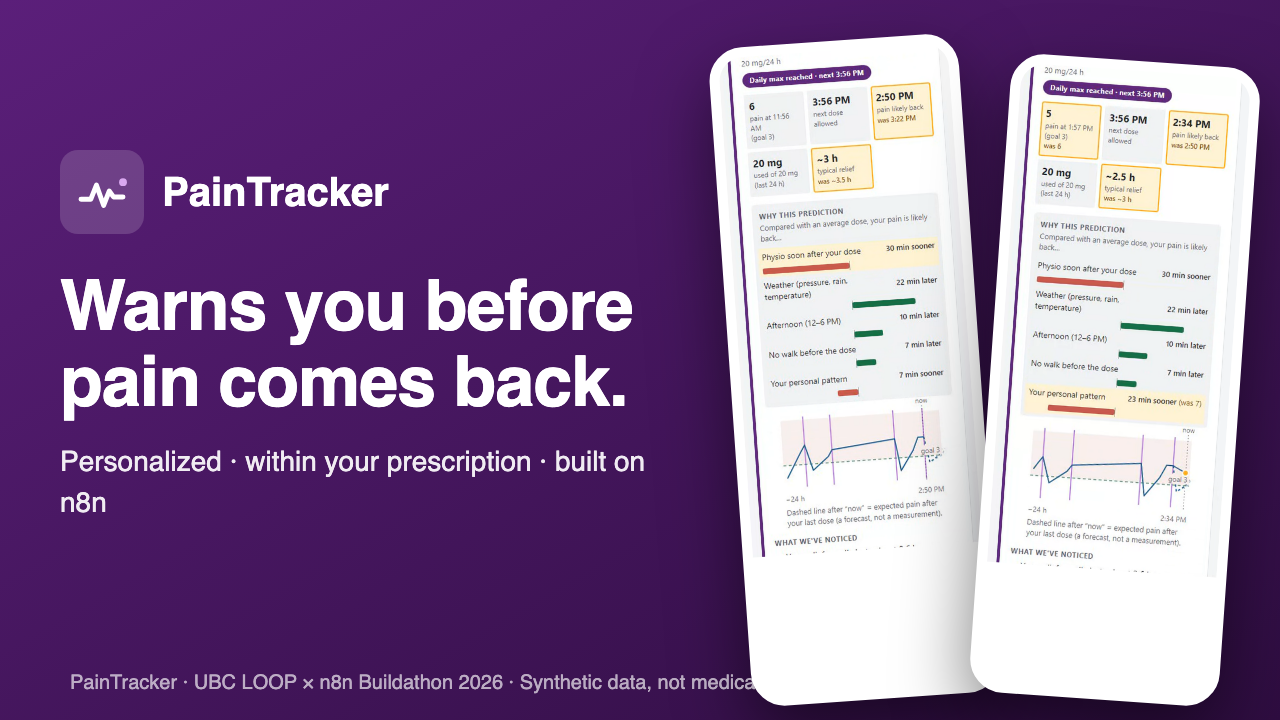
Warns you before pain comes back. (1280×720)
-
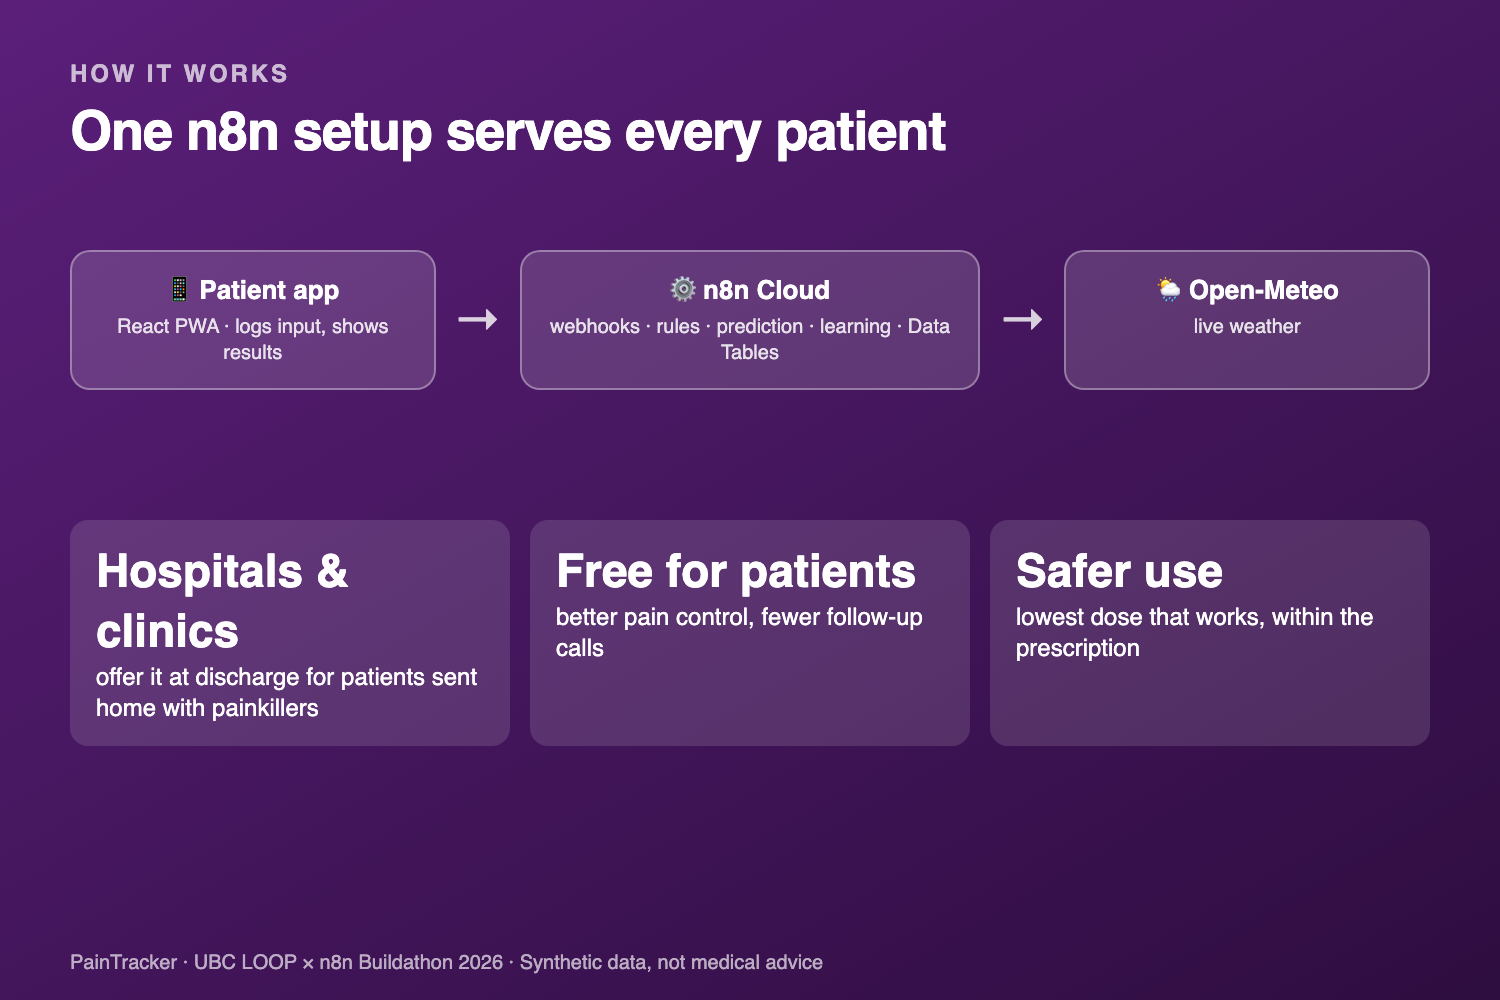
One n8n setup serves every patient (architecture + business)
-
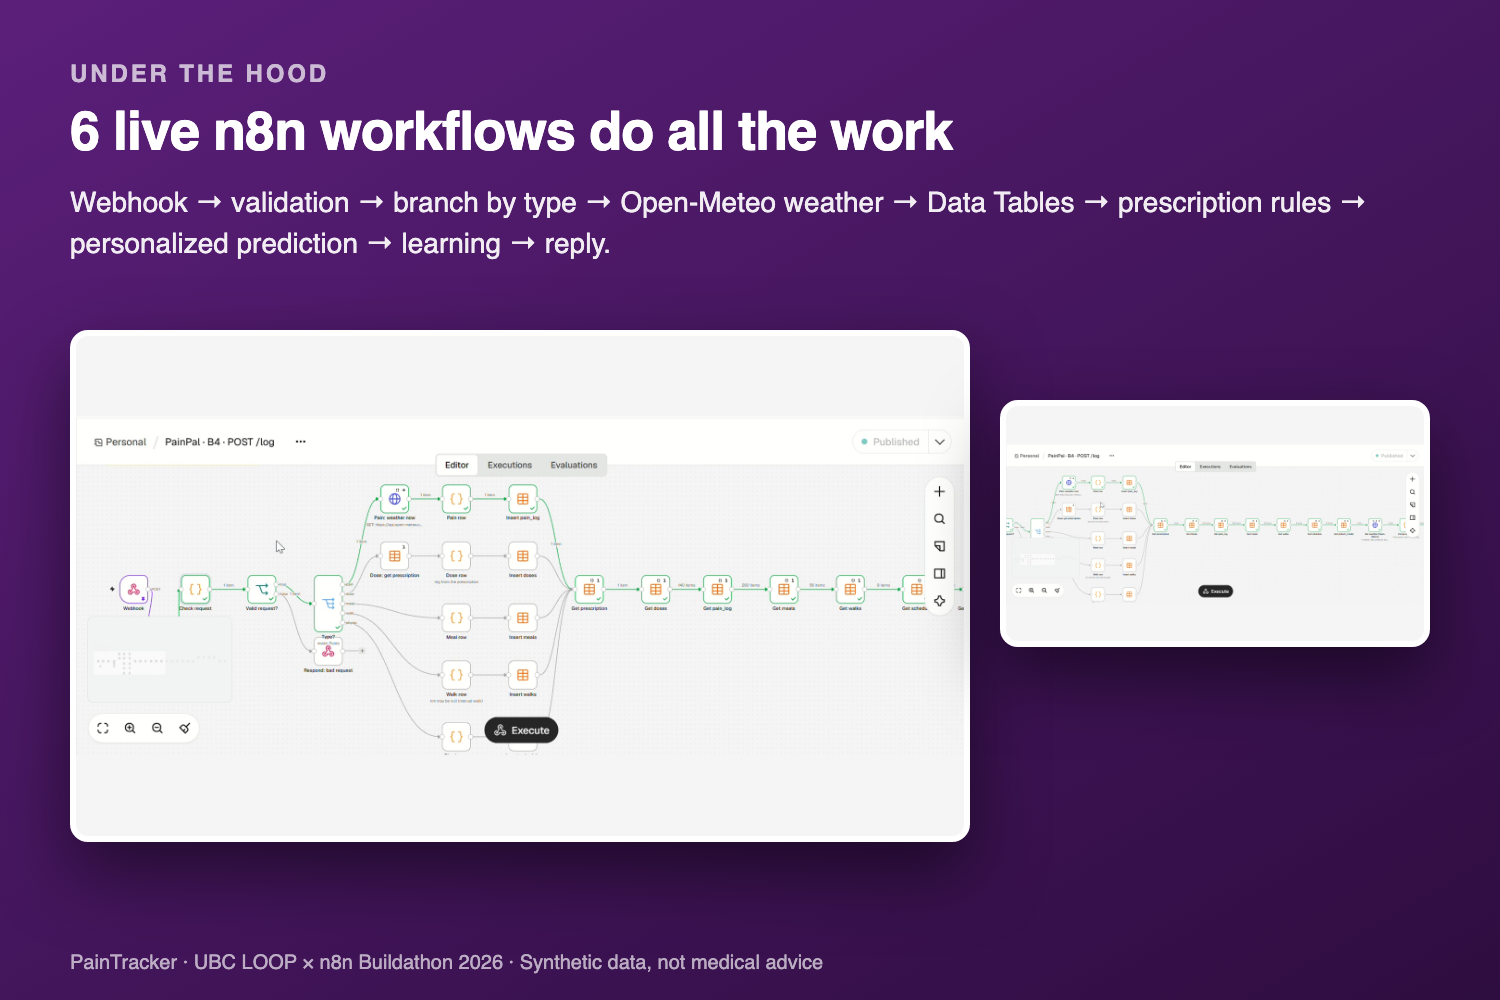
6 live n8n workflows do all the work
-
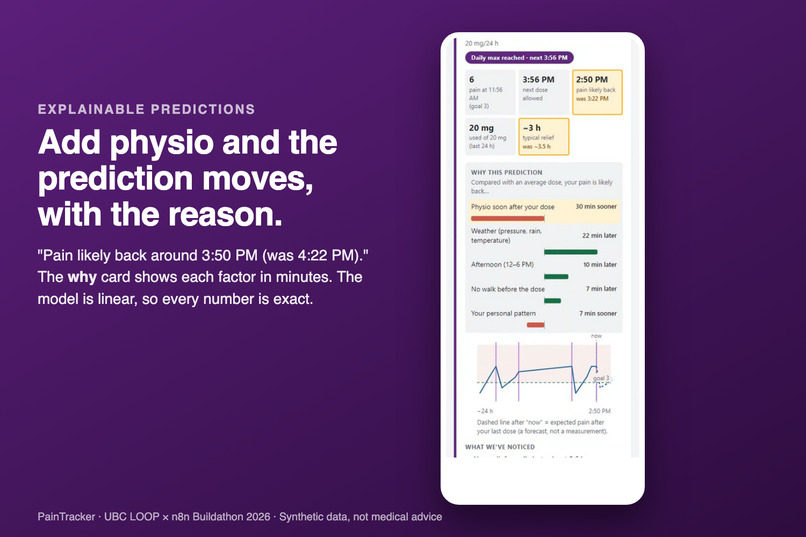
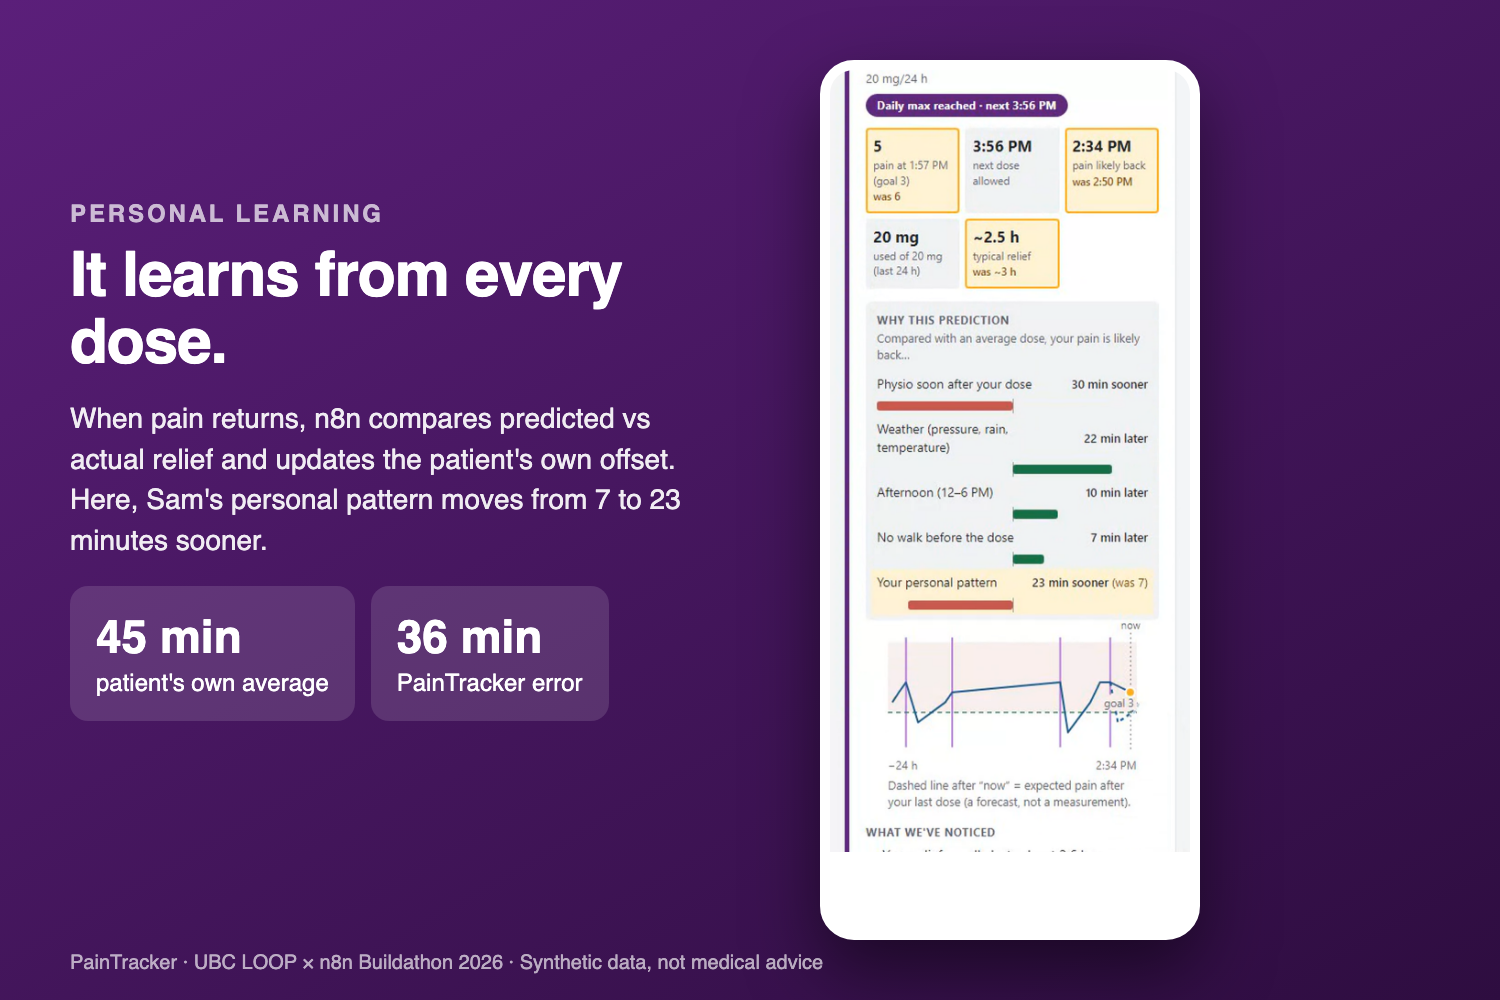
It learns from every dose. (45 → 36 min)
-
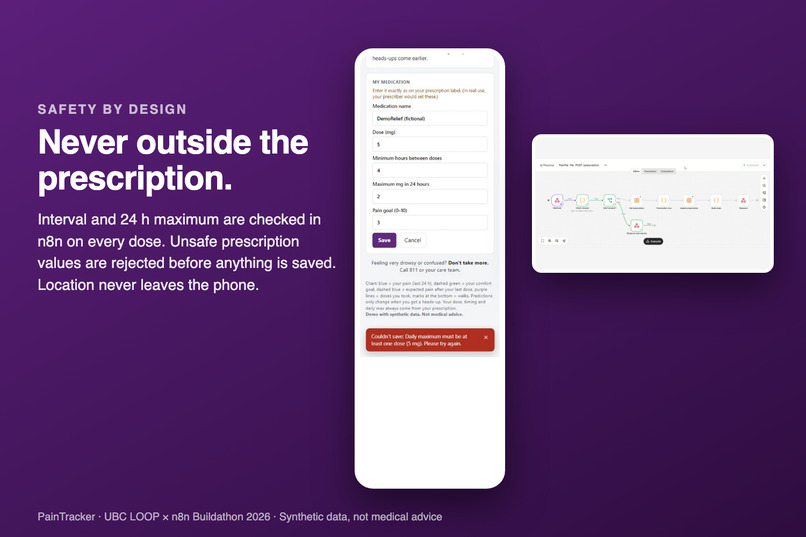
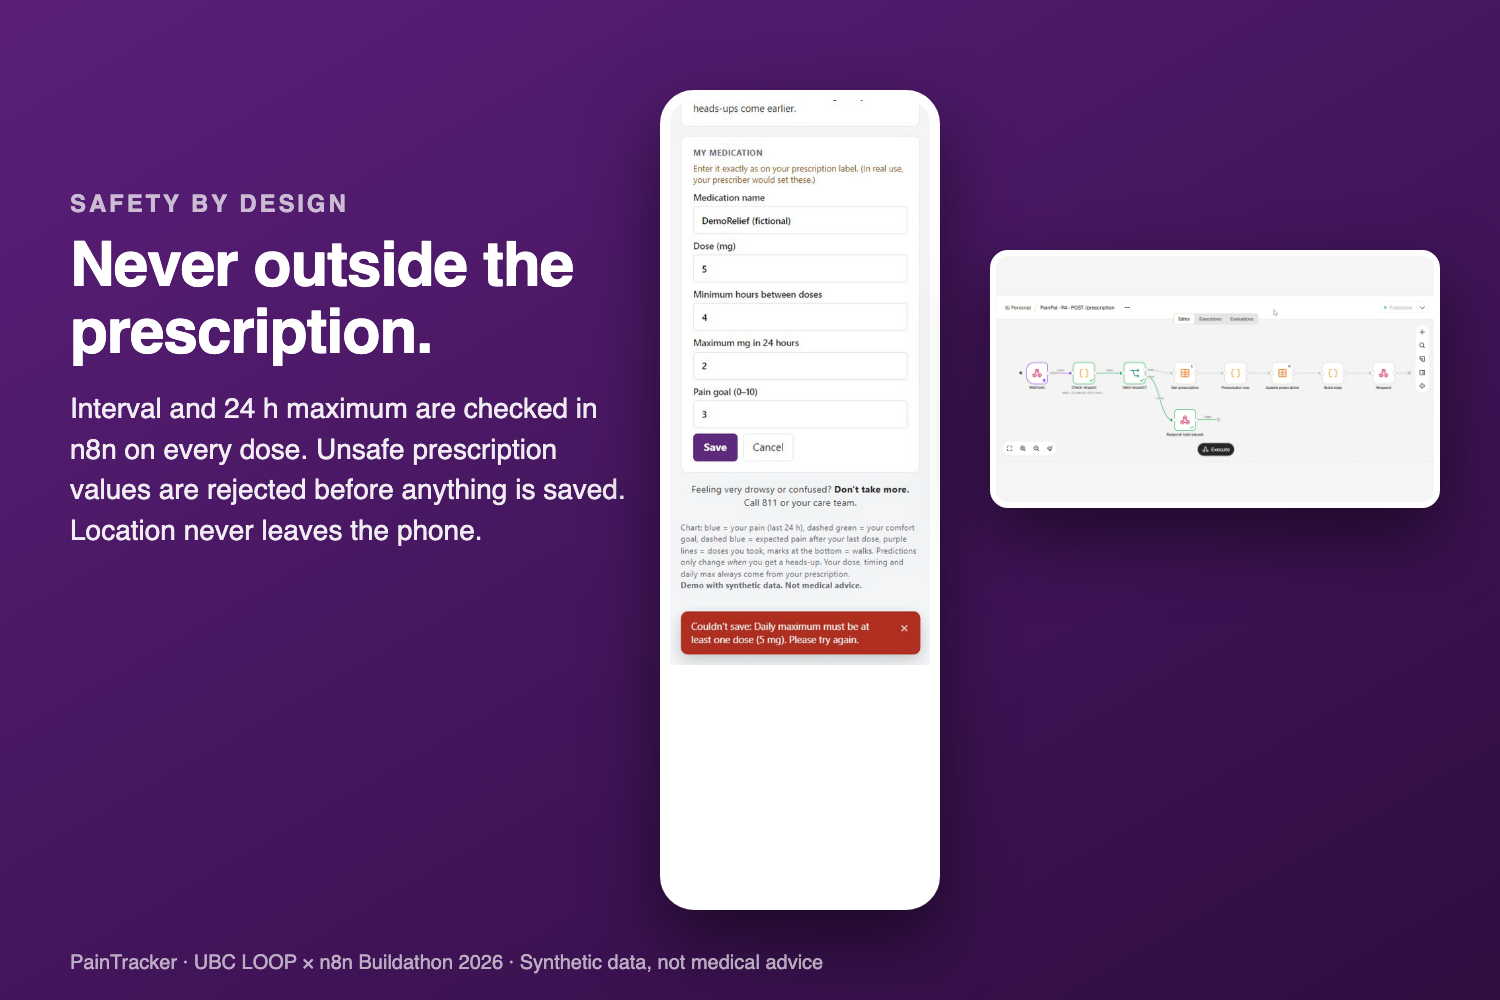
Never outside the prescription.
-
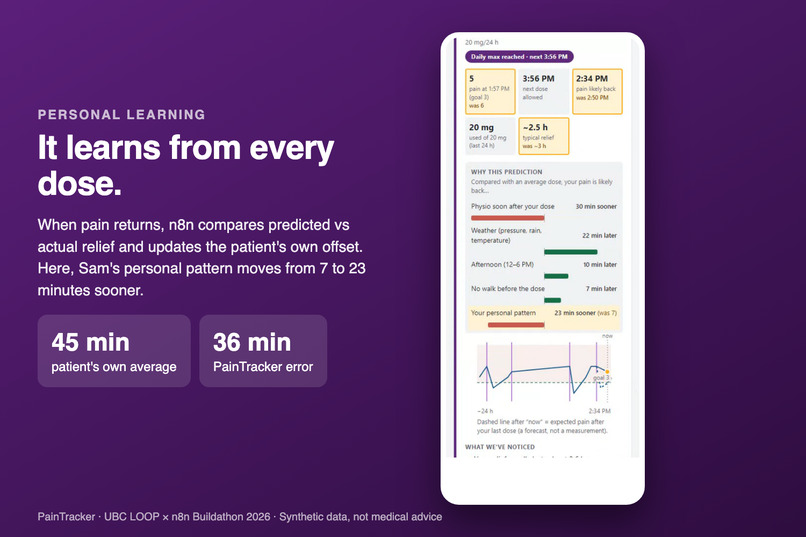
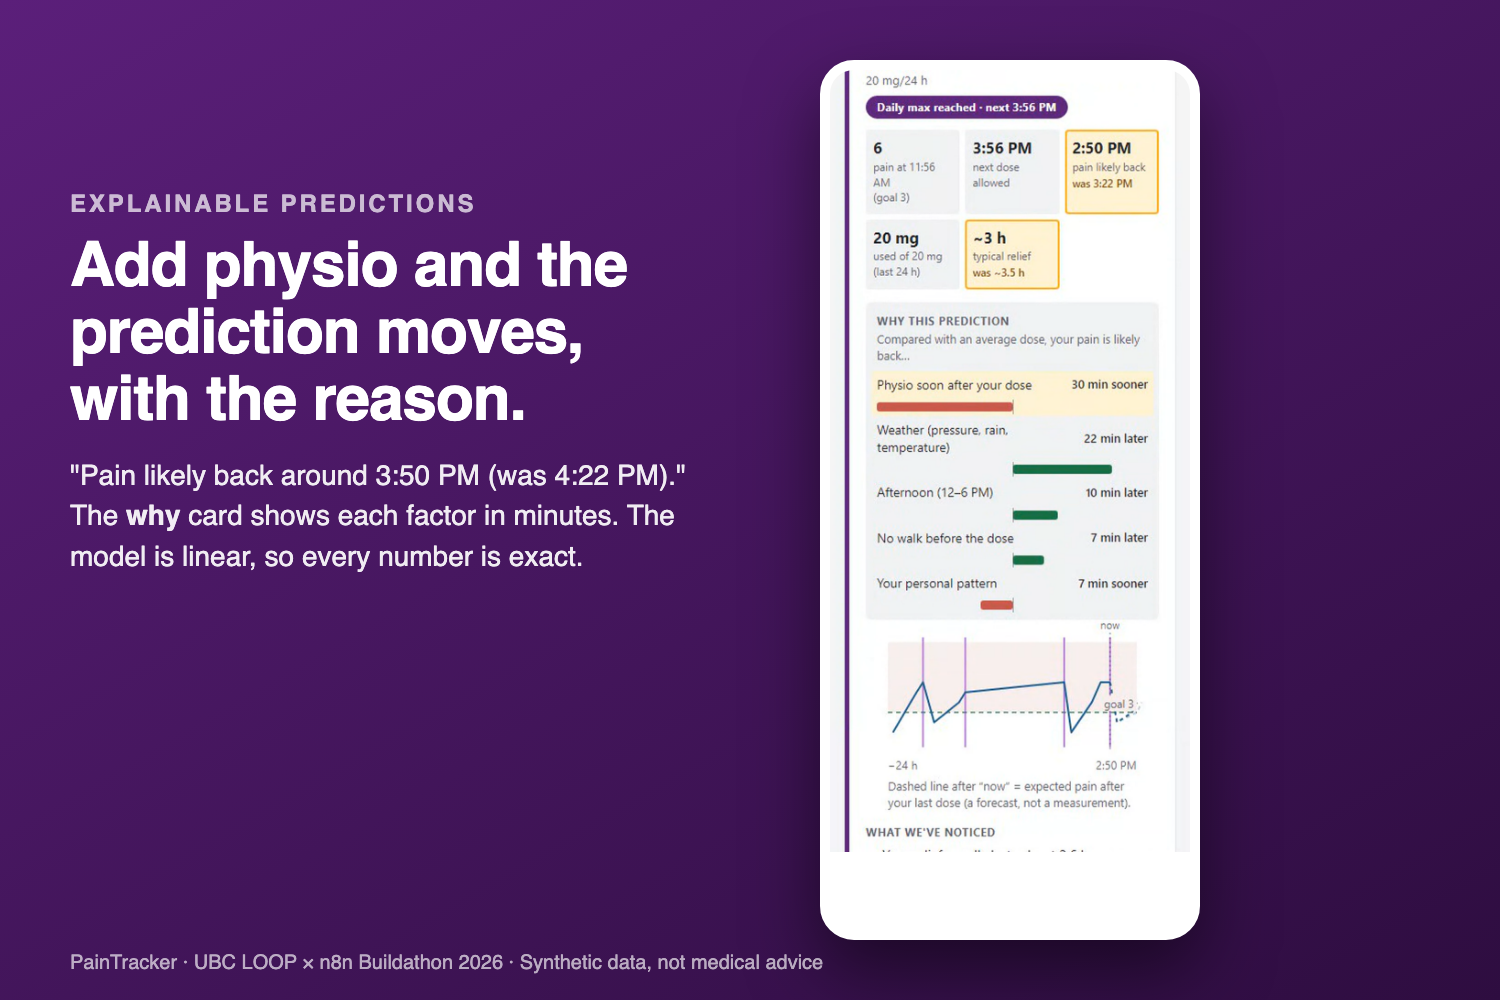
Add physio and the prediction moves, with the reason.
Project name
PainTracker
Short description
Too little painkiller leaves you in pain; too much risks side effects and dependence. PainTracker learns your personal pain pattern and warns you before pain returns, so you take only what you need.
About the project
Inspiration
Pain is personal, but painkiller prescriptions aren't. "Take one every 4 hours as needed" is the same rule for everyone, yet pain is subjective and doesn't follow a clock. For one person it comes back sooner in the evening; for another, after physio, a long walk, or on a rainy day.
Reagan, one of our team, has worked as a nurse and has seen how much guesswork goes into as-needed pain medication, for patients and for the people caring for them. At home, patients are on their own: wait too long and the pain is harder to bring back down; take more than needed and you risk side effects and dependence. In BC, where drug toxicity has been a declared public health emergency since 2016, that risk matters.
The clues are already there: the time of day, how much you walked, when you last ate, an upcoming physio session, the weather. Together they form a pattern that is hard for a patient or a provider to see, but that a model can learn. We asked: what if an app learned your pattern from these everyday signals and warned you before your pain came back, so you get the best pain control from the least medication you need, always within your prescription?
What it does
PainTracker is a patient web app (installable on your phone) that:
- 📝 Logs pain (0–10), doses, meals, walks and physio appointments in a couple of taps
- 🚶 Tracks walks automatically while the app is open. Distance is computed on the phone, and only
{km, minutes}is ever sent. - ⏱ Shows when your next dose is allowed and how much of your 24 h maximum you've used, with a clear "Daily max reached" state
- 💊 Lets you enter your prescription from the label (dose, hours between doses, daily max, pain goal); n8n validates it and applies the limits right away
- 🔮 Predicts when your pain is likely to return ("Pain likely back around 3:00 PM") and draws the expected pain as a dashed forecast line on the chart
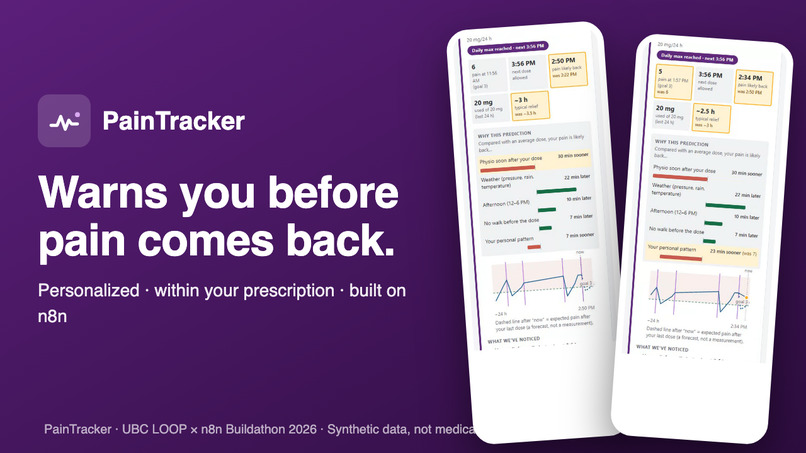
- ❓ Explains why: "Evening: 48 min sooner · Physio soon after your dose: 32 min sooner · Your personal pattern: 14 min later"
- 🩺 Plans around physio: add an appointment and the prediction moves right away
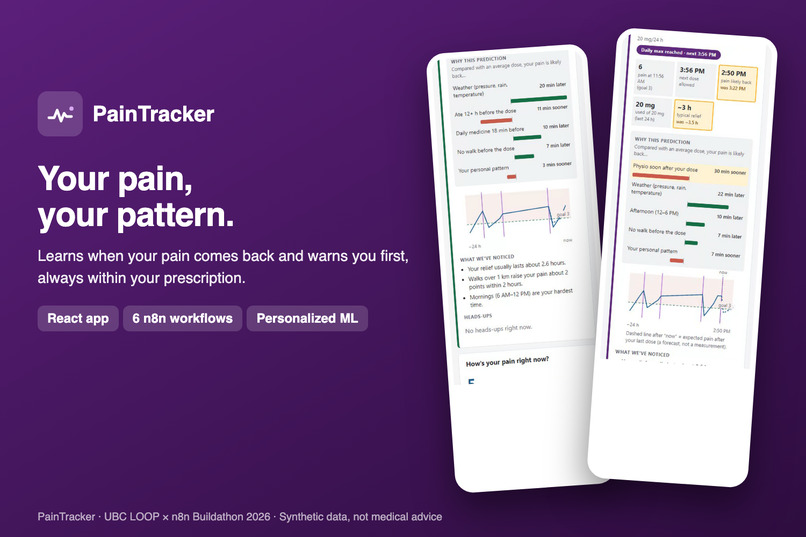
- 💡 Finds your patterns: "Walks over 1 km raise your pain about 2 points within 2 hours"
- 🧠 Learns from every dose: "Learned from 71 of your doses. Your pain returns about 14 min later than average."
- 📈 Updates live: after each log the dashboard refreshes and highlights exactly what changed
It never suggests anything outside your prescription. The model only changes when you get a heads-up, never how much you take.
Why it matters
For patients: precision pain control. As-needed medication works best when it's taken at the right time, not too late and not more than needed. A heads-up before pain returns helps patients stay comfortable without stacking doses or waiting in pain.
For the health system: less risk of dependence and lower costs.
- Starting opioids after surgery is a known route into long-term use. In a large US study, about 6% of patients who had never taken opioids were still filling prescriptions 3–6 months after surgery (Brummett et al., JAMA Surgery, 2017).
- Opioid use cost Canada about $7.1 billion in 2020, mostly from lost productivity and early deaths (Canadian Substance Use Costs and Harms, CCSA/CISUR).
- Poorly controlled pain also costs hospitals: it is linked to longer stays, readmissions and extra calls and visits.
PainTracker targets the moment where these problems start: a patient at home with an as-needed prescription and no feedback.
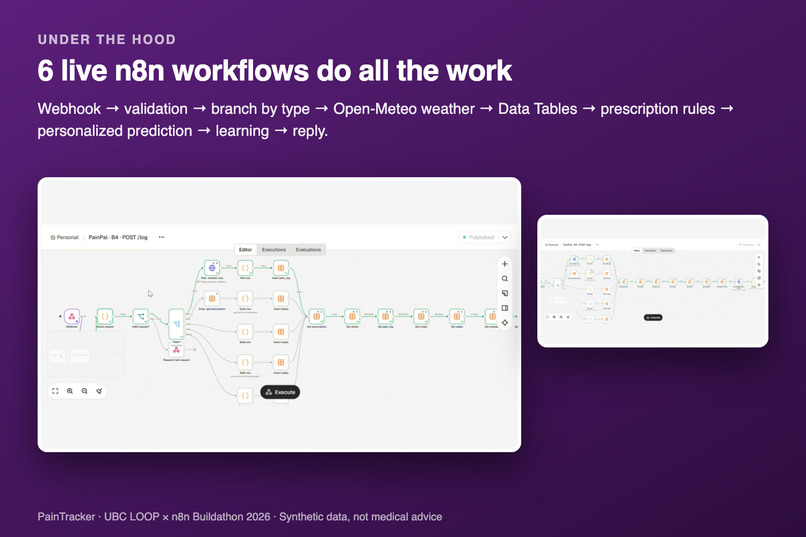
Who would use it. Hospitals and health authorities would offer it to patients they send home with as-needed pain medication (after surgery, injury or physio), as part of discharge and follow-up. With the patient's approval, the care team gets a summary of real pain patterns instead of guesses at the next appointment. That helps them adjust the prescription sooner.
Research says this is feasible. Predicting pain before it returns is an active research goal, and our design follows what the research found:
- Predicting flares works. Deep learning models trained on pain scores from 4,870 hospital admissions could predict when cancer pain would flare, and the authors suggest this could allow pain to be managed before it peaks (Bang et al., 2023).
- Weather matters, and differs from person to person. In a home study of patients with advanced cancer, barometric pressure and humidity were strongly linked to pain for some patients (r up to 0.90) but not others, and machine learning predicted breakthrough pain episodes with 70% accuracy (Homdee et al., BMC Palliative Care, 2024). That's why PainTracker uses weather and learns a personal offset for each patient.
- Clinical notes add signal. Combining a prediction model with a language model that reads nurses' and doctors' notes improved the prediction of pain episodes in lung cancer inpatients (arXiv preprint, 2025). PainTracker doesn't do this yet, which makes it a natural next step.
What's different about PainTracker: these were research studies of cancer patients. PainTracker is an everyday tool for anyone sent home with as-needed pain medication. It's personal to each patient and always within their prescription.
These are goals, not results. The 70% and other figures above come from those studies, not from us. Our numbers come from synthetic data. Showing that PainTracker actually reduces doses or costs would need a clinical study.
How we built it
App: React + Vite, installable as a PWA, deployed on Vercel. The app only displays data and collects input; there is no business logic in the front end.
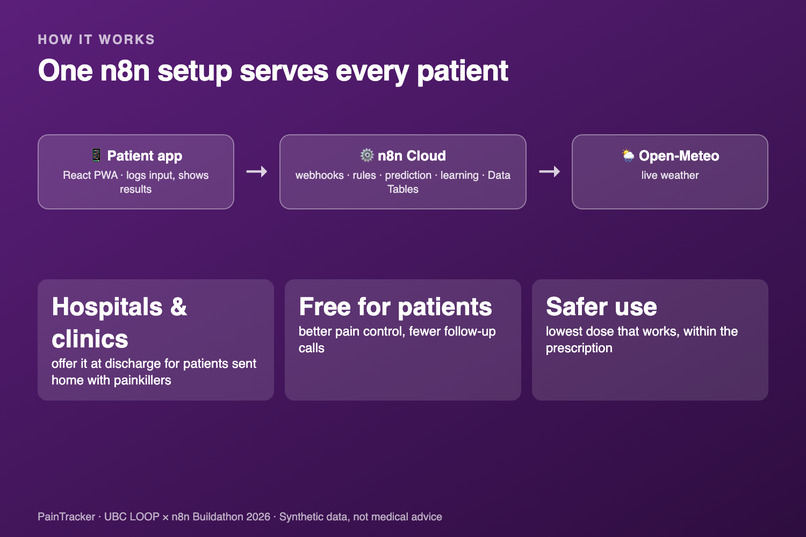
n8n does the real work. Six workflows on n8n Cloud, with all data in n8n Data Tables:
- POST /log validates and saves each entry (pain, dose, meal, walk, physio), adds live weather from Open-Meteo, checks the prescription rules, replies with a message and any warning (e.g. a dose taken too early), and learns from each completed dose.
- Check rules & predict computes the dose rules, the patterns, the prediction and the "why" factors.
- GET /dashboard returns everything the app shows, including the forecast line and upcoming physio.
- POST /prescription validates and saves the patient's medication limits.
- POST /demo-clock shifts "now" for live demos, so we can show learning without waiting hours. It's always labelled "Demo time" in the app.
- Setup creates the tables and loads the demo patient.
The prescription rules stay visible as IF nodes on the canvas. The next allowed dose is the later of the minimum interval and the time when the 24-hour total allows another dose:
$$ t_{\text{next}} = \max\big(t_{\text{last}} + \Delta_{\min},\ t_{\text{24h allows}}\big) $$
The model predicts $h$, the hours until pain rises above the patient's own comfort goal after a dose. We trained a Ridge regression (scikit-learn) on standardized features known at the time of the dose: time of day (as $\sin$/$\cos$ on a circle), evening, pain at dose, km and minutes walked in the previous 3 h, steps, physio within 2 h, hours since the scheduled medication and since the last meal, pressure change, temperature and rain:
$$ \min_{w,\,b}\ \sum_i \big(y_i - b - w^\top z_i\big)^2 + \alpha\,\lVert w\rVert^2, \qquad z_{ij} = \frac{x_{ij} - \mu_j}{\sigma_j} $$
The weights are exported to JSON and baked into an n8n Code node. Personalization is a per-patient offset $o_p$, added to every prediction and updated in n8n after each completed dose:
$$ \hat h_p = b + w^\top z + o_p, \qquad o_p \leftarrow 0.7\,o_p + 0.3\,\big(h_{\text{actual}} - \hat h_{\text{global}}\big) $$
So the app keeps learning from each patient without retraining. Because the model is linear, the "why" card is exact: each factor's effect is $w_j \cdot z_j$, shown in minutes.
Results on synthetic data (30 fictional patients × 21 days, trained on days 1–16, tested on days 17–21, average error):
| Model | Error |
|---|---|
| Patient's own median | 45 min |
| Linear, same for everyone | 38 min |
| Linear + personal offset (PainTracker) | 36 min |
Walk tracking runs entirely on the device. We measure distance between GPS fixes with the haversine formula:
$$ d = 2R \arcsin\sqrt{\sin^2!\frac{\Delta\varphi}{2} + \cos\varphi_1\cos\varphi_2\,\sin^2!\frac{\Delta\lambda}{2}} $$
Then we filter out GPS drift, low-accuracy fixes and vehicle speeds. A walk ends after 3 minutes without movement. Coordinates live only in memory and are thrown away after each walk.
Challenges we ran into
- No public dataset fit the problem. We needed time-stamped pain scores, as-needed doses, meals, walks and weather for the same patients, and when their pain came back after each dose. Public pain datasets are mostly one-off surveys or clinical-trial summaries, and real patient data is private for good reason. So we wrote a synthetic data generator: 30 fictional patients × 21 days, with realistic patterns built in (shorter relief in the evening, after walks and physio, and on rainy days). The catch: a model trained on synthetic data can only rediscover the patterns we programmed. It proves the method works, not clinical accuracy.
- Choosing the variables. Our first feature list included things like "days since surgery" and step goals from physio plans. We rewrote it to use only what the app and n8n can actually collect: time of day, pain at the dose, walks, meals, the scheduled medication, physio and weather. Every feature also had to be known at the moment the dose is taken, so the model never peeks into the future. We also split the data by time (train on days 1–16, test on days 17–21) instead of randomly, and dropped doses where we never saw the pain return (e.g. overnight), so the reported error reflects real forecasting.
- Scope. We planned email heads-ups, a weekly AI summary, Google Calendar sync, multiple medications and body-location tracking. We cut every feature that didn't serve the core loop: log → learn → heads-up. We dropped pain location once we realized nothing used it.
- Working in parallel. One of us built the app and the other built n8n and the model. A written API contract with fake JSON let the app be finished before the workflows existed. Edge cases like manual walks with no GPS distance (
km: null) had to be agreed on both sides. - GPS is noisy. Standing still can "move" you 10–20 m. We tested the walk detector against simulated tracks (standing, walking, driving, bad fixes) before trusting it on a phone.
- Patient vs clinician view. Our first design looked like a hospital monitoring board. We rebuilt it around one person: "Hi, Sam. Next dose 12:30 PM."
- Real data is messier than sample data. Once connected, we saw predictions in the past (when the daily max was reached), time-zone differences between services, and CORS blocking unexpected URLs.
- Making learning visible. A model that improves quietly is invisible in a demo. So we highlight every change after a log, show the personal offset, and built a labelled demo clock to show learning live.
Accomplishments that we're proud of
- A full loop that works end to end on a real phone: log → n8n rules and prediction → live dashboard → learning from the next dose.
- Every piece of logic lives in n8n, where it's visible and easy to change. The app has none.
- Personalization that measurably beats a one-size-fits-all model, and a "why" card that explains each prediction exactly.
- Safety and privacy by design: dose limits always come from the prescription, and location never leaves the phone.
What we learned
- n8n is a real backend: webhooks, data tables, HTTP calls and Code nodes made it possible to keep all the logic visible and easy to change.
- A simple model with personalization can beat a single "average" model, and it's explainable. We can tell a patient why the heads-up came earlier.
- Good features come from asking "would we actually have this number at the moment the patient takes a dose?" Restricting the model to data we can really collect made it simpler, more honest, and easier to explain.
- Privacy and safety are design decisions, not add-ons: compute on the device, send the minimum, and never let a prediction override a prescription.
What's next
- A summary for the care team, shared only with the patient's approval, so prescribers can adjust doses based on real patterns
- A pilot with a hospital or health authority for patients discharged with as-needed pain medication, measuring pain scores, doses taken and follow-up calls
- Validation with real, consented, de-identified data, plus clinical and regulatory review
- Reading the patient's own words: the pain log already takes a free-text note ("after stairs"). A language model could turn those notes into model features, as in recent hospital research
- Logging the scheduled medication, multiple medications, and calendar sync for appointments
⚠️ Hackathon demo with synthetic data. All patients and medications ("DemoRelief", "Baselinol") are fictional. Not medical advice.
Team
Reagan Chicoine · Hamza Riaz
Disclosures
- n8n Cloud: all workflows and data storage (Data Tables)
- React + Vite: built from the official
create-viteReact template; vite-plugin-pwa for installing on phones - Vercel: hosting the app
- Open-Meteo: live weather data
- scikit-learn: model training
- Claude Code (Anthropic): AI coding assistant used while building
- Data: all synthetic; patients and medications ("DemoRelief", "Baselinol") are fictional
Sources
- Bang YH et al. "Clinical relevance of deep learning models in predicting the onset timing of cancer pain exacerbation." Scientific Reports 13:11501, 2023. https://pmc.ncbi.nlm.nih.gov/articles/PMC10352236/
- Homdee N et al. "The influence of ambient environmental factors on breakthrough cancer pain." BMC Palliative Care 23:62, 2024. https://pmc.ncbi.nlm.nih.gov/articles/PMC10908209/
- "AI-Driven Prediction of Cancer Pain Episodes: A Hybrid Decision Support Approach." arXiv:2512.16739, 2025 (preprint). https://arxiv.org/abs/2512.16739
- Brummett CM et al. "New Persistent Opioid Use After Minor and Major Surgical Procedures in US Adults." JAMA Surgery, 2017. https://pubmed.ncbi.nlm.nih.gov/28403427/
- CCSA / CISUR, Canadian Substance Use Costs and Harms (2020 data). https://www.ccsa.ca/lost-productivity-due-substance-use-cost-canadian-economy-224-billion-new-report
Built With
- anthropic
- elevenlabs
- javascript
- n8n
- open-meteo
- pwa
- pyton
- react
- react-native
- scikit-learn
- vercel
- vite

