Inspiration
Path of lowest resistance from VERY orthogonal beginnings in webAR, 3dgraphics, webdev, web-scraping, news-sentiment, text-parsing, moby-dick-markov-chain-generating-java, ...
What it does
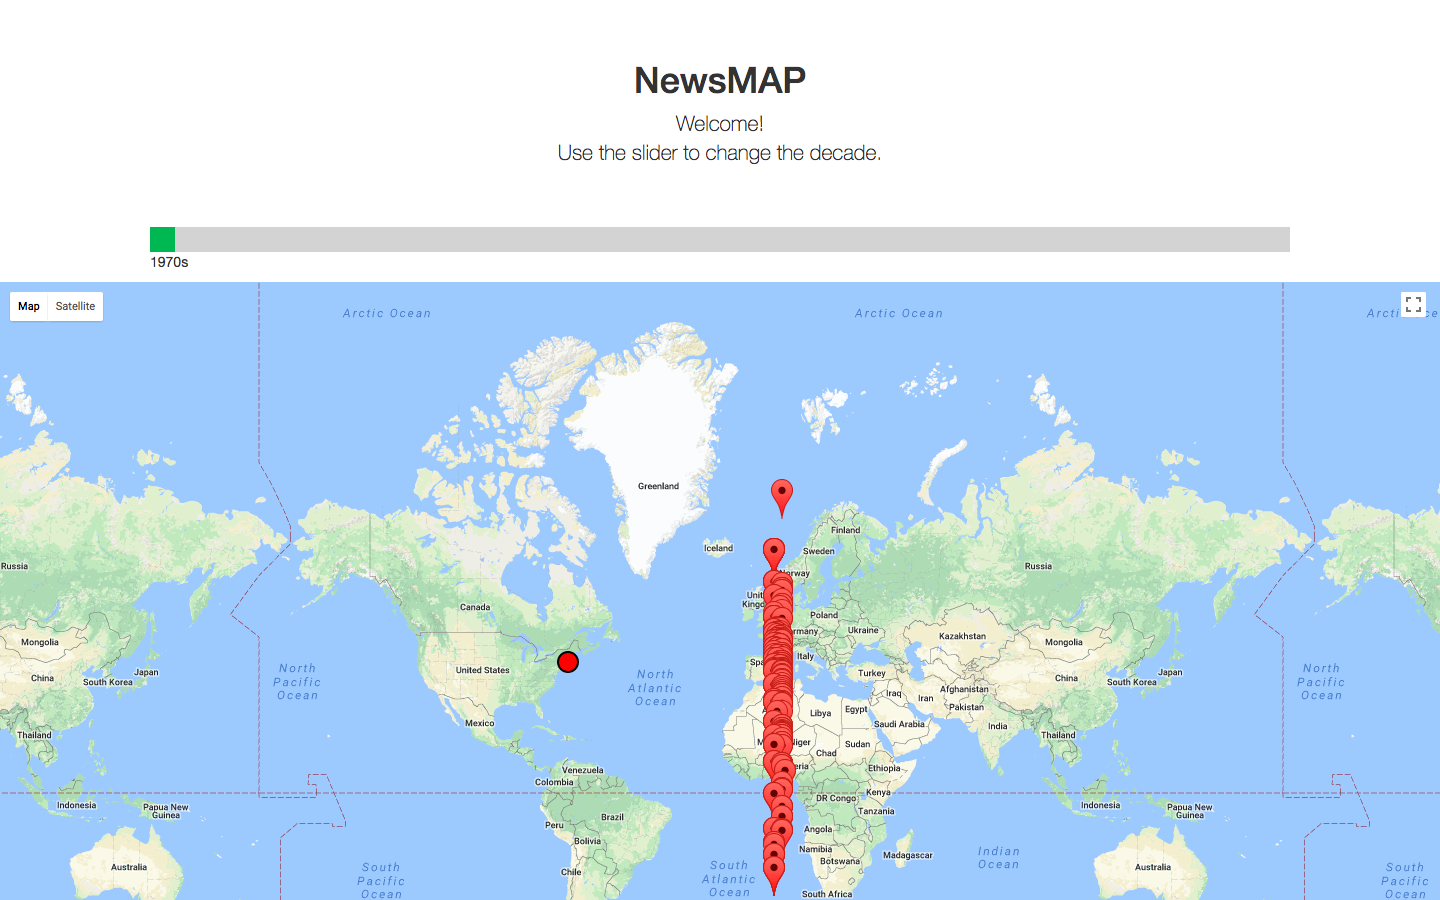
Incorrectly displays (not quite) event location data from one latitude, randomly sampled, from ~7 GB from The GDELT Project (Google).
How I built it
Wrote program to convert plain text to json (incorrectly), cntrl-f-search-replace-all regex with Sublime (GB>>), shove it into JavaScript and find lots of bugs we haven't overcome.
Challenges I ran into
Lack of implementable ideas, leading to path of lowest resistance (data -> visualization).
Accomplishments that I'm proud of
We use git and actually, maybe, will have a working website in a couple weeks (this was hacked together in <5 hrs).
What I learned
Union of all learnings across team members: reading API docs, HTML/CSS/JS, web-scraping, markov-chains, json, google maps api, a ton of text parsing (5>> GB).
What's next for newsMap
Actually making it work.
Built With
- 3dprinting
- b
- bash
- bootstrap
- c
- css3
- d
- e
- english
- f
- github
- google-maps
- html5
- itunes
- java
- javascript
- json
- markov-chains
- python
- raspberry-pi
- sqlite
- stl
- thoughtaboutperl
- web-scraping
- webar

Log in or sign up for Devpost to join the conversation.