News has become ubiquitous but discerning the credibility of the news article can often be challenging. Many times it becomes necessary to sort factual material from opinions and to recognize the source of the evidence, together with being aware of the potentially omitted information.
I decided to create a tool which would allow people to process all this information without merely branding the article as “true” or “false”. This is how my idea for NewsLens came up.
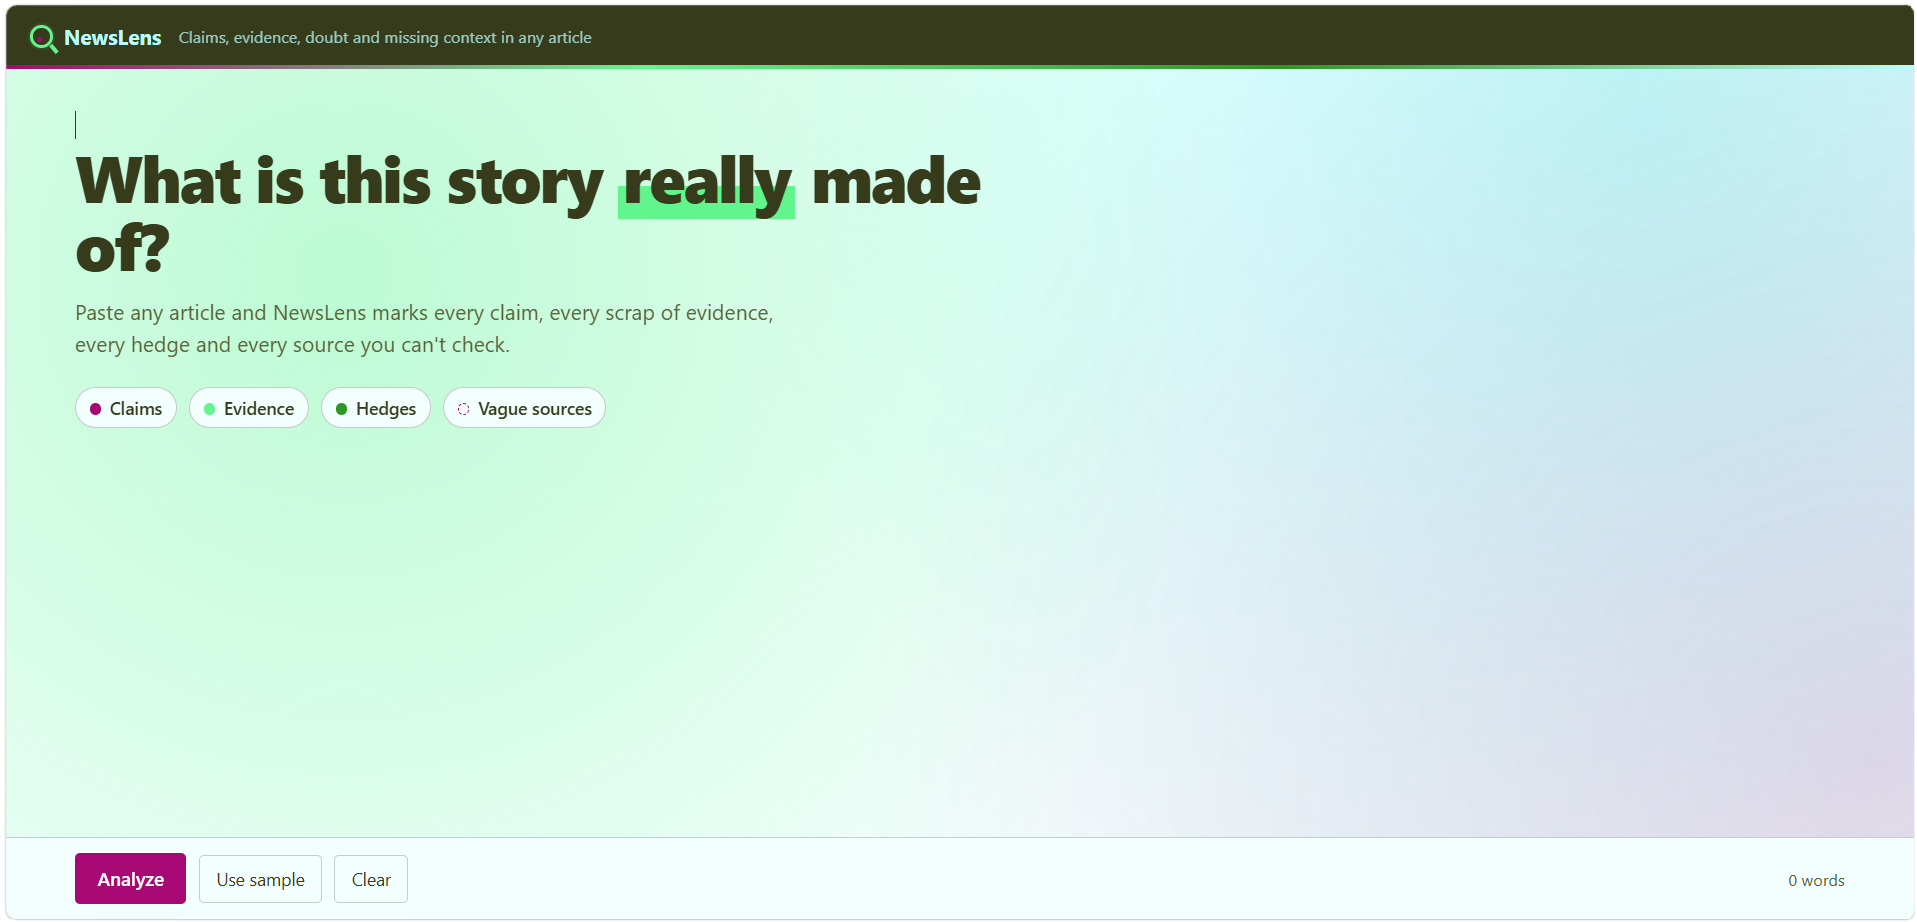
NewsLens allows users to upload articles in order to analyze the material and recognize the claims, evidence, doubtfulness, and gaps in the context. The program identifies all claims and evidences within the text, as well as detects all elements of hedging, expresses certainties, and idiotic causal relationships. The outcomes of the analysis are sorted into several sections to provide users with simple navigation, and a quick overview of the subject matter of the article, as well as its support, challenges, and further questions.
I used only the following technologies to make NewsLens: HTML CSS and JavaScript with no framework or external backend. HTML defines the structure while CSS is responsible for the visual design responsive layout and animations. JavaScript conducts the text analysis and produces the results dashboard. I implemented rules for detection based on patterns to check linguistic indicators such as numbers causal words predictions absolute expressions evidence language and references. The project was divided into index.html styles.css and script.js for structural design and functionality to remain separate and easy to manage.
A significant challenge was analyzing natural language using comparatively simple methods. The same word may mean different things in different situations. Another difficulty was representing tons of analysis data without overwhelming the interface. I had to create a dashboard where users can see the results quickly and also return to the original text to check where it comes from.
I am satisfied with the fact that I created an analytical experience that is somehow interactive, instead of just an analytical report. The users can view different analysis results by clicking through them. I also developed different visual symbols for the categories of argumentative claims, justification, hedging, and ambiguous sources which simplifies the understanding of the analytical findings. The responsive nature of the interface makes it possible to use the system on all screen sizes, and the animations create a feeling of liveliness in the analysis.
In the course of my work, I discovered that analyzing news is much more complicated than simply searching for the actual information. The way of presenting information can change the way a reader understands it. I learned that different language forms can warn about the significance of the subject discussed in the article, and that the design of the interface can facilitate the understanding of the analytical results. Additionally, I realized how important it is to clearly communicate the limits of an automated analytic system.

Log in or sign up for Devpost to join the conversation.