Inspiration
It is tough these days to be able to compare political opinions and geographic impact of events happening in the world.
What it does
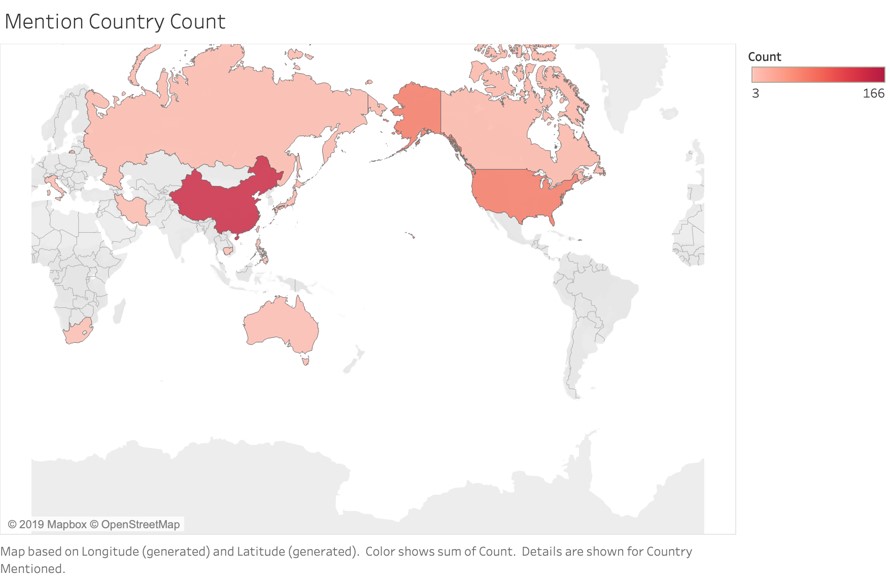
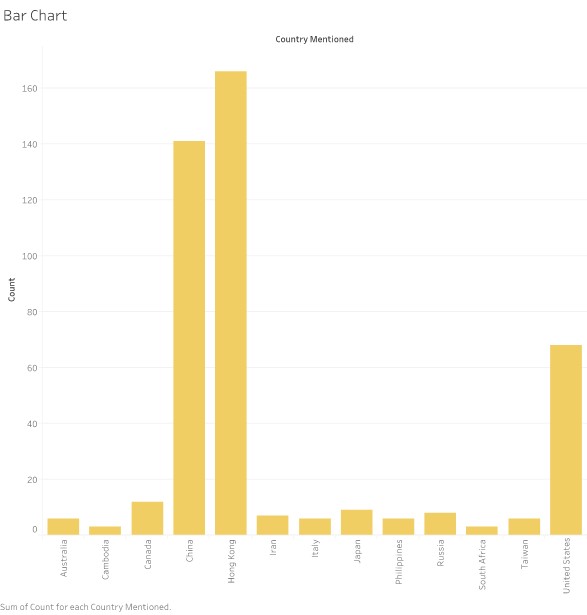
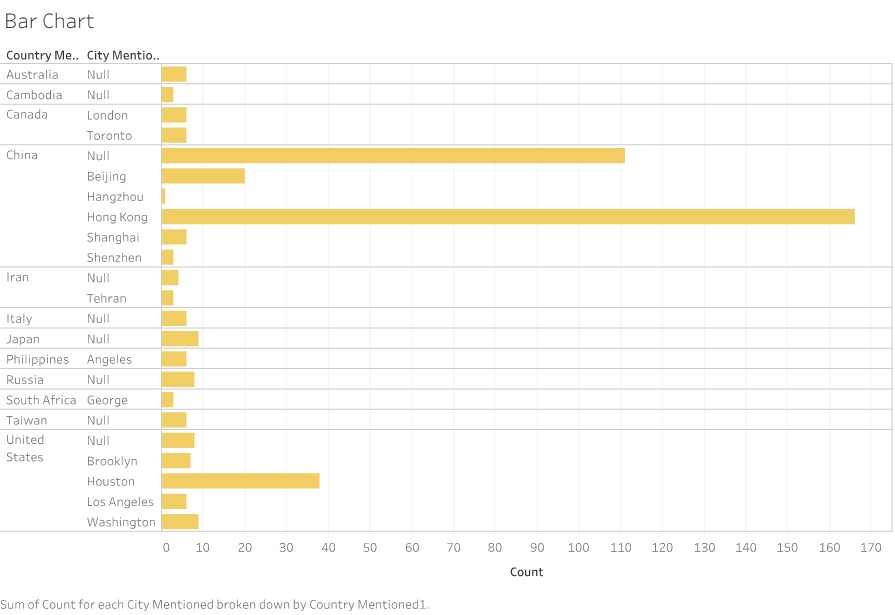
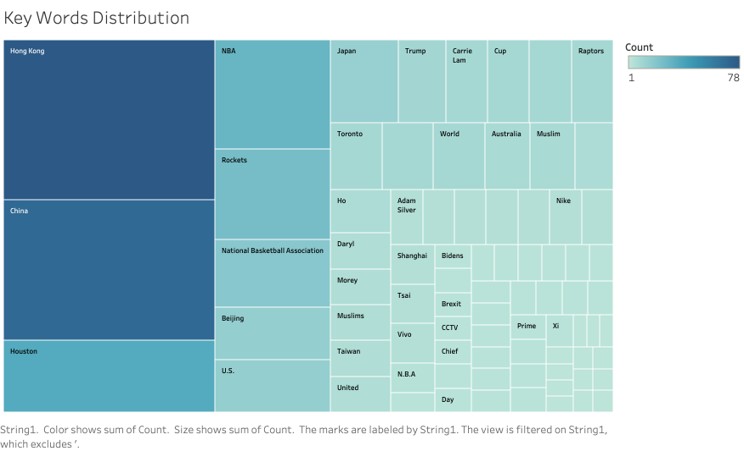
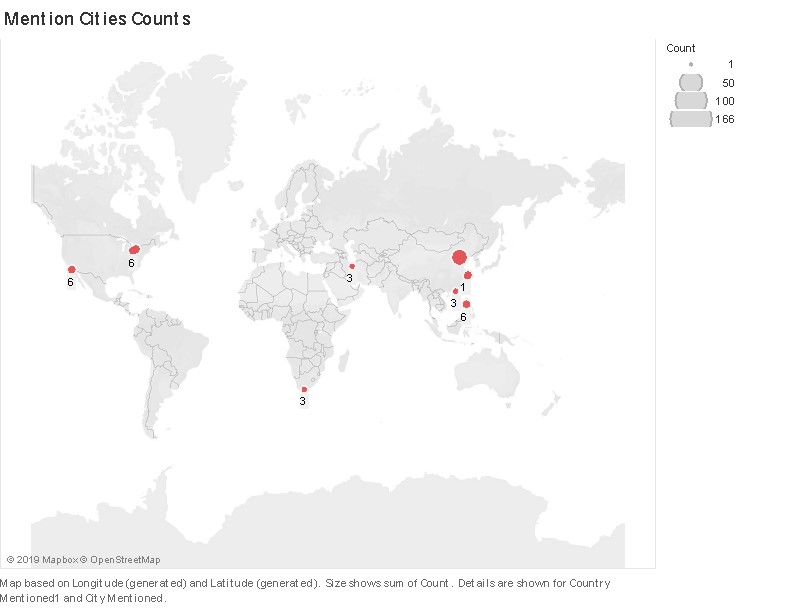
We want to visualize how an event has connected or impacted the world. We also want to look at the opinions of these news articles to hopefully be able to compare them side by side.
How we built it
we use NYTimes API to query articles and parse text to analyze location and topic. If given more time, we would like to include API's from other news sources as well
Challenges we ran into
We had a lot of trouble figuring out how to run our crawler from our web page. At this point, we had figured out how to use javascript to obtain a python file but we don't have the tools to run the file. Our original idea was to use javascript to run a python script, grab the data and put it into tableau, then obtain the necessary graphics to display on the html page. These graphics can be found in the graphics folder of the main hackathon directory.
Accomplishments that we're proud of
We are proud to have automated the extraction of numerous tokens and their relevant semantics from NYT times API.
What we learned
Necessary steps needed to string together different functions written in different languages into a working application. Learned how to use NYT API
What's next for NewLinked
We hope that, in the future, we can be more prepared with the tools we need in order to reach our goal.

Log in or sign up for Devpost to join the conversation.