-
-
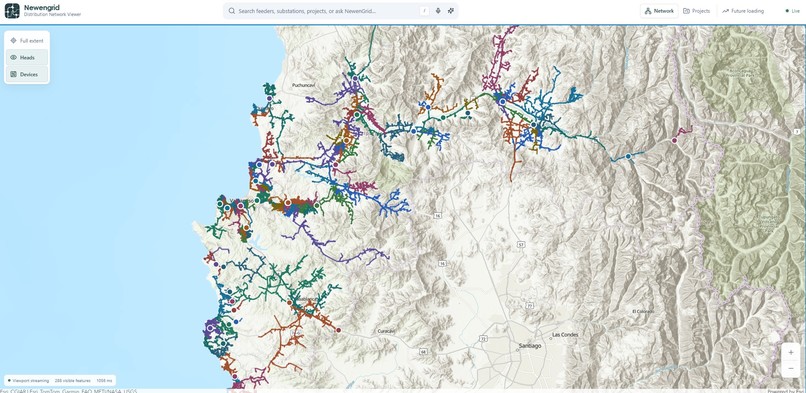
MV Valparaíso Region
-
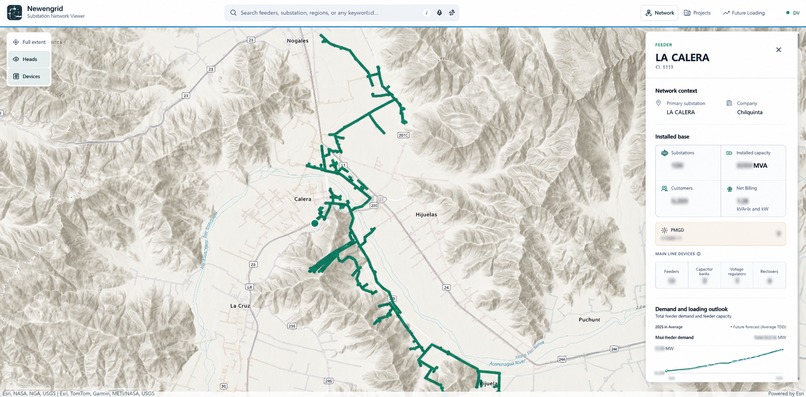
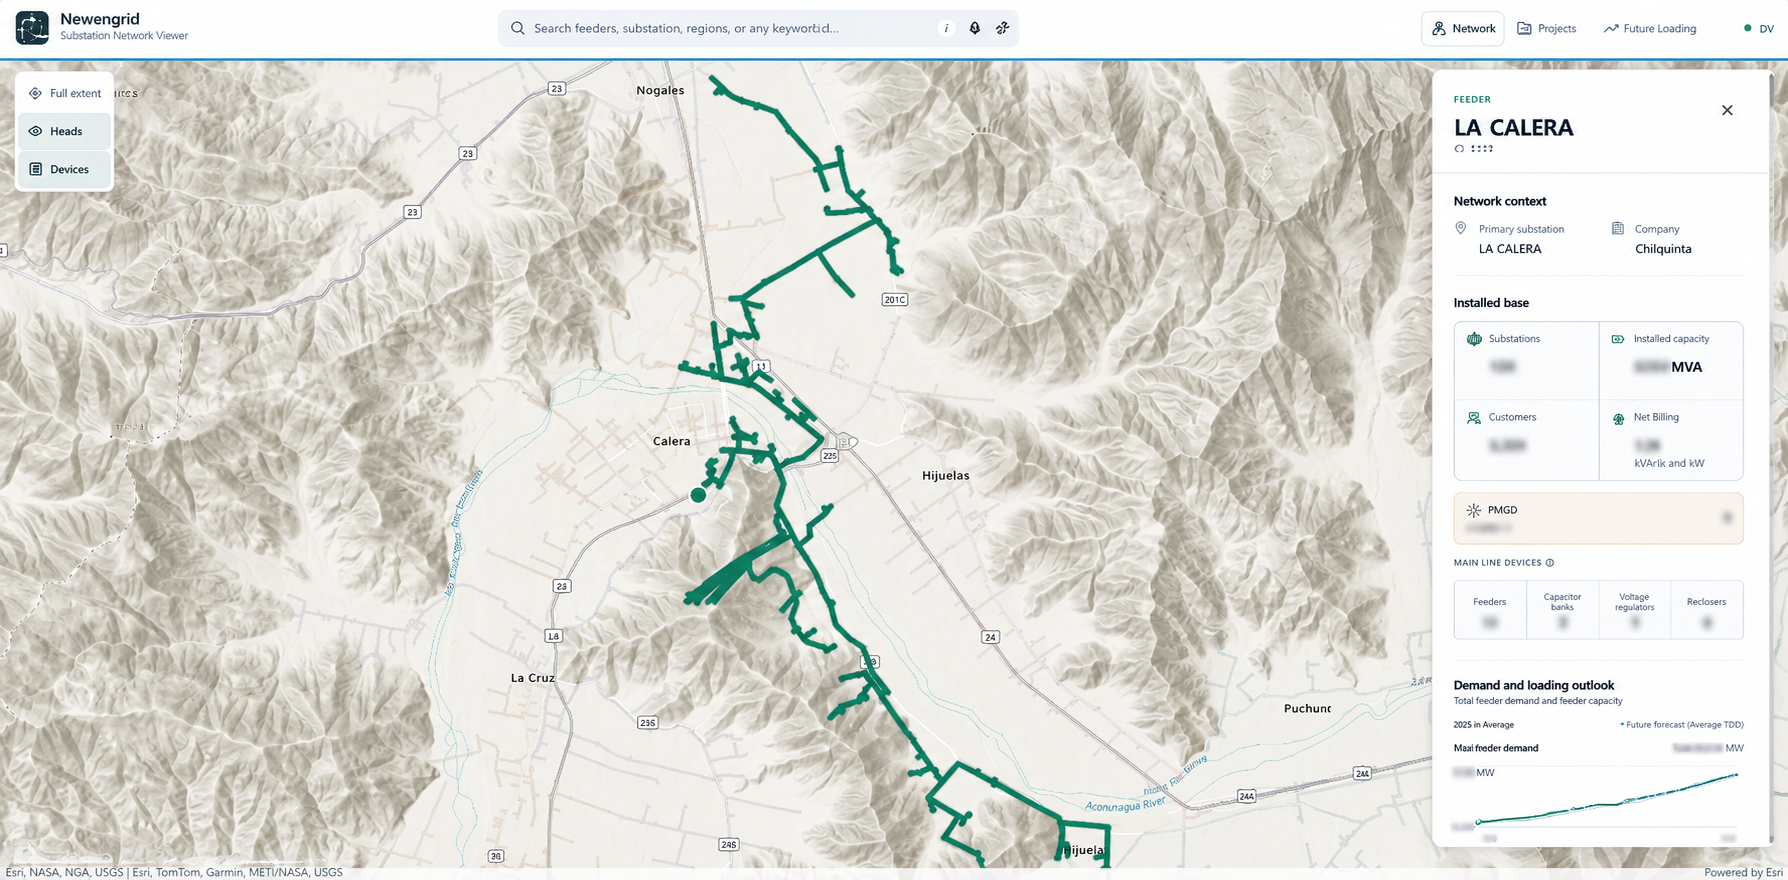
La Calera feeder card
-
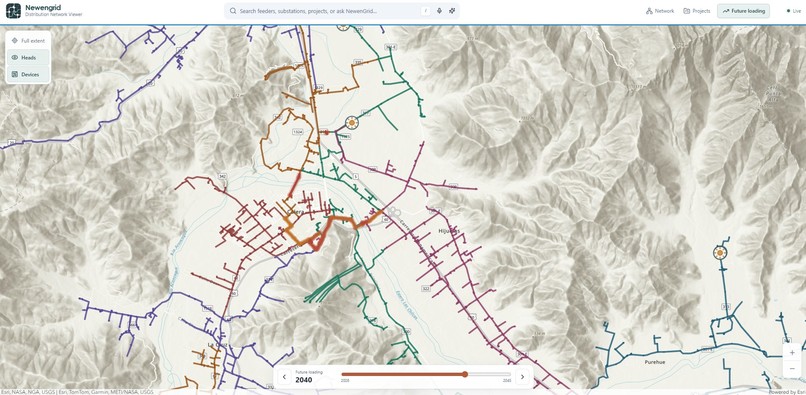
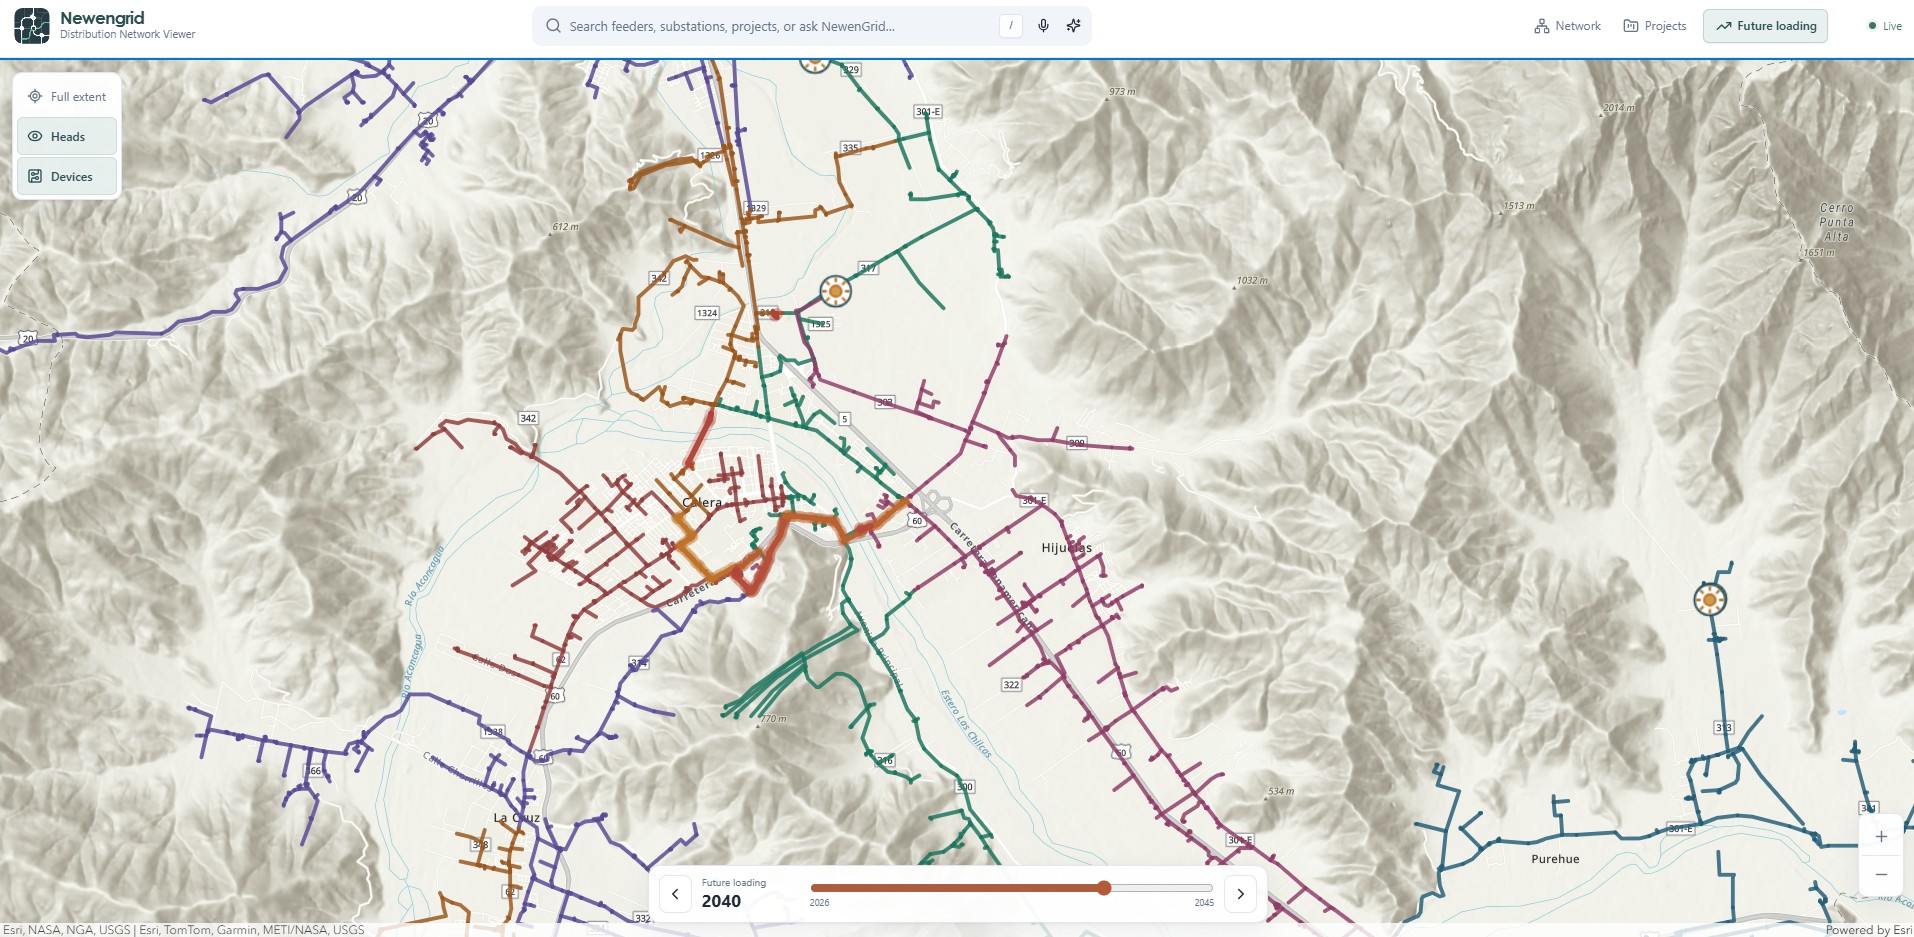
La Calera substation loading forecast
Inspiration
Distribution network planning requires deep electrical analysis, simulations, large datasets, and a necessary touch of reality.
It is not enough to identify that the grid needs a project. We also need to understand where it is needed, why it is needed, how it is progressing, and eventually communicate that need clearly to the operational areas responsible for turning the project into reality.
During the planning stage, project ideas, their justification, status, and modifications are usually delivered in several legacy formats: PDFs, Excel files, ppt, maps screenshoots, and other documents created to explain where the project is located and what it is supposed to solve.
At this point, we are not yet working with final engineering blueprints. We are working at a pre-engineering stage; hence the context is more important that the specifics.
As Head of Planning at one of Chile’s major electric utility companies, I have always wanted a better way to communicate the real needs of the grid. I also wanted a way to capture feedback from the field and make that information visible to the rest of the company.
The idea is similar to pushing a branch in software development: when a project changes, that change should be reflected immediately in one shared platform, rather than being redistributed through several new versions of files.
We envisioned a local, company-wide web application where planning, operations, engineering, and construction teams could see the same version of the grid and its projects. Something closer to a Palantir-style platform, but built specifically for distribution network planning.
That is how we came up with NewenGrid.
Newen comes from Mapudungun, the language of the Mapuche people, and is associated with strength, energy, and force. It felt like the right name for a platform built around the electrical grid.
What it does
NewenGrid displays the medium-voltage electrical network of the company’s concession areas, including major grid devices such as fuses, reclosers, capacitor banks, step-voltage regulators, and autotransformers.
All this information is loaded into a fast, interactive map.
The platform currently supports three core functions.
Grid context
Users can select a feeder and focus the entire interface on that network.
Once a feeder is selected:
- The map isolates it and fades the rest of the grid.
- The user can press
Enterto zoom into the feeder. - A feeder card appears with a broad summary of its current state.
The card includes information such as:
- Installed capacity
- Number of customers
- Major medium-voltage devices
- Loading indicators
- Reliability and quality indices
- Related projects
The objective is to provide immediate operational and planning context without requiring users to search through several databases or reports.
Grid projects
This is the main purpose of NewenGrid.
The platform shows where investment projects are located in the network, what their scope is, which feeders they affect, and how they are progressing.
Projects may include:
- Network reinforcements
- New extensions
- New equipment
- Feeder transfers
- Topology changes
- Switching operations
Each project has its own card containing its current stage, category, expected dates, physical progress, financial progress, budget, related feeders, and individual project parts.
Instead of reading a project description in a spreadsheet and then trying to locate it manually, users can see the project directly on the grid.
Grid forecasting
Future loading is generally calculated using specialized electrical simulation software. However, the results are often only accessible to the people who know how to operate that software.
NewenGrid brings those results into the map.
Projected loading data is associated with network elements and displayed through a time slider. As the user moves further into the future, the network gradually changes according to its projected loading.
The more constrained sections become increasingly visible, allowing the user to understand where future grid needs will emerge.
The idea is to turn simulation results into something that can be read by a wider audience, not only by power-system specialists.
How we built it
We started from the relational datasets used to describe the distribution network and transformed them into a geographic model.
The source information includes:
- Network nodes
- Line segments
- Feeder source points
- Feeder master data
- Medium-voltage equipment
- Reliability indicators
- Investment projects
- Future loading projections
The backend was built in Python using FastAPI, DuckDB, Pandas, and PyArrow.
The frontend was built with React, TypeScript, Vite, the ArcGIS Maps SDK, Zustand, and TanStack Query.
One of the most important architectural decisions was to avoid loading the entire network into the browser.
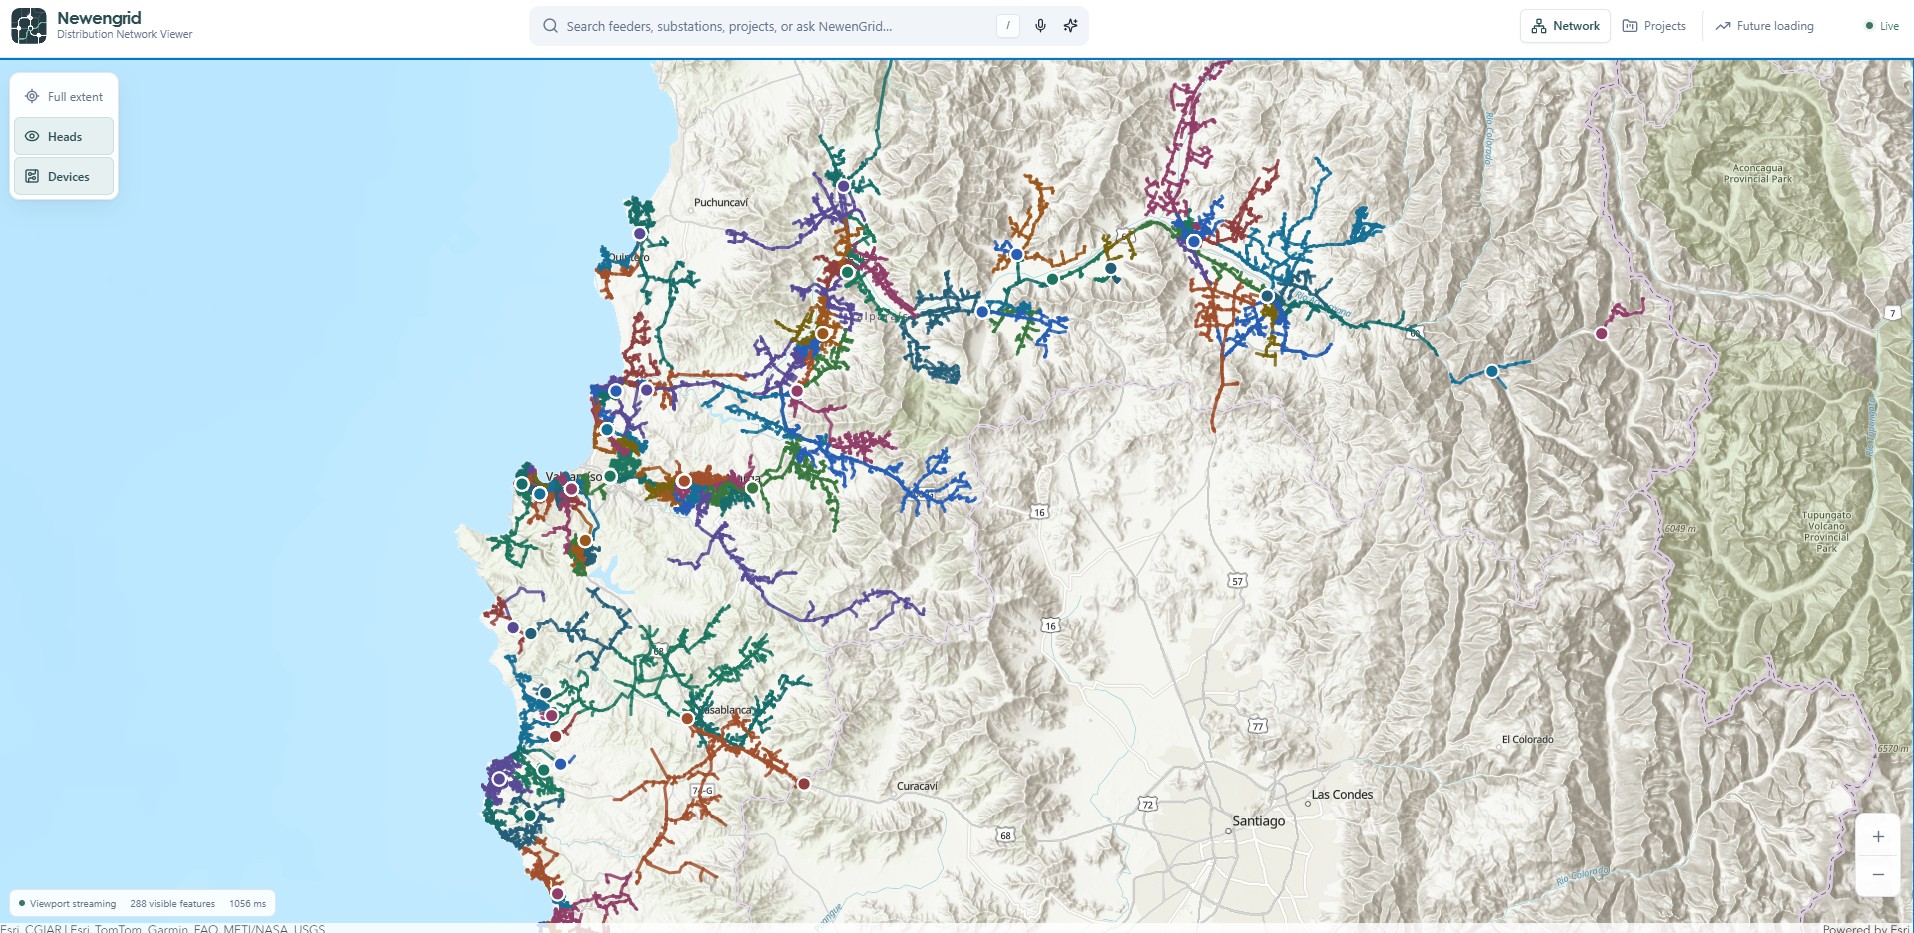
NewenGrid only requests and renders the network features that are currently visible inside the active map viewport. Every time the user pans or changes the zoom level, the application queries the backend for the relevant geographic extent.
The backend uses precomputed spatial envelopes and level-of-detail rules to return an appropriate representation of the network.
At regional zoom levels, the network is simplified. At closer zoom levels, the original line segments and devices become available.
This approach allows NewenGrid to handle hundreds of thousands of nodes and line records while still feeling responsive on a local workstation.
Projects are processed through a local ingestion pipeline and stored in the same analytical database. The project model supports multiple parts, including reinforcements, extensions, equipment, topology changes, and switching operations.
The Copilot feature was built as a natural-language command layer. The search bar can distinguish between a regular search and a longer question or instruction. The application interprets the request, queries the local data, navigates the map, and opens the relevant feeder or project card.
Challenges we ran into
The first challenge was network performance.
In the preliminary versions, we attempted to load most of the grid at once. This made navigation slow and created unnecessary rendering pressure in the browser.
We eventually realized that the correct approach was to build an API that only streams the network features visible in the map viewport.
That decision changed the project completely. Instead of treating the network as one massive static dataset, NewenGrid now treats it as a spatial service that responds to the user’s current view.
Another challenge was the way the product was developed.
We built it in stages:
- The electrical network
- The project layer
- Future loading
- Natural-language navigation
- Project creation and editing
The project module was the most complex part.
At first, it looked simple: place projects on the map and display their information. In practice, projects can affect the network in very different ways.
A reinforcement follows existing lines. An extension creates new geometry. A new device may have an approximate installation area rather than one exact pole. A topology project may transfer an entire branch from one feeder to another.
The most difficult case was representing topology changes.
A feeder transfer cannot be represented only by placing a marker on the map. The application must understand which switching devices open or close, which branch is transferred, which feeder supplies it in the future, and whether any part of the network becomes isolated.
We are still developing this logic, but the project forced us to think about NewenGrid not only as a viewer, but as a future network-modeling environment.
Accomplishments that we're proud of
NewenGrid is already fast and usable on a local network.
A small group of users can interact with the platform at the same time, which is sufficient for the current planning and review use case.
The map navigation feels smooth, the network is readable, and the application can move between feeders, projects, and future-loading scenarios without forcing the user to understand the underlying database.
We are particularly proud of the search and Copilot experience.
The same search bar can handle both direct searches and natural-language questions. It detects when the input is no longer a simple entity name and should instead be interpreted as a command.
Users can ask questions such as:
- “Does La Calera feeder have active projects?”
- “Which feeder has the highest projected loading?”
- “Take me to the feeder with the most reclosers.”
- “Show me the next project expected to be completed.”
The application then answers through both text and actions: it navigates the map, selects the relevant asset, and opens the corresponding information card.
We are also proud that we were able to build a working MVP during Build Week. Without the support of OpenAI and the credits granted we would have not have found the time and resources to develop this.
What we learned
Sol showed tremendous capabilities during the first stages of development.
We had attempted similar concepts in the past, but Sol was able to create the initial architecture and product foundations from one detailed strong oneshot prompt.
After that first foundation, most of Build Week was spent working with Terra to refine the application, correct interactions, improve the data model, and implement more complex features.
We already have a large amount of useful information, but NewenGrid made it clear that future data must arrive with better structure and consistency.
The grid changes. Projects change. Loading projections change. Reliability indicators change. New equipment is installed. Existing elements are replaced.
All those updates require reliable ingestion pipelines.
During the MVP, we were able to place datasets in the repository and let Codex inspect and transform them. That was acceptable for Build Week, but it is not a sustainable production process.
The next stage requires formal data contracts, consistent identifiers, validation rules, version control, and dedicated ingestion processes.
We also learned that the most valuable AI contribution is not necessarily generating long answers. In this application, the most useful behavior is understanding what the user wants and translating it into actions inside the map.
The AI becomes a command layer for the grid.
What's next for NewenGrid
There are several major areas we want to develop next.
Formal data ingestion and governance
The first priority is to refine the data-ingestion pipelines and establish clear internal data policies.
Once the inputs are stable, NewenGrid can be deployed on an internal server and continuously updated with:
- Network changes
- New projects
- Project progress
- Loading projections
- Reliability data
- Device information
For basic and known queries, we also intend to evaluate local language models so the platform can operate inside the company’s own infrastructure.
Project creation directly in the platform
At the moment, many projects are still loaded from Excel files.
The next step is to make NewenGrid the primary tool for creating and editing projects.
Users should be able to:
- Create a project
- Draw an extension
- Select a reinforcement corridor
- Place new equipment
- Define an installation band
- Modify the project description or budget
- Update progress
- Simulate topology changes
This would be significantly easier and safer than maintaining several versions of spreadsheets.
Integration with PowerFactory
The distribution network is already geographically modeled and linked to technical information.
The next major step is to connect the backend with PowerFactory, one of the industry standards for electrical-system simulation.
This would allow NewenGrid to answer questions such as:
- What is the voltage at this pole if a new demand is added?
- Which transformer becomes overloaded under this scenario?
- What happens if this feeder is transferred?
- Which projects solve a particular constraint?
- What is the expected loading five or ten years from now?
The objective is not to replace specialized simulation software, but to make its results more accessible inside a shared planning environment.
Failure and incident data
We also have access to datasets describing network failures, including:
- Vehicle impacts
- Damaged poles
- Vegetation contact
- Equipment failures
- Weather-related incidents
- Other events that trigger grid operations
By integrating this data into NewenGrid, we could identify recurring failure patterns and analyze which types of investment projects could reduce those incidents.
This would connect planning, reliability, operations, and investment decisions in one spatial platform.
Network understanding and topology simulation
Today, NewenGrid can display the grid, but it does not yet fully understand its electrical behavior.
For example, a user can select a device and mark it as open, but the application does not yet automatically determine which downstream areas become de-energized.
That logic can be internalized.
By representing the distribution network as a graph, NewenGrid could:
- Understand connectivity
- Determine energized and de-energized sections
- Detect islands
- Identify feeder transfers
- Simulate switching operations
- Calculate which lines and customers are affected
- Compare current and future topology
This would transform NewenGrid from a network viewer into an interactive planning and topology-analysis platform.
Chile has set an ambitious target for 2035: reducing the average annual interruption time to four hours (SAIDI). There is still a long way to go, especially as high-impact, low-probability events become increasingly frequent. Meeting this target will require greater investment, deeper analysis, and better coordination across the organization to ensure that every project is directed to where the grid needs it most. NewenGrid is our attempt to make that challenge visible, understandable, and actionable.
Built With
- duckdb
- fastapi
- python
- typescript


Log in or sign up for Devpost to join the conversation.