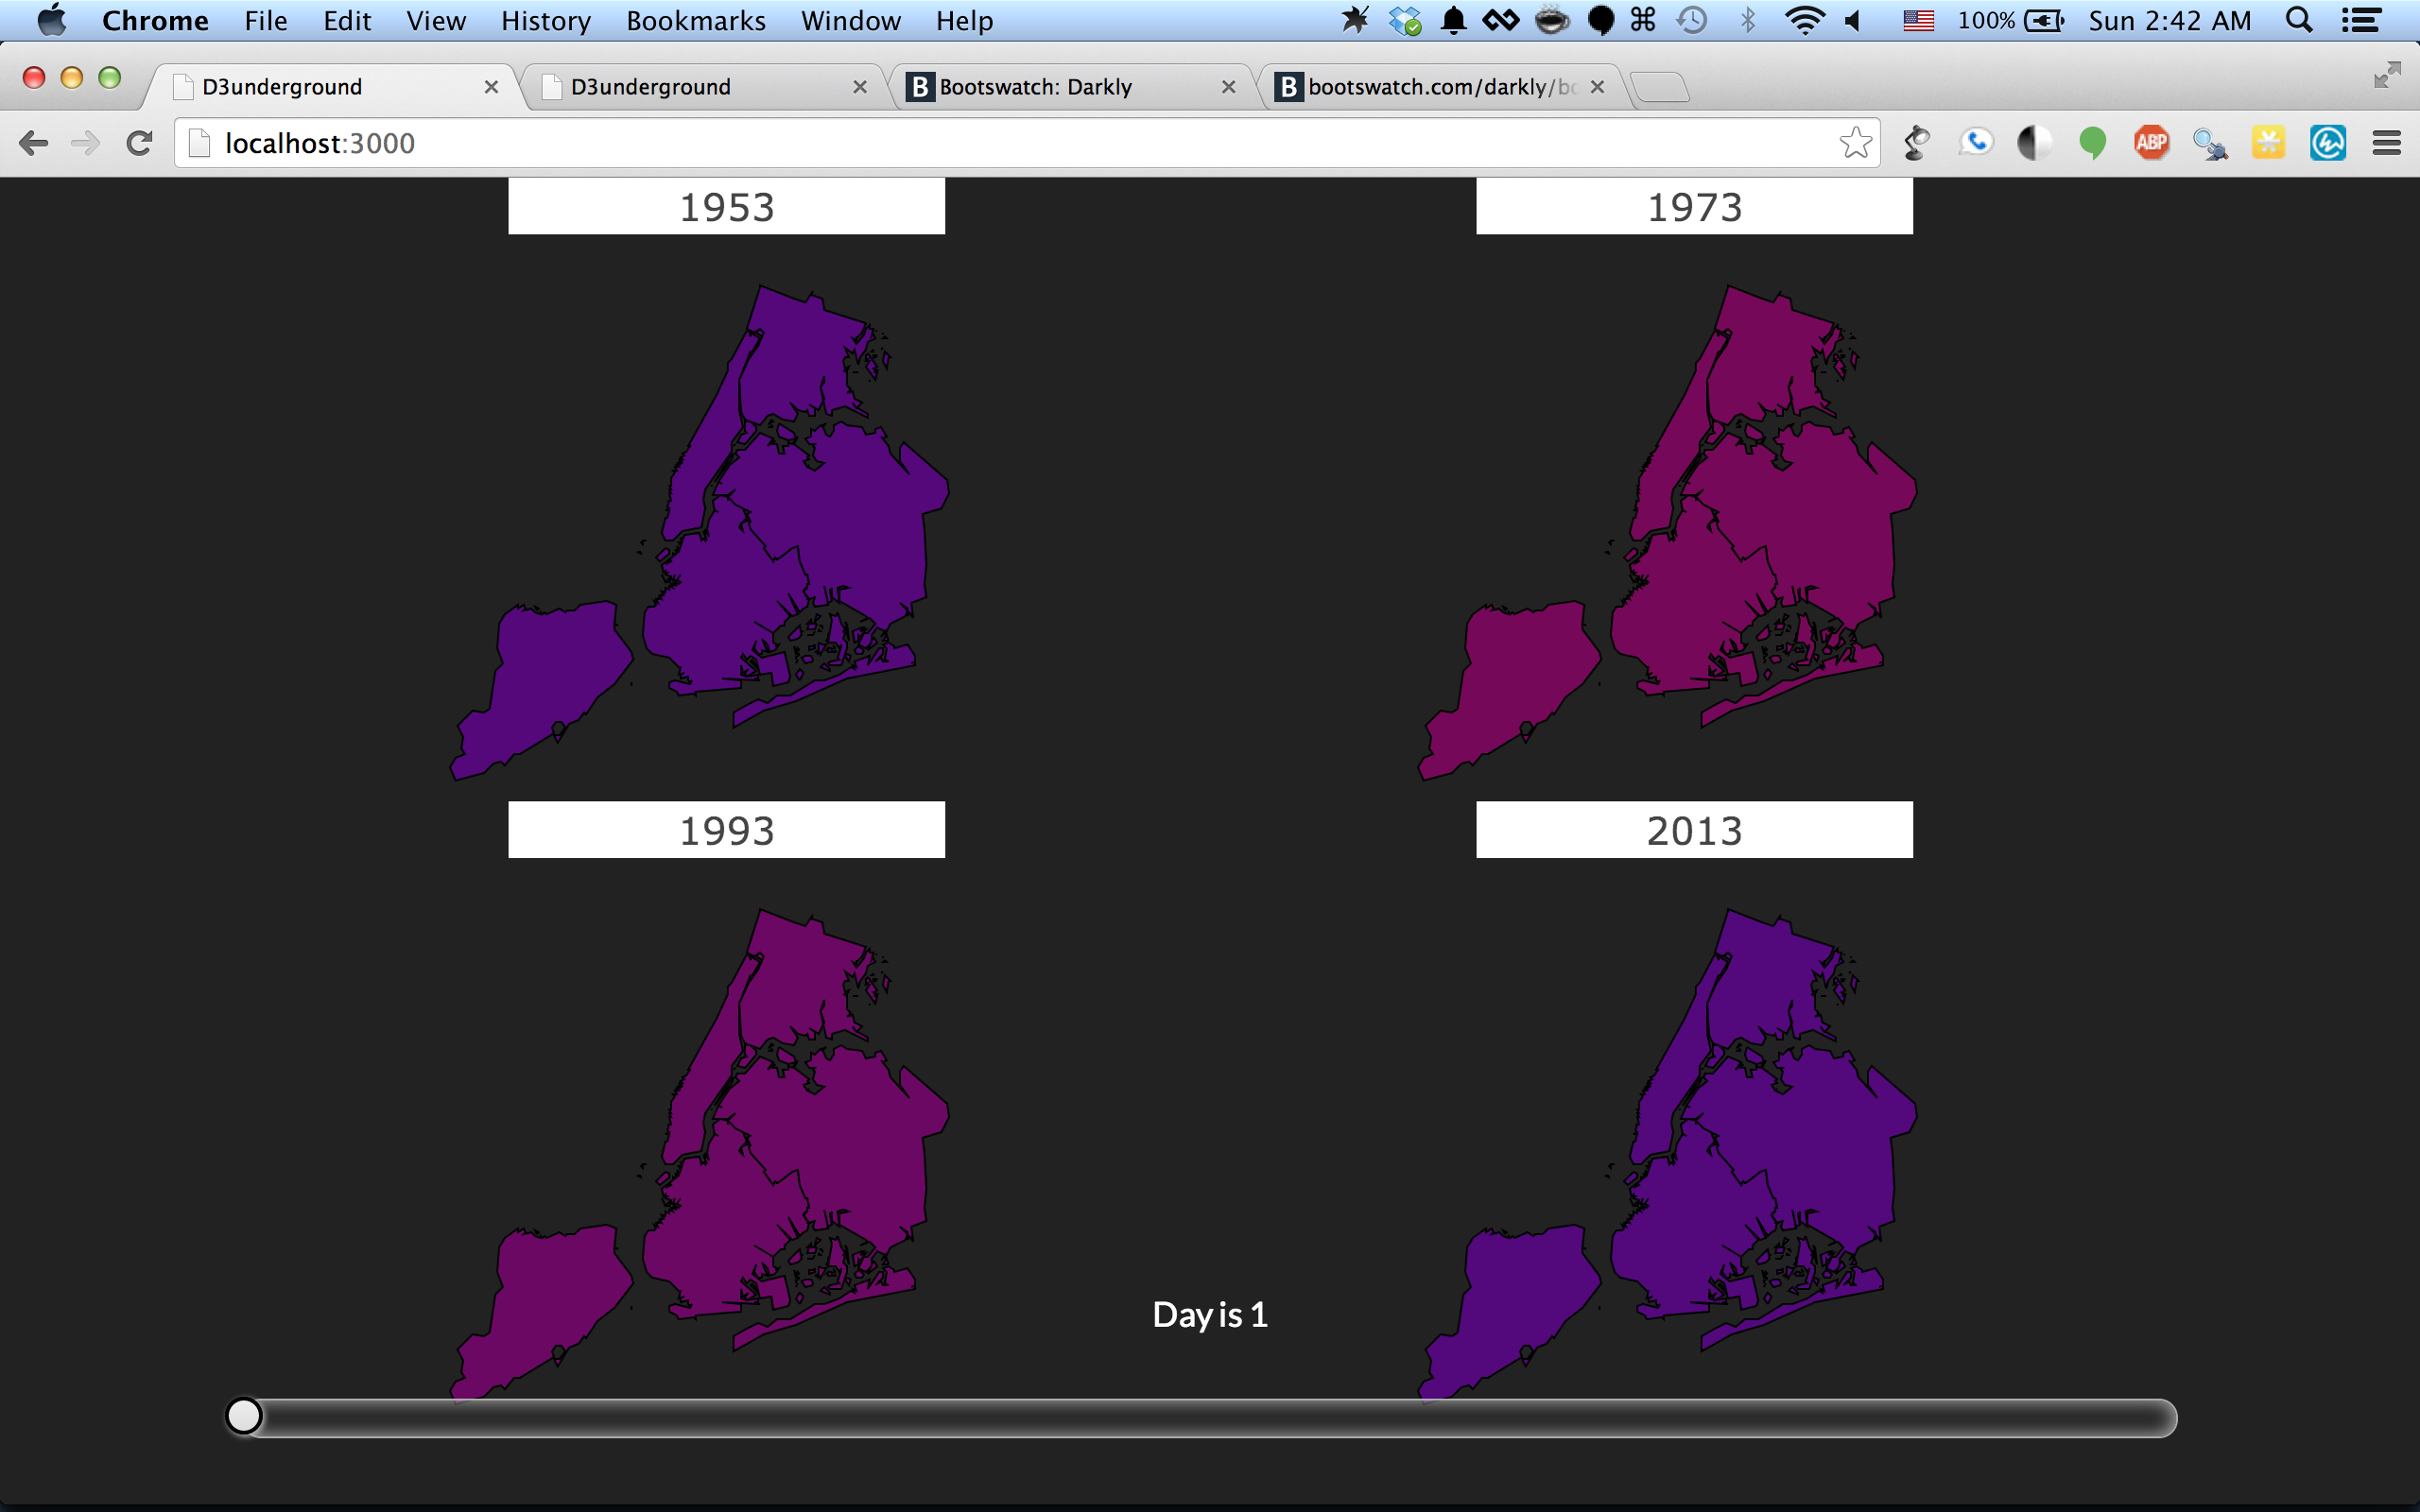
Our app lets you visualize the changes in average temperature over months and years in New York history. Historical temperature data is collected via the Wunderground API and then overlaid on maps generated via the ESRI ArcGIS Javascript API.
New York Warming
Visualize how the temperature of New York has changed since 1950
Updates

Leave feedback in the comments!
Log in or sign up for Devpost to join the conversation.