
What it does
We provide an easy visualization for people to see the City of New Brunswick's financial revenues and spending.
How we built it
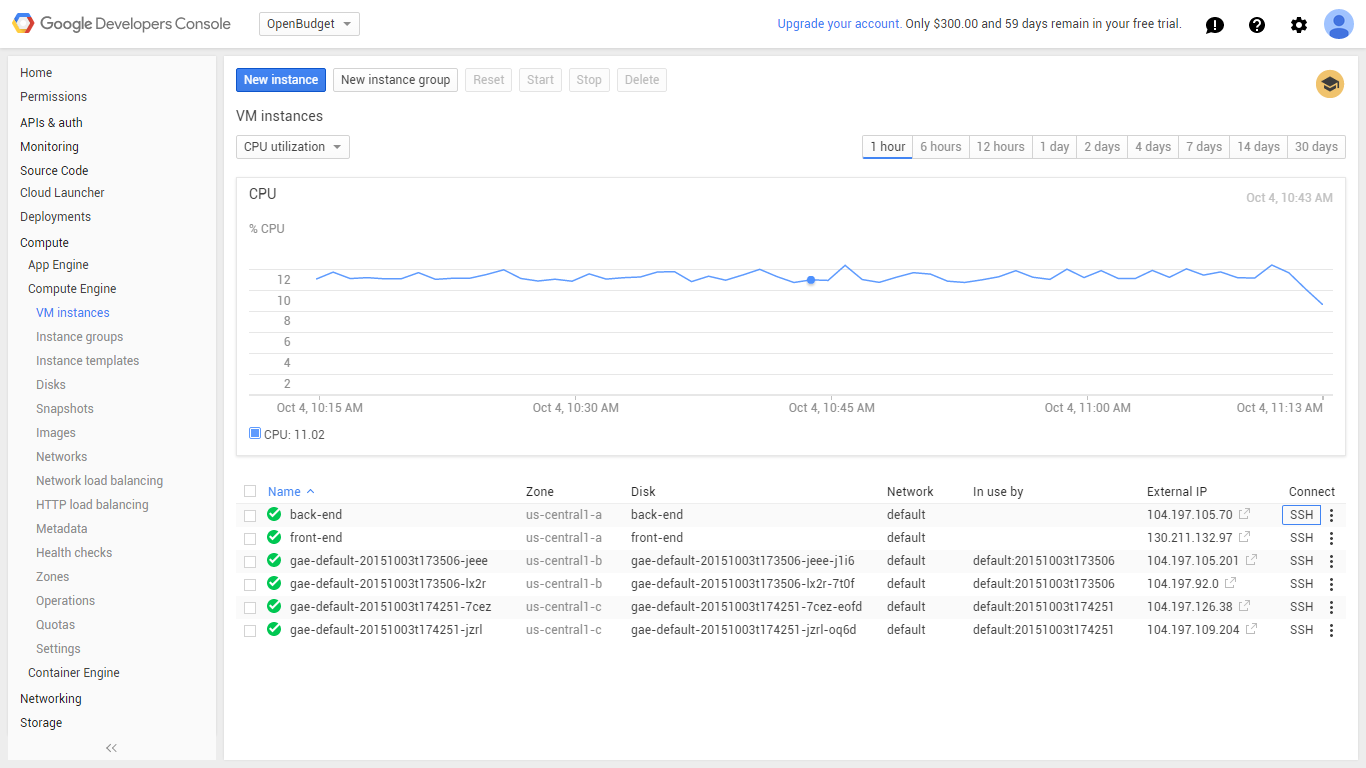
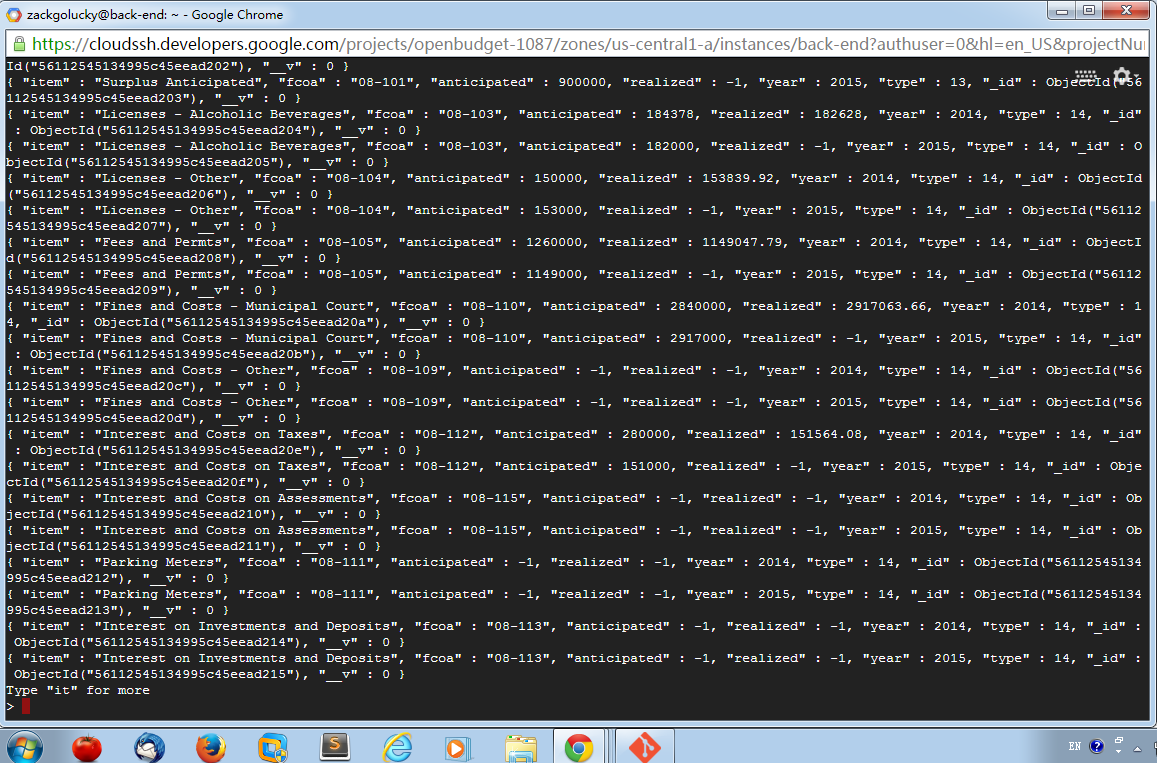
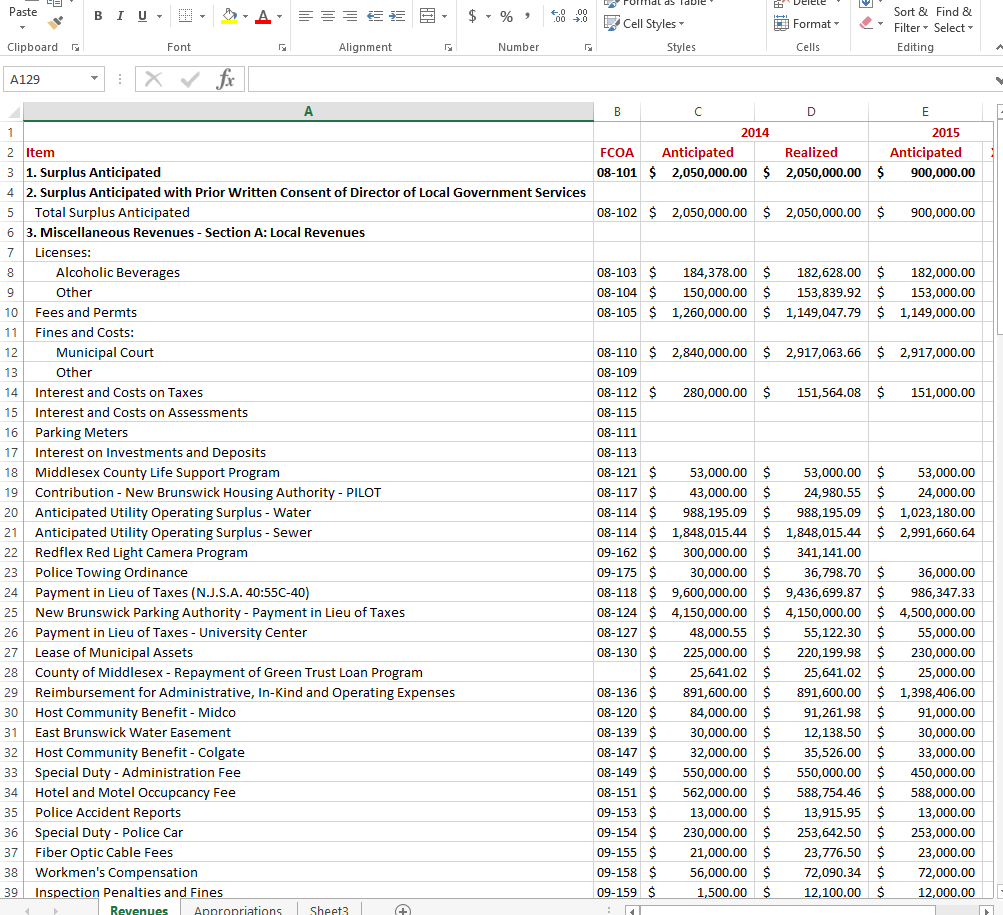
We first had to transcribe 60 pages worth of financial data regarding the city into a Microsoft Excel document. We then utilized the MongoDB to store all of the financial and relevant information in the database. Next, we needed to build the front end to our website utilizing jade in order to have a more dynamic site, and charts.js to visualize the data. We also used JQuery in order to connect the database to the front end.
What we would do with more time
We could set the graph of revenues to a logarithmic scale in order to better compare the large differences in where revenues come from. Additionally we have a database full of the information that we would have incorporated and that could be expanded in order to allow a browser to search for specific information.
What's next for New Brunswick City Financial Data Visualization
Lots of sleep.


Log in or sign up for Devpost to join the conversation.