
Inspiration
The inspiration behind NeuroX stemmed from the growing need to analyze complex brain imaging data using advanced statistical techniques. With the increasing availability of neuroimaging data, there is a significant opportunity to uncover patterns and changes in brain activity that could lead to a better understanding of neurological conditions. Our goal was to create a tool that simplifies this process, making it accessible to researchers and clinicians alike.
What it does
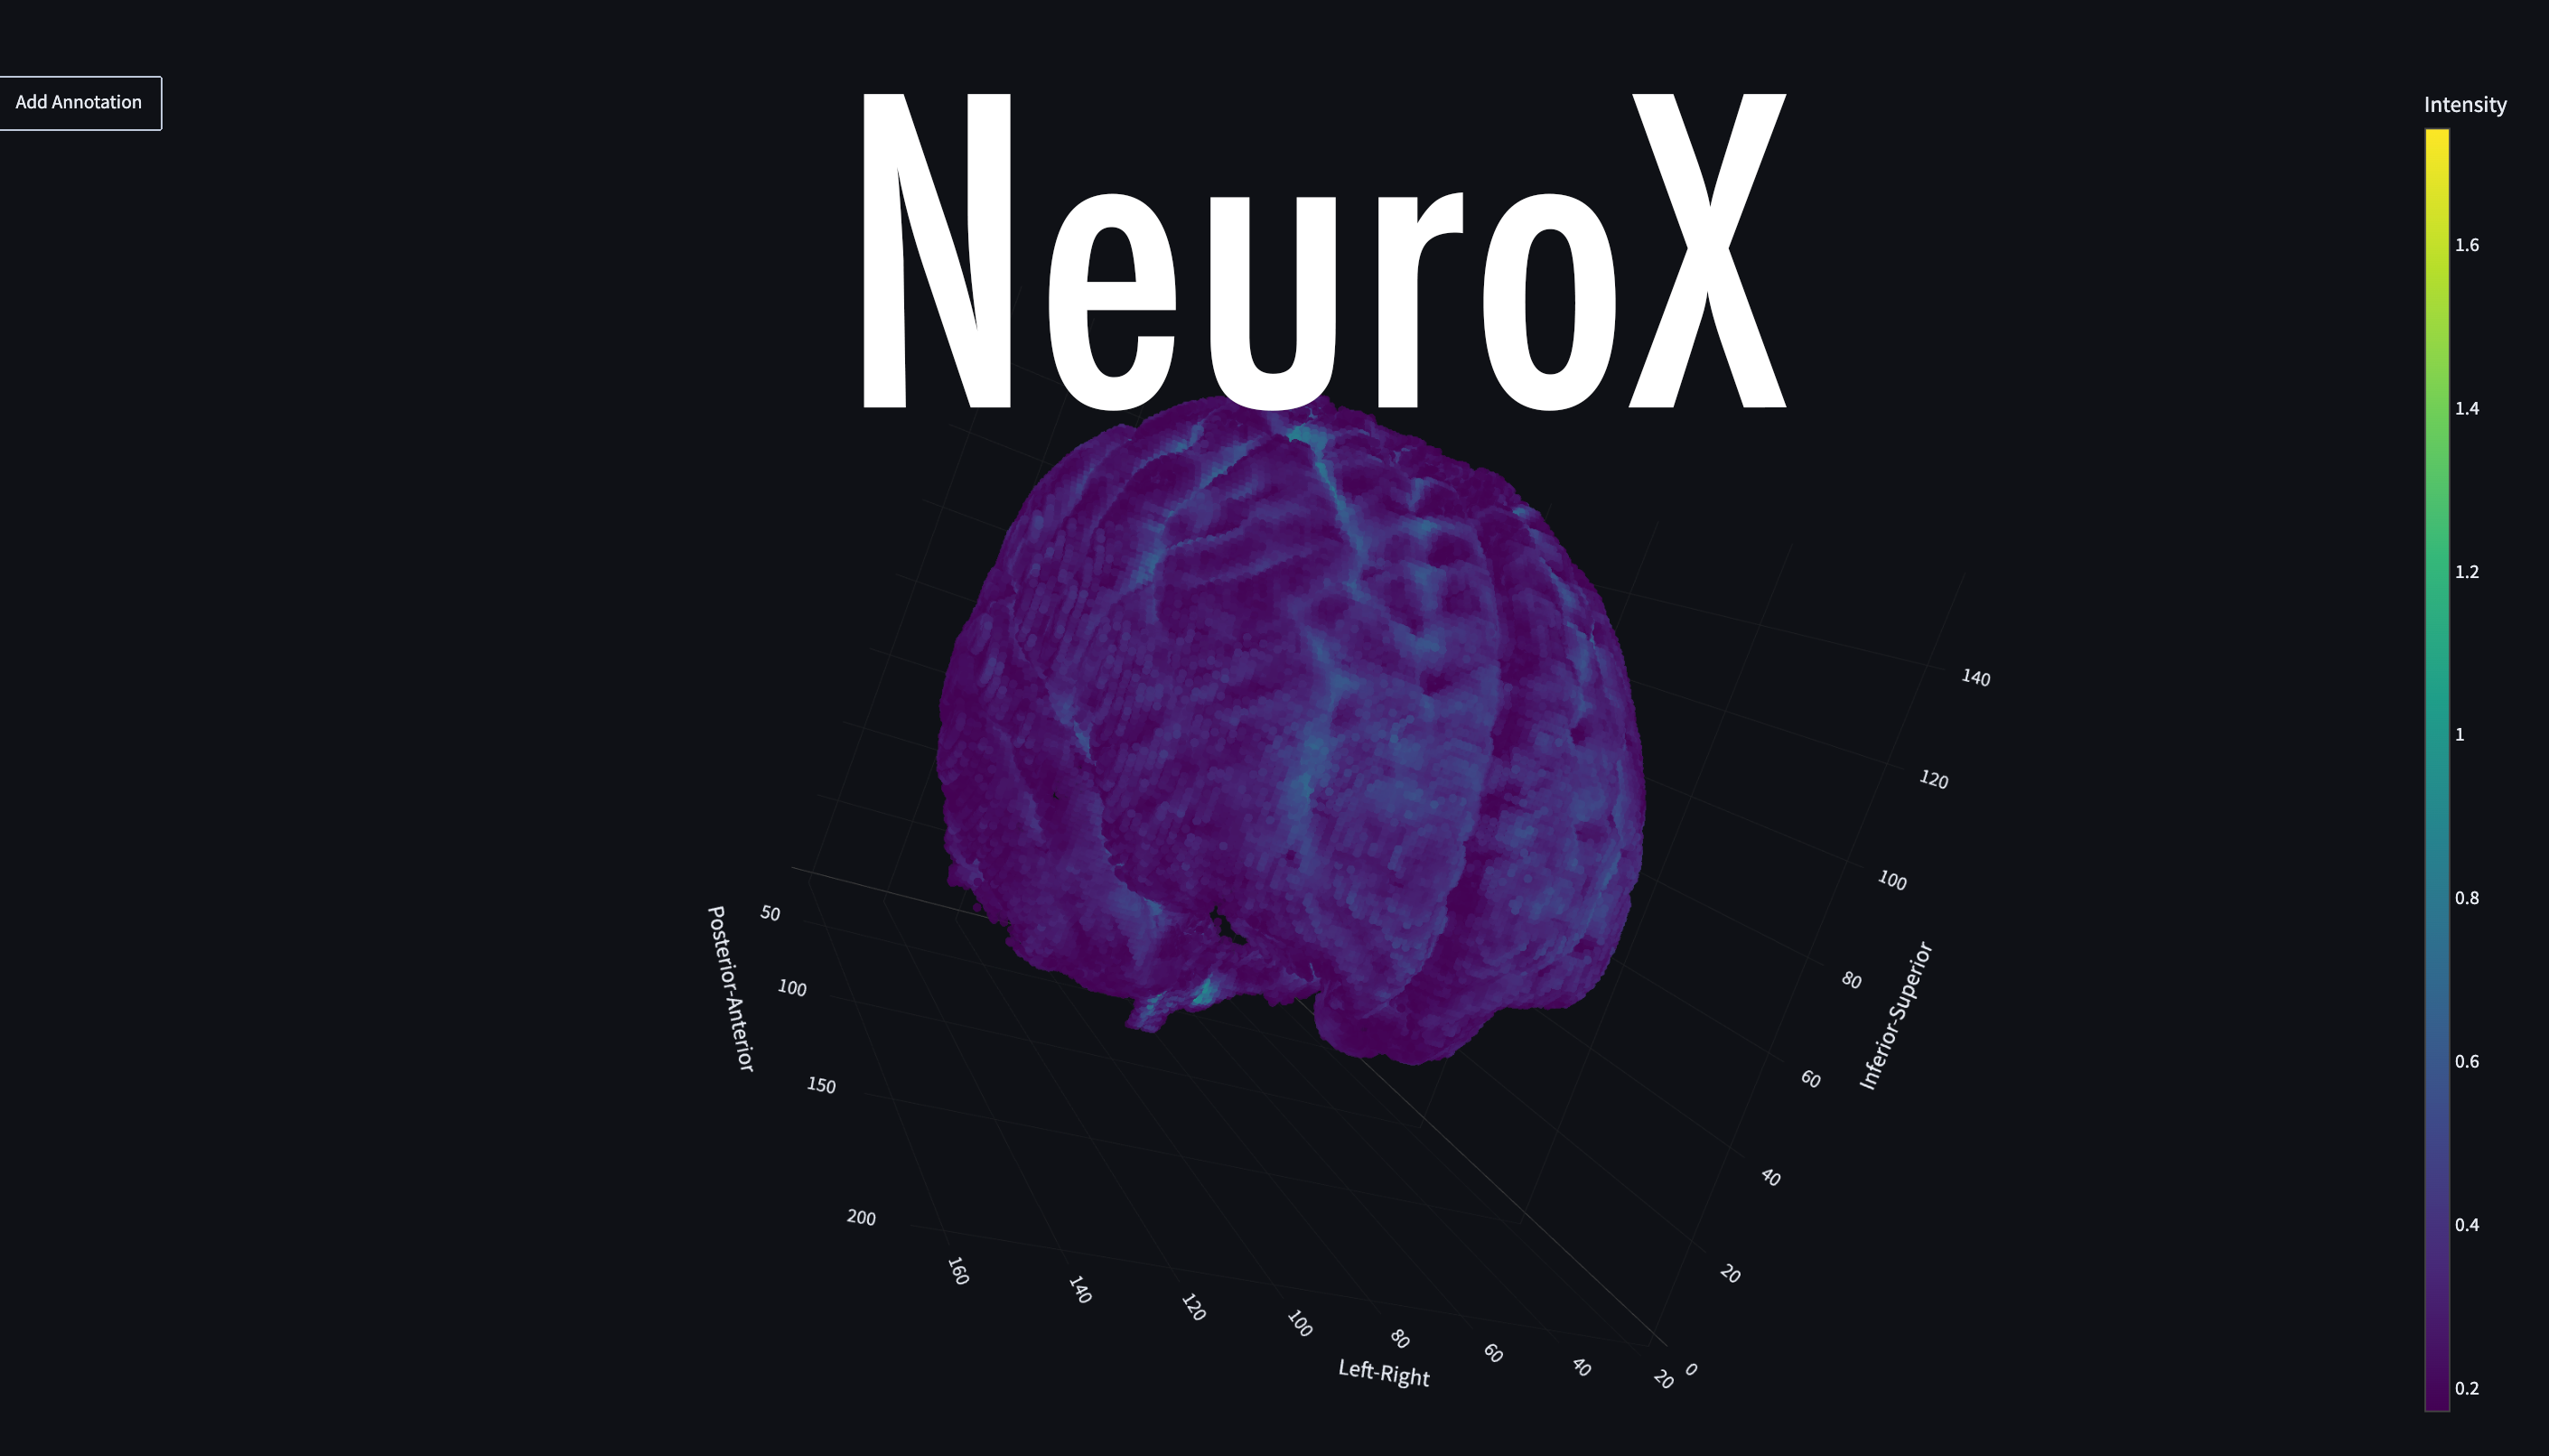
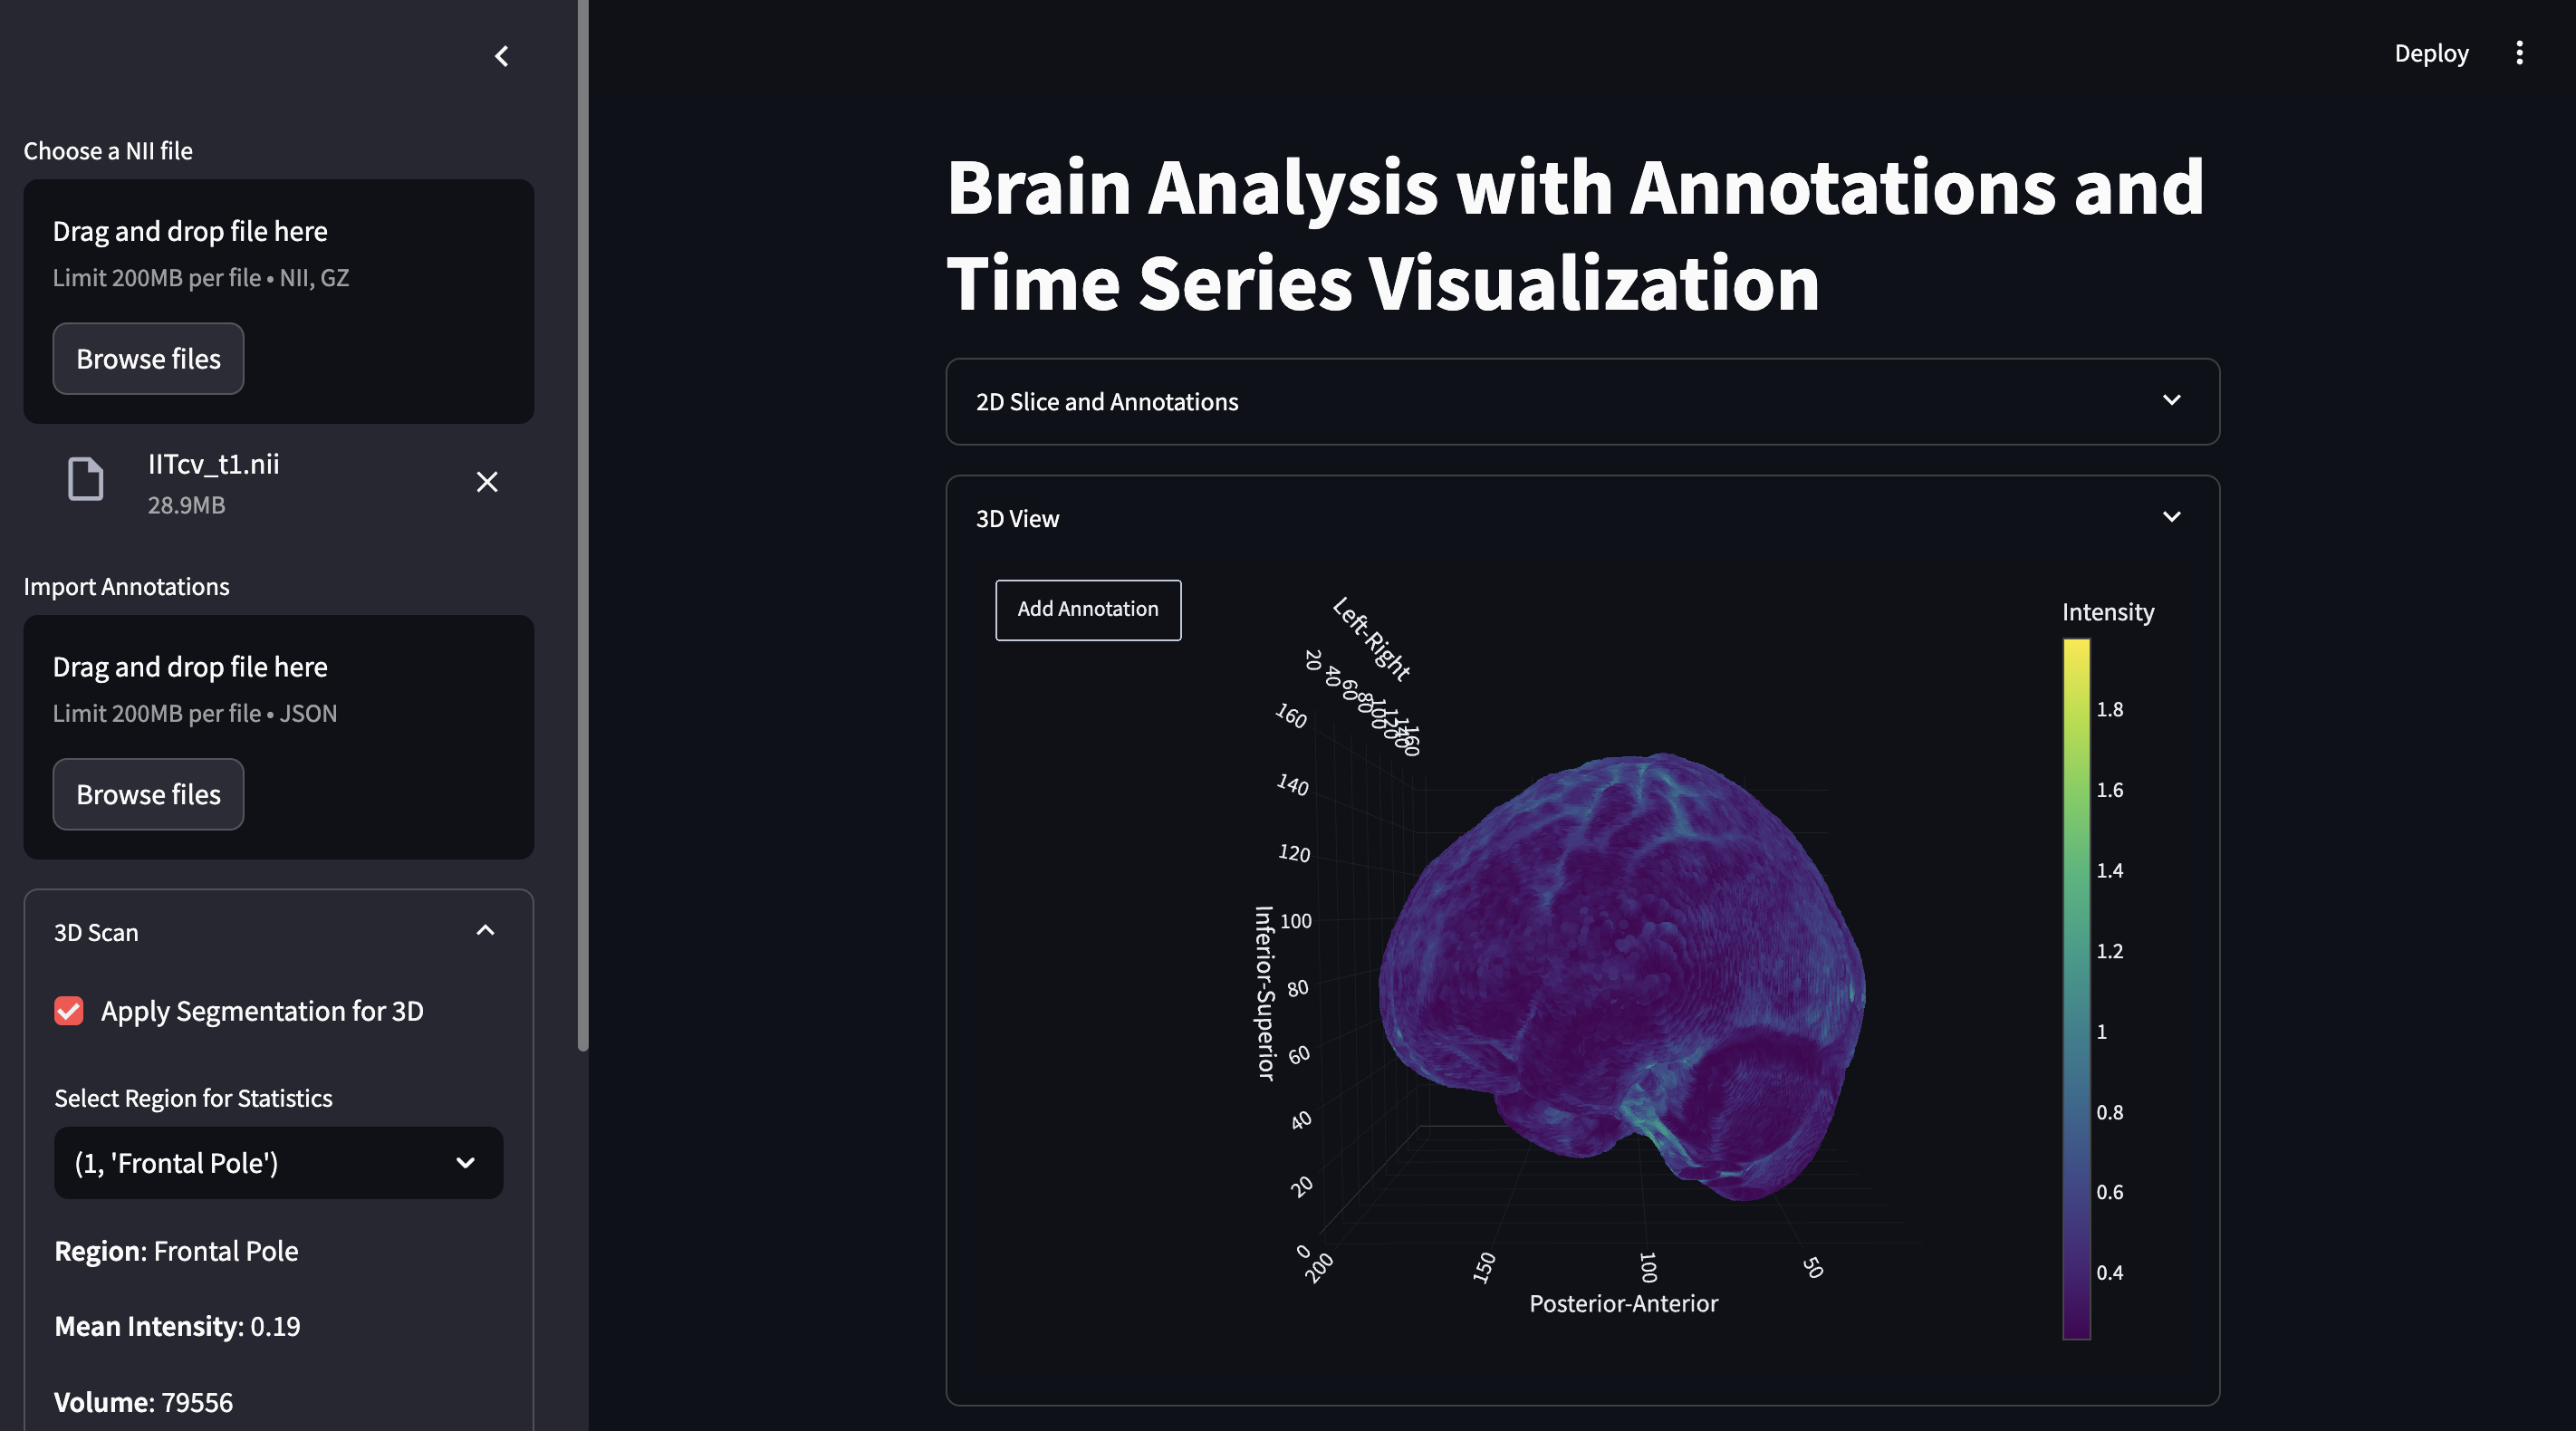
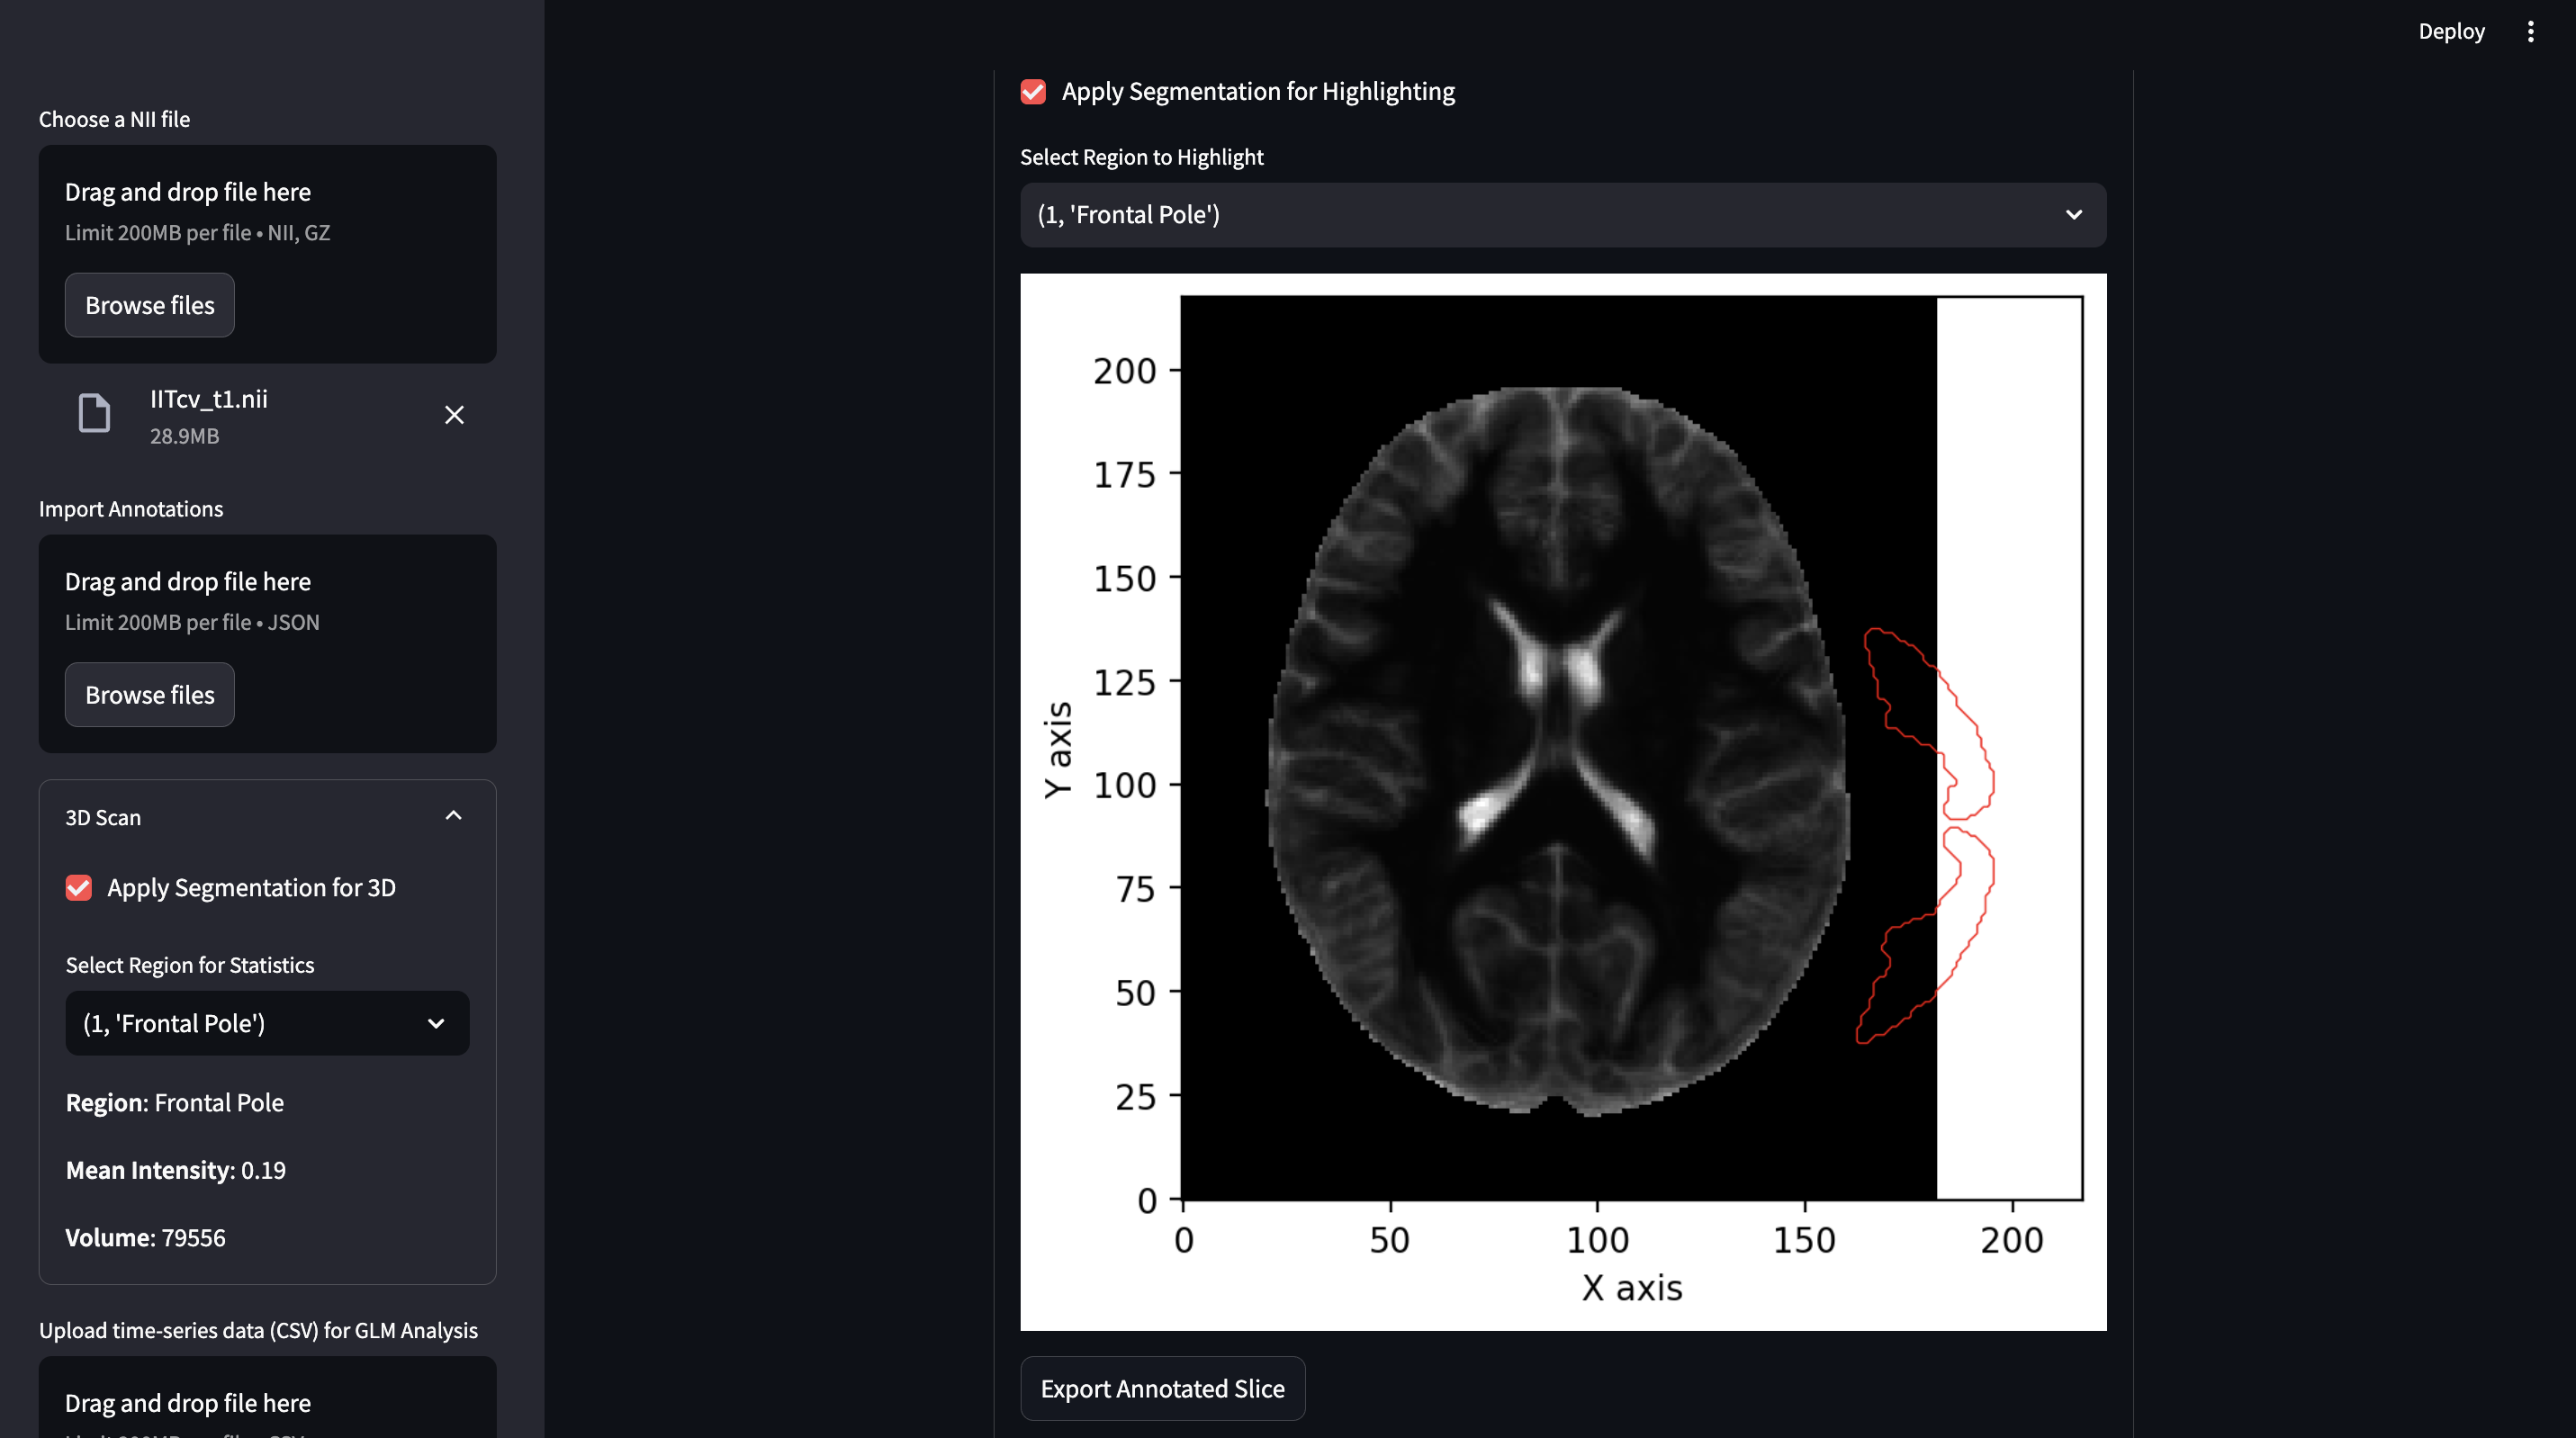
NeuroX is a web-based application that allows users to analyze brain imaging data using a Generalized Linear Model (GLM). It provides an interactive interface for visualizing brain activity over time, exploring data distributions, and performing statistical analyses. The application generates detailed reports, including visualizations like 2D slice views, 3D brain plots, and statistical summaries, to help users interpret the results effectively. It also allows one to export this information to a pdf format, simplifying the research process, as well as the clinical process.
How we built it
NeuroX was built using a combination of powerful libraries and tools:
NiBabel: For reading and writing neuroimaging files (e.g., NIfTI).
Nilearn: For processing and analyzing neuroimaging data.
Streamlit: To create an interactive web interface for user input and visualization.
Matplotlib and Plotly: For generating 2D and 3D visualizations of brain data.
Statsmodels: For performing statistical analysis using GLM.
ReportLab: For generating detailed PDF reports of the analysis.
This involved loading neuroimaging data, processing it, giving the ability to perform exploratory data analysis, and applying GLM to identify significant patterns in brain activity. The results were then visualized and compiled into a comprehensive report.
Challenges we ran into
Data Complexity: Handling and processing large neuroimaging datasets required efficient memory management and optimization.
Visualization: Creating intuitive and interactive visualizations for 3D brain data required careful implementation and testing.
User Interface: Designing a user-friendly interface using Streamlit that could handle complex inputs and outputs was also somewhat of a challenge
Accomplishments that we're proud of Successful Implementation: We built a fully functional application that integrates data loading, processing, analysis, and visualization seamlessly.
Interactive Visualizations: The ability to interactively explore 2D and 3D brain data was a major achievement.
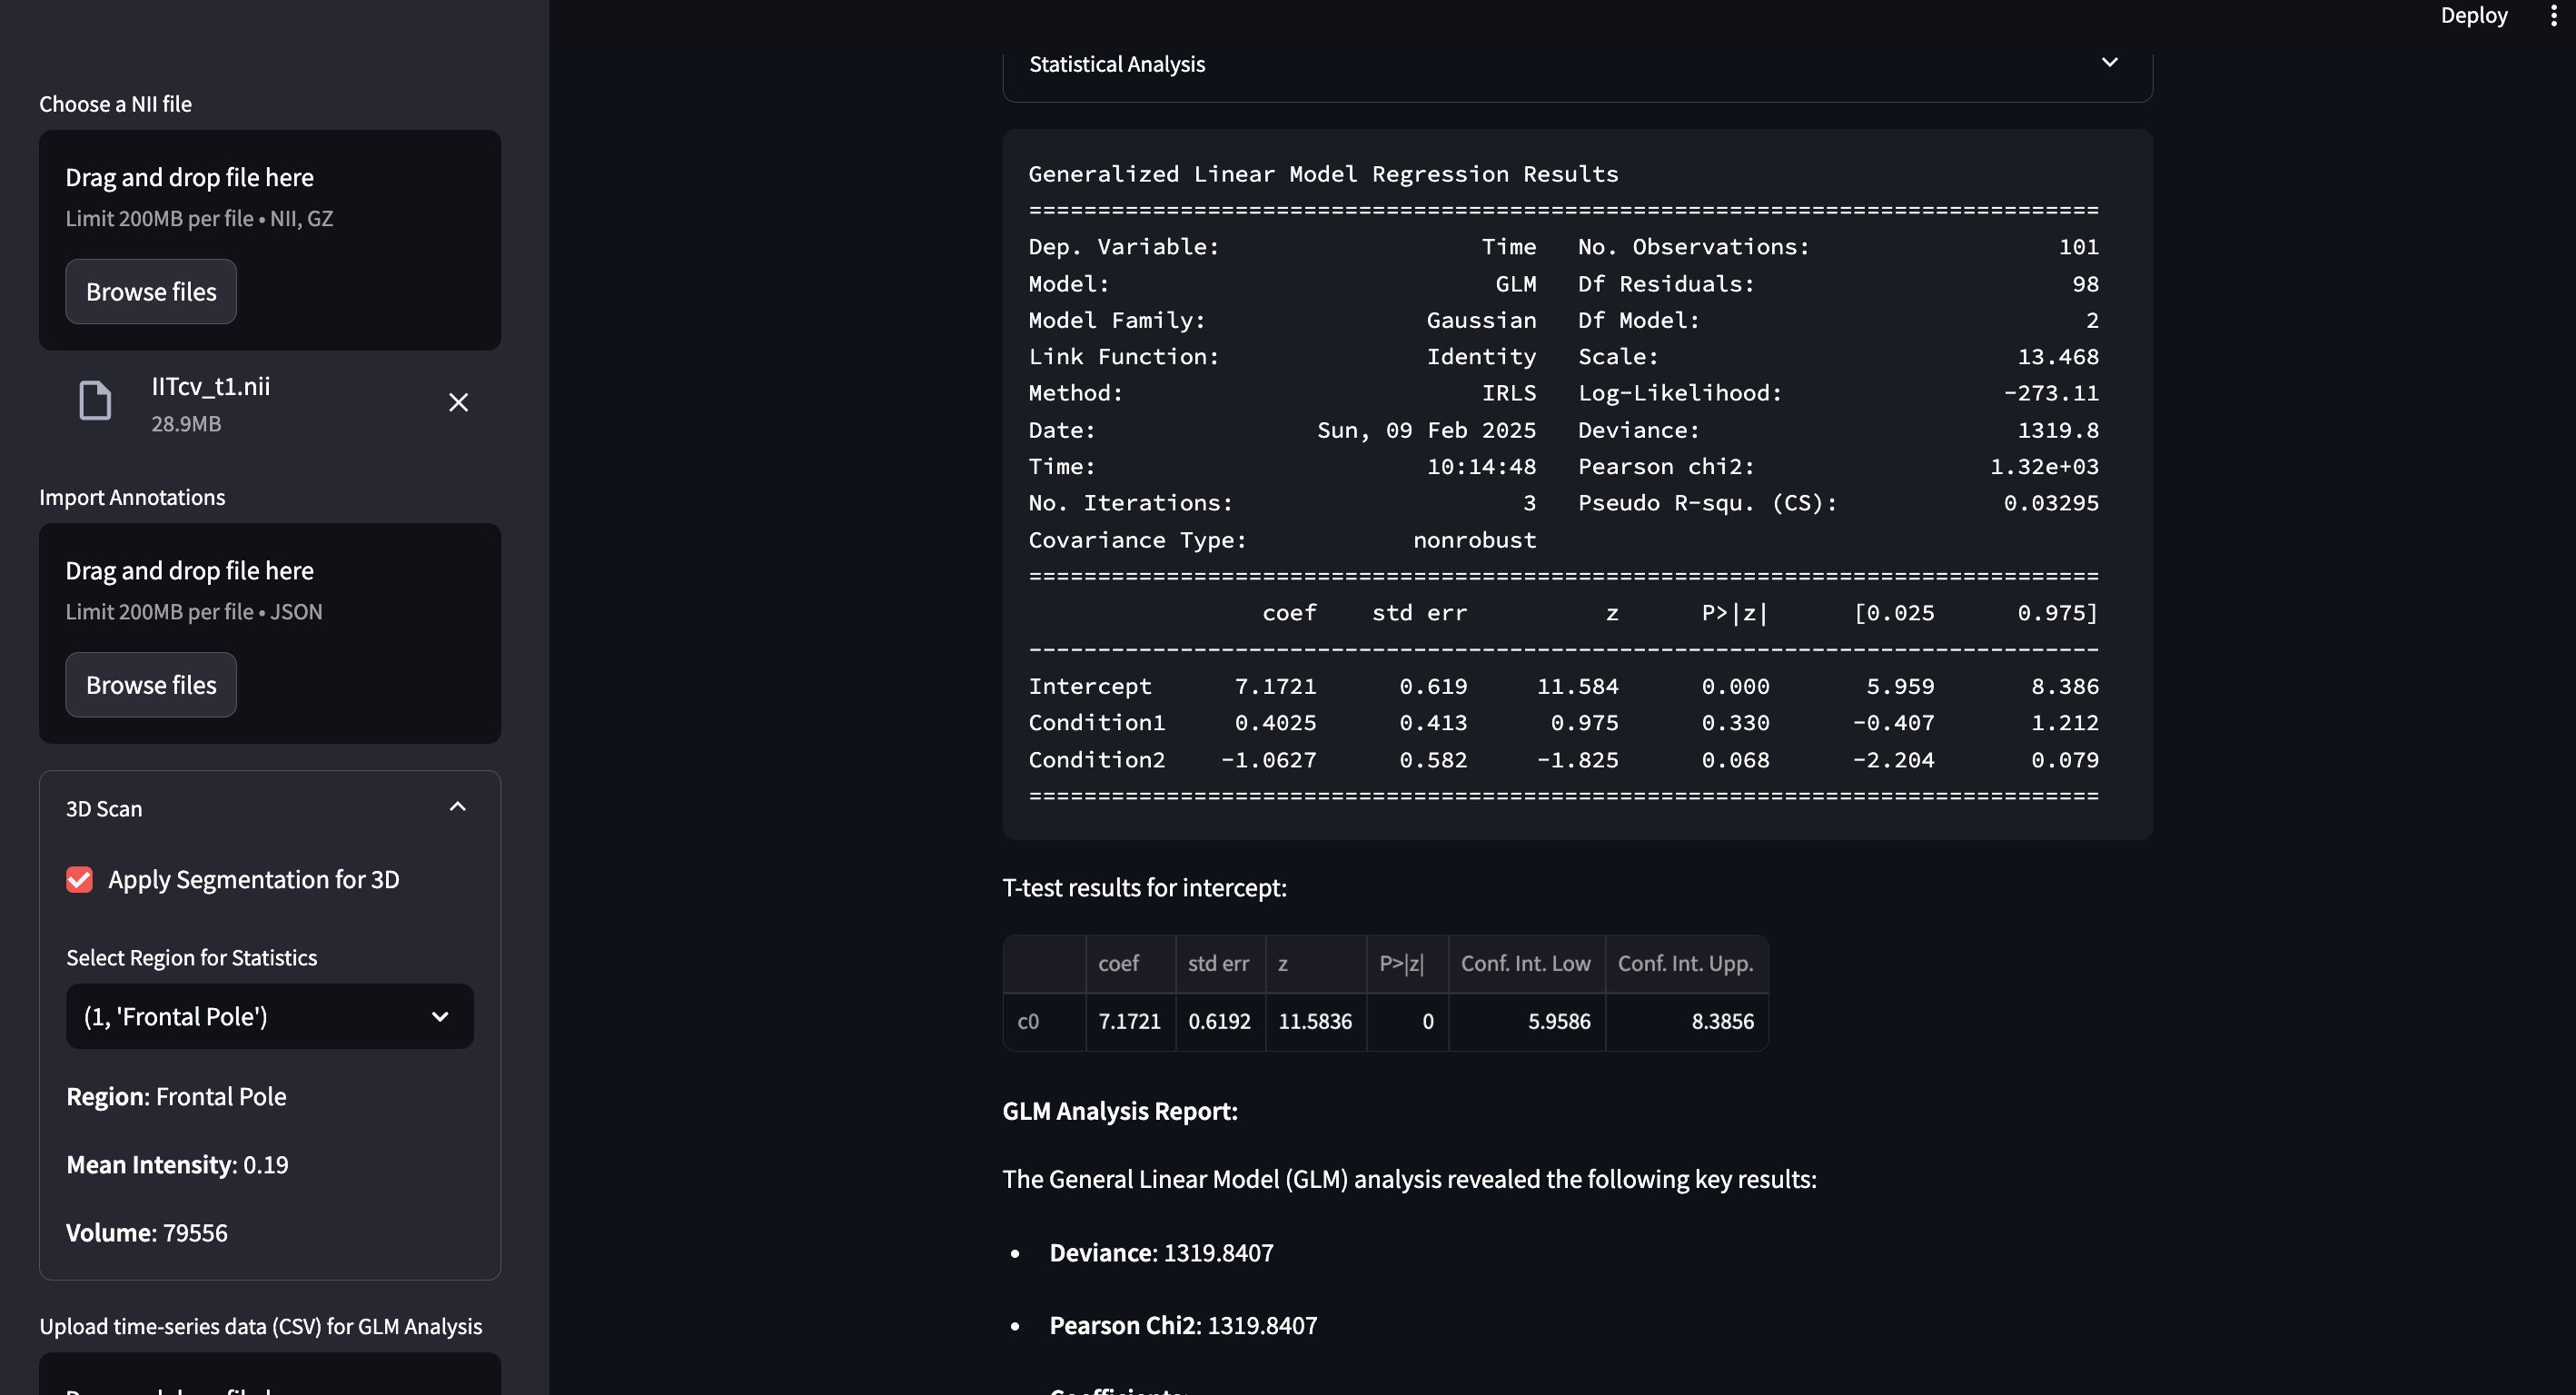
Robust Statistical Analysis: The GLM implementation provided meaningful insights into brain activity, as evidenced by the deviance and Pearson chi-squared values.
Comprehensive Reporting: Generating detailed PDF reports with visualizations and statistical summaries added significant value to the application.
What we learned
Neuroimaging Data: We gained a deeper understanding of the complexities involved in handling and analyzing brain imaging data.
GLM Applications: We learned how to apply GLM to neuroimaging data and interpret the results effectively.
Tool Integration: Combining multiple libraries (NiBabel, Nilearn, Streamlit, etc.) taught us the importance of interoperability and efficient workflow design.
User-Centric Design: We realized the importance of creating an intuitive interface to make complex analyses accessible to non-technical users, such as doctors and researchers.
What's next for NeuroX
Advanced Models: Incorporate machine learning models for more sophisticated analysis.
Real-Time Analysis: Enable real-time processing and visualization of brain imaging data.
Collaboration Features: Add features for sharing and collaborating on analyses within teams.
Clinical Integration: Explore partnerships with clinical researchers to apply NeuroX in real-world neurological studies.
NeuroX has the potential to revolutionize how brain imaging data is analyzed, making it more accessible and actionable for researchers and clinicians worldwide.
Built With
- matplotlib
- nibabel
- nilearn
- numpy
- pandas
- plotly
- reportlab
- scikit-learn
- statsmodels
- streamlit


Log in or sign up for Devpost to join the conversation.