-
-
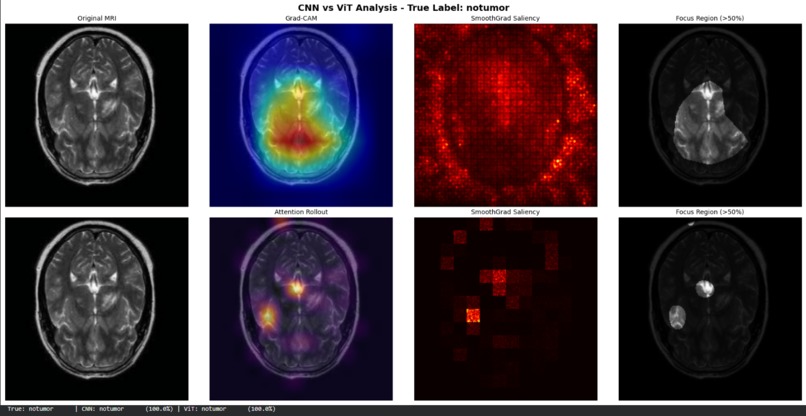
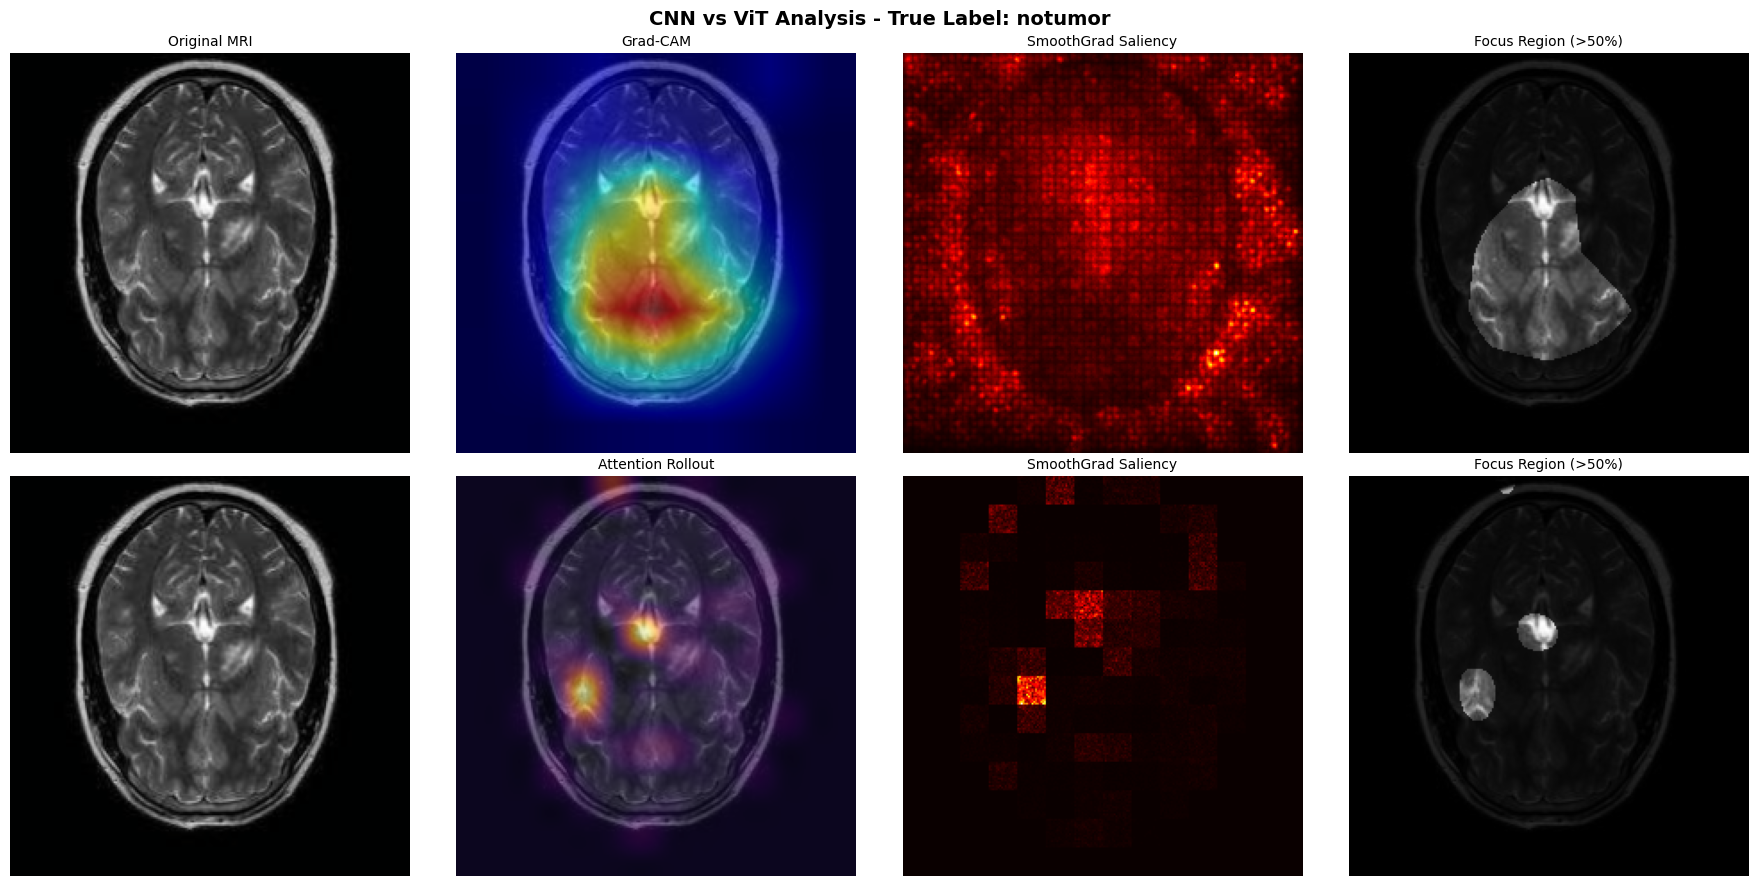
Both the ViT & CNN correctly predicted NoTumor with high confidence
-
-
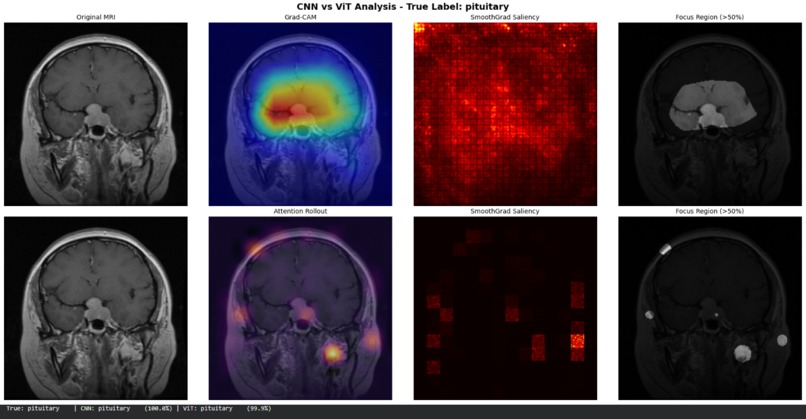
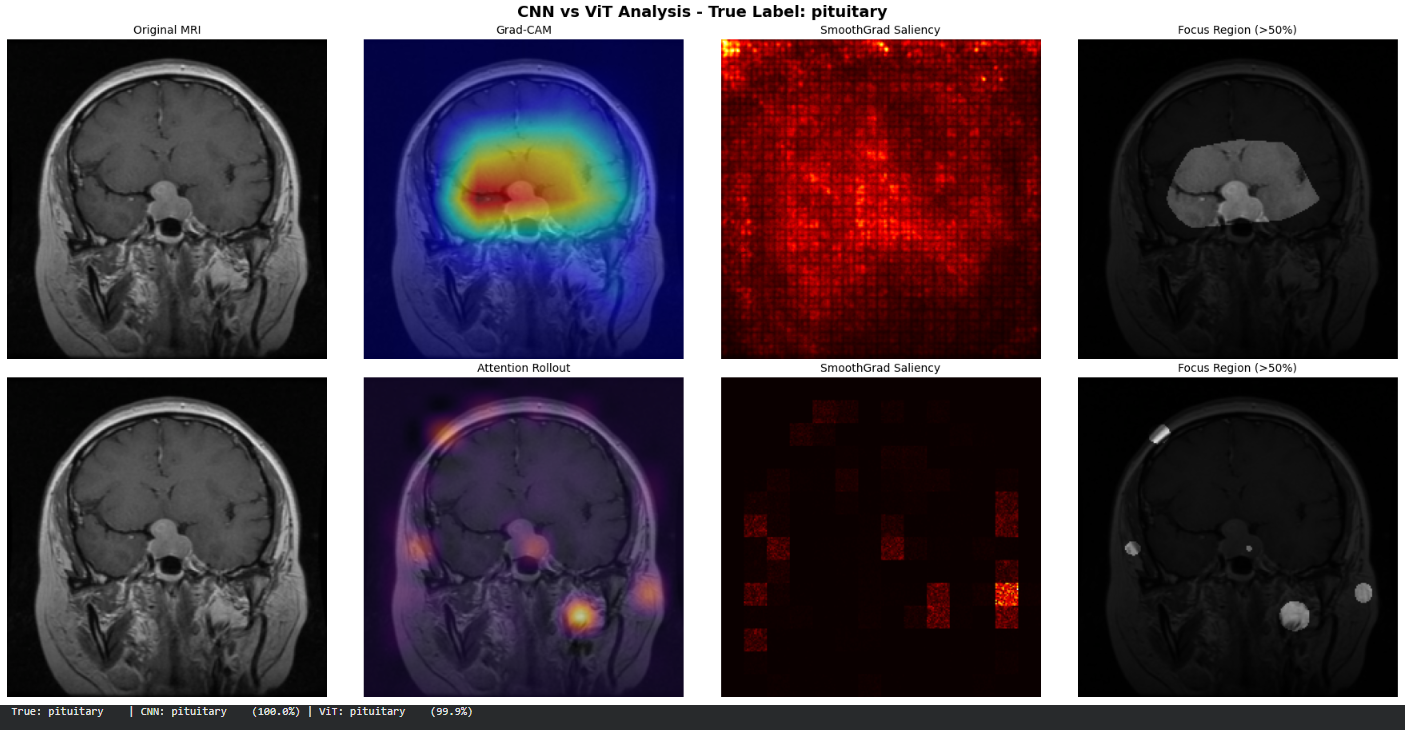
Correct prediction however there are varying confidence levels
Inspiration
I watched MIT OCW 9.13 Nancy Kanwisher's course on the human brain and it fundamentally changed how I think about deep learning. The visual cortex doesn't process information the way a CNN does, and a Transformer's attention mechanism isn't how biological attention works either. But the parallels are striking enough to be useful. That got me thinking: if two architectures can reach similar accuracy on brain tumor classification through completely different computational strategies, shouldn't clinicians be able to see how each one arrives at its answer? Medical AI is advancing fast, but adoption in clinical settings is bottlenecked by trust. Radiologists won't and shouldn't rely on a model that just outputs "glioma" with no explanation. NeuroLens was born from that gap between what models can do and what doctors can verify.
What it does
NeuroLens is a comparative explainability tool for brain tumor MRI classification. You upload a brain MRI scan, and it runs the image through two fundamentally different architectures - ResNet-50 (a CNN) and ViT-B/16 (a Vision Transformer) both fine-tuned on 7,023 brain MRI scans across four classes: Glioma, Meningioma, Pituitary, and No Tumor.
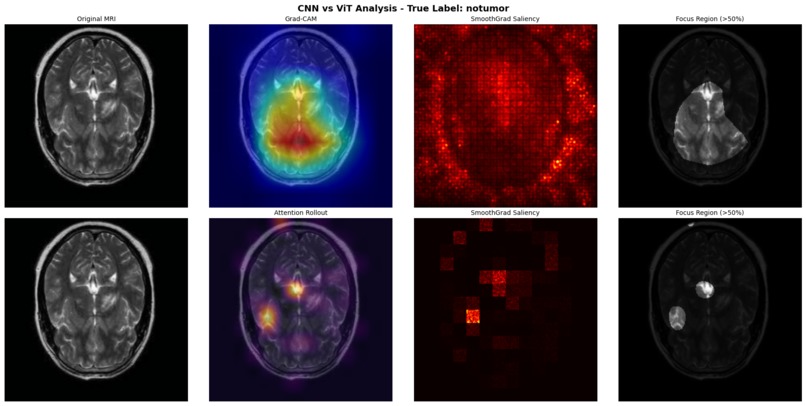
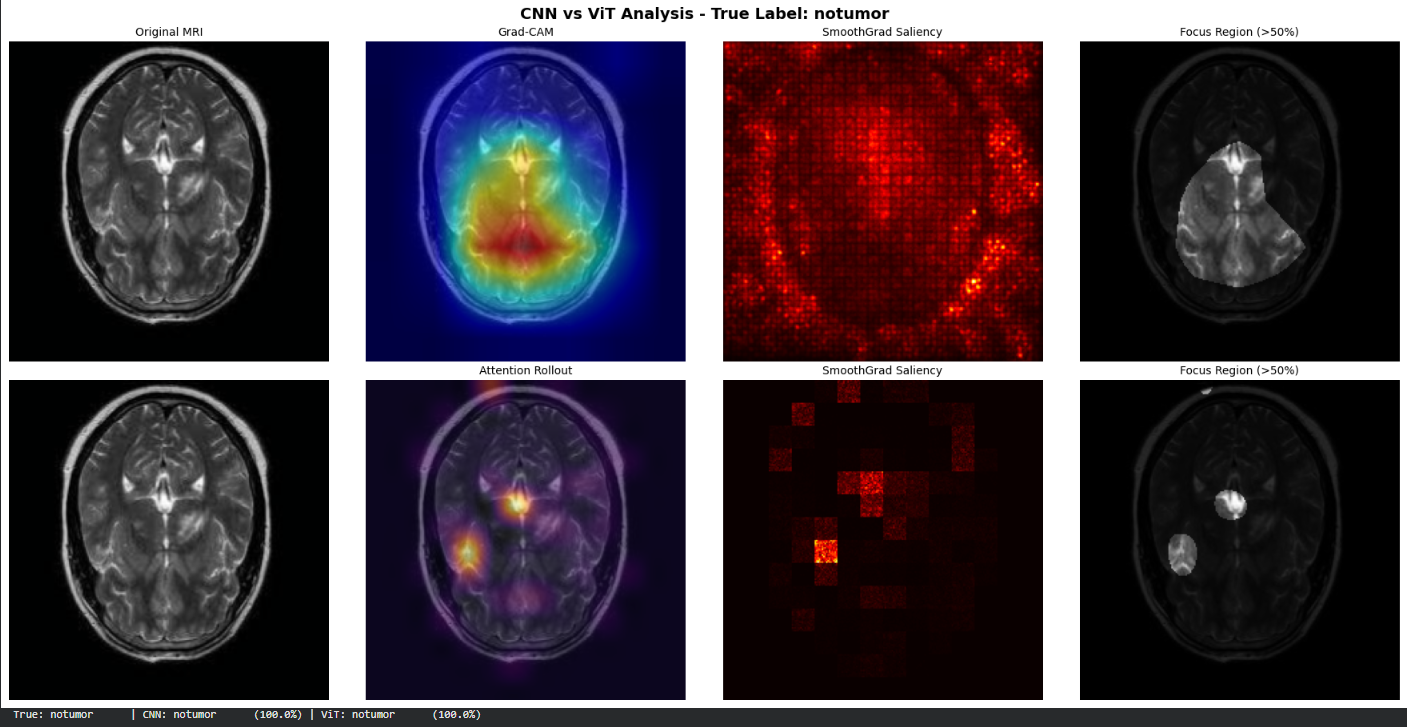
For each architecture, NeuroLens generates three interpretability visualizations:
- Grad-CAM / Attention Rollout - where the model focuses its "attention" when making a prediction
- SmoothGrad - pixel-level sensitivity maps showing which regions most influence the output
- Focus Region - high-activation areas highlighted directly on the original scan
By placing CNN and Transformer explanations side by side, NeuroLens lets researchers and clinicians evaluate not just what the model predicts, but why and how the choice of architecture shapes what the model "sees."
How I built it
Both models were fine-tuned in PyTorch on a combined brain tumor MRI dataset of 7,023 scans. ResNet-50 (90MB) uses standard convolutional feature extraction, while ViT-B/16 (330MB) processes the image as a sequence of patches with self-attention.
The interpretability pipeline was built from scratch. Grad-CAM hooks into ResNet's final convolutional layer to produce class-discriminative heatmaps. For ViT, I implemented Attention Rollout recursively multiplying attention matrices across all 12 transformer layers to approximate how information flows from input patches to the final classification token. SmoothGrad adds Gaussian noise to the input across multiple iterations and averages the resulting gradient maps to produce cleaner sensitivity visualizations. Focus Region thresholds the activation maps and overlays them on the original scan.
The frontend is a Gradio interface hosted on Hugging Face Spaces. The parent platform, Arxelos, runs on FastAPI with Azure Container Apps for the backend, Cloudflare Pages for the frontend, and GitHub Actions for CI/CD.
Challenges we ran into
Model loading on free infrastructure. The two models total ~420MB. On Hugging Face's free CPU tier, cold starts take 1–2 minutes. I had to design the UX around this constraint — clear loading indicators and a note explaining the delay so users don't assume it's broken.
Attention Rollout implementation. Unlike Grad-CAM, which has well-documented libraries, Attention Rollout for ViT required manually extracting attention weights from each of the 12 transformer layers and computing the recursive matrix product. Getting the dimensions right - especially handling the CLS token and reshaping the patch grid back to image space took significant debugging.
Making interpretability visuals actually interpretable. Raw Grad-CAM and SmoothGrad outputs are noisy. I spent considerable time tuning color maps, thresholds, and overlay opacity so the visualizations are genuinely readable rather than just technically correct.
Accomplishments that we're proud of
- Built a working side-by-side CNN vs Transformer interpretability comparison - something most medical AI tools don't offer
- Implemented three distinct explainability methods (Grad-CAM, Attention Rollout, SmoothGrad) from the ground up in PyTorch
- Deployed a fully interactive, publicly accessible demo that anyone can try with their own MRI scans
- The entire system - training, interpretability pipeline, frontend, deployment is a solo build
What I learned
The biggest lesson was that accuracy is the easy part. Getting both models to 90%+ accuracy on brain tumor classification is well-trodden ground. The hard part and the part that actually matters for clinical trust is making the model's reasoning visible and comparable. I also gained a much deeper understanding of how CNNs and Transformers differ at a mechanistic level: CNNs build local features hierarchically while Transformers can attend globally from the first layer, and those differences show up clearly in the visualizations. A CNN's Grad-CAM heatmap often highlights a tight region around the tumor, while ViT's Attention Rollout sometimes spreads attention across contextual areas surrounding tissue, skull boundaries that a CNN ignores entirely.
What's next for NeuroLens
- Quantitative interpretability metrics - integrating faithfulness scores (insertion/deletion curves) so users can measure how reliable each explanation method is, not just view it
- Additional architectures - adding DINOv2 and a hybrid CNN-Transformer (CoAtNet) to the comparison
- 3D volumetric support - extending from 2D slices to full 3D MRI volumes with slice-by-slice interpretability
- Clinical pilot - partnering with radiology departments to test whether side-by-side explanations actually change diagnostic confidence and decision-making
- Research publication - a paper comparing interpretability methods across architectures on medical imaging is in preparation, targeting NeurIPS/AAAI workshops


Log in or sign up for Devpost to join the conversation.