Detecting Burnout Through Real-Time Behavioral Signals
What Inspired This Project
Burnout is everywhere.
Many students drop out of college because they silently struggle.
Many professionals leave their office jobs not because they lack skill, but because they are exhausted.
Some people suffer in isolation — and in extreme cases, burnout contributes to depression, suicide, or even stress-related health decline.
What makes burnout especially dangerous is that it is often invisible until it becomes severe.
I wanted to build something that makes burnout measurable — something that detects early behavioral signals before someone reaches a breaking point.
What I Learned
This project pushed me beyond just coding.
1. Building a Browser Extension
I learned how to:
- Structure a Chrome extension
- Create a popup interface
- Inject content scripts
- Handle background scripts and permissions
- Connect extension data to an external dashboard
2. The Reality of Browser Tracking Limits
One major lesson:
Google and many modern websites intentionally restrict tracking behavior.
- Certain pages block content scripts
- Some interactions are not accessible
- Data collection is sandboxed for privacy
- Extensions cannot record everything continuously
This forced me to rethink what “real-time behavioral signals” realistically means within privacy and API constraints.
3. Designing with Figma & Figma Make
I used Figma to:
- Prototype the dashboard
- Design the extension popup
- Iterate on UX flow
- Refine visual hierarchy
I also explored Figma Make to quickly transform designs into interactive components.
4. Translating Research Into a Burnout Model
Burnout isn’t random — research suggests it correlates with:
- Increased cognitive variability
- Slower task latency
- Reduced engagement
- Higher inconsistency in performance
- Mental fatigue over time
The challenge was turning this into a computable score.
How I Built It
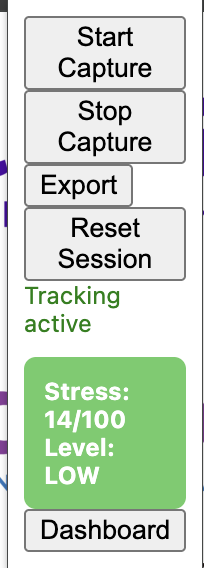
1. Extension Architecture
The system includes:
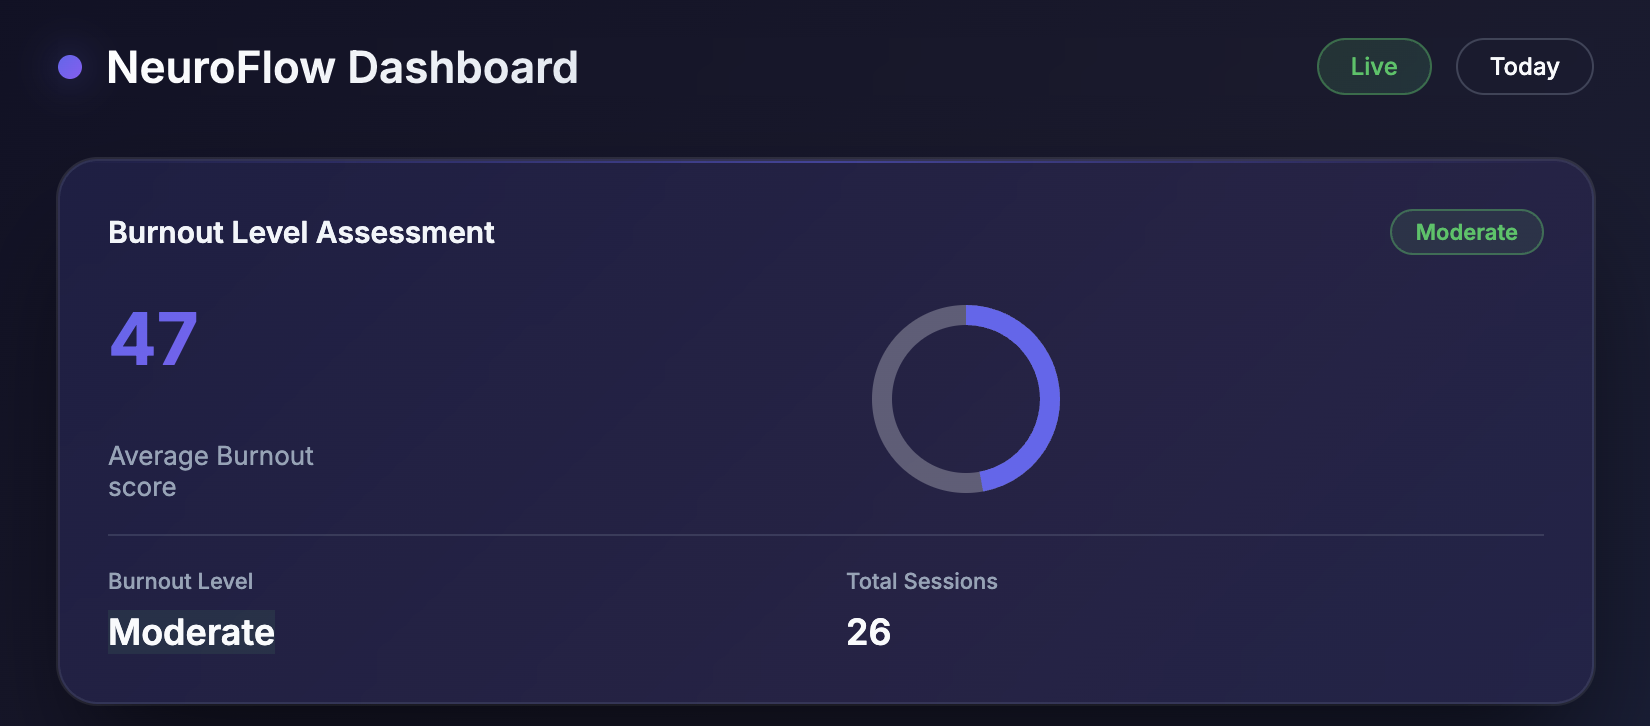
- Popup UI → Displays current burnout score
- Content script → Collects behavioral signals
- Background script → Processes and aggregates data
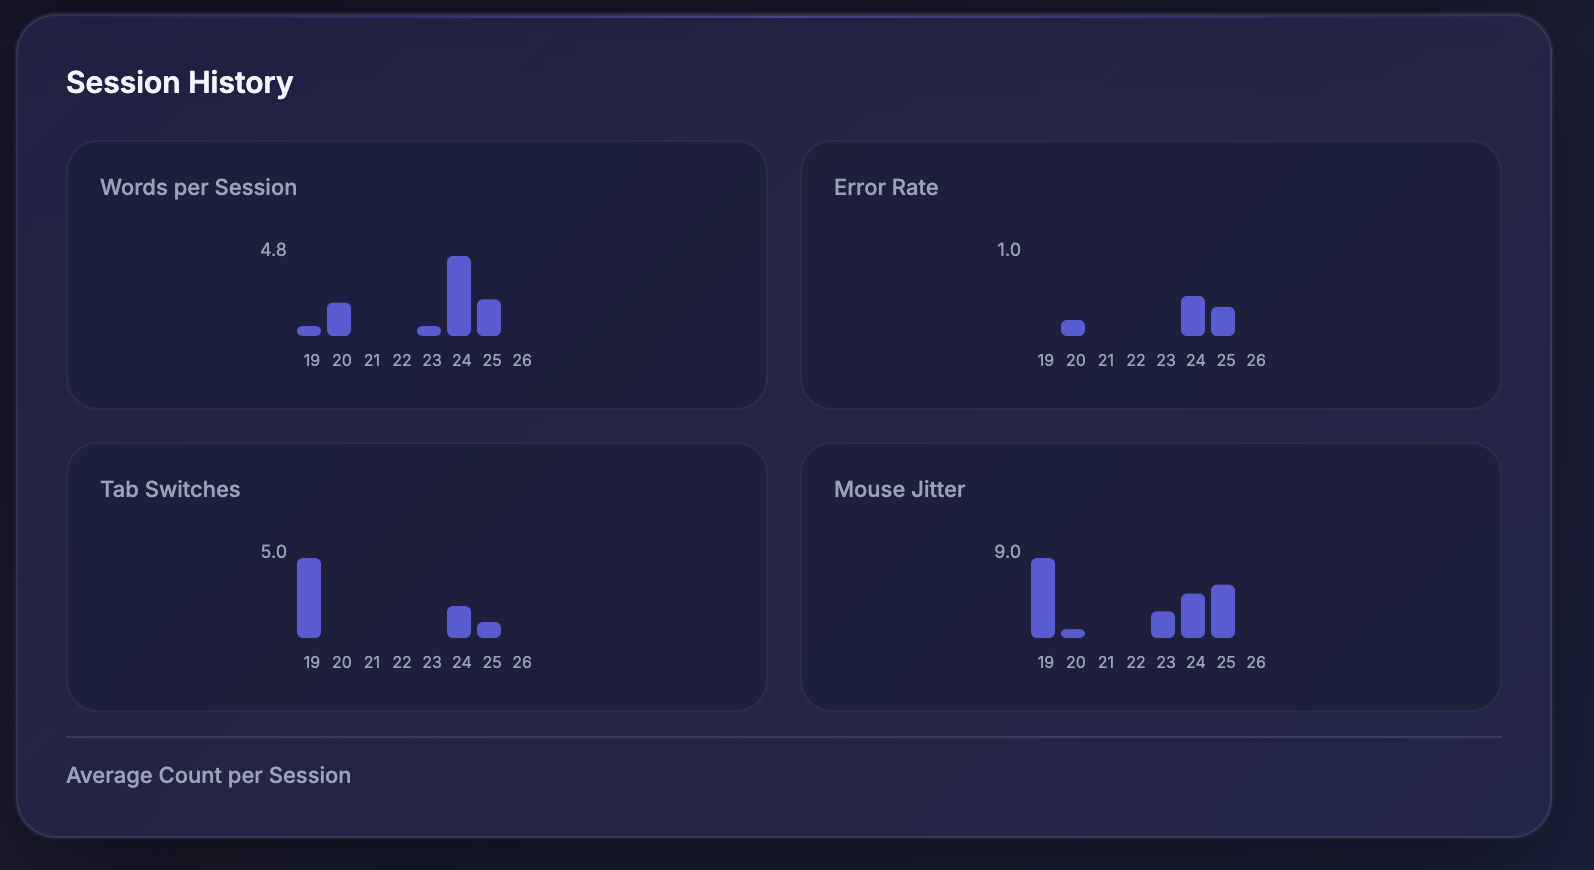
- Dashboard (external) → Visualizes trends over time
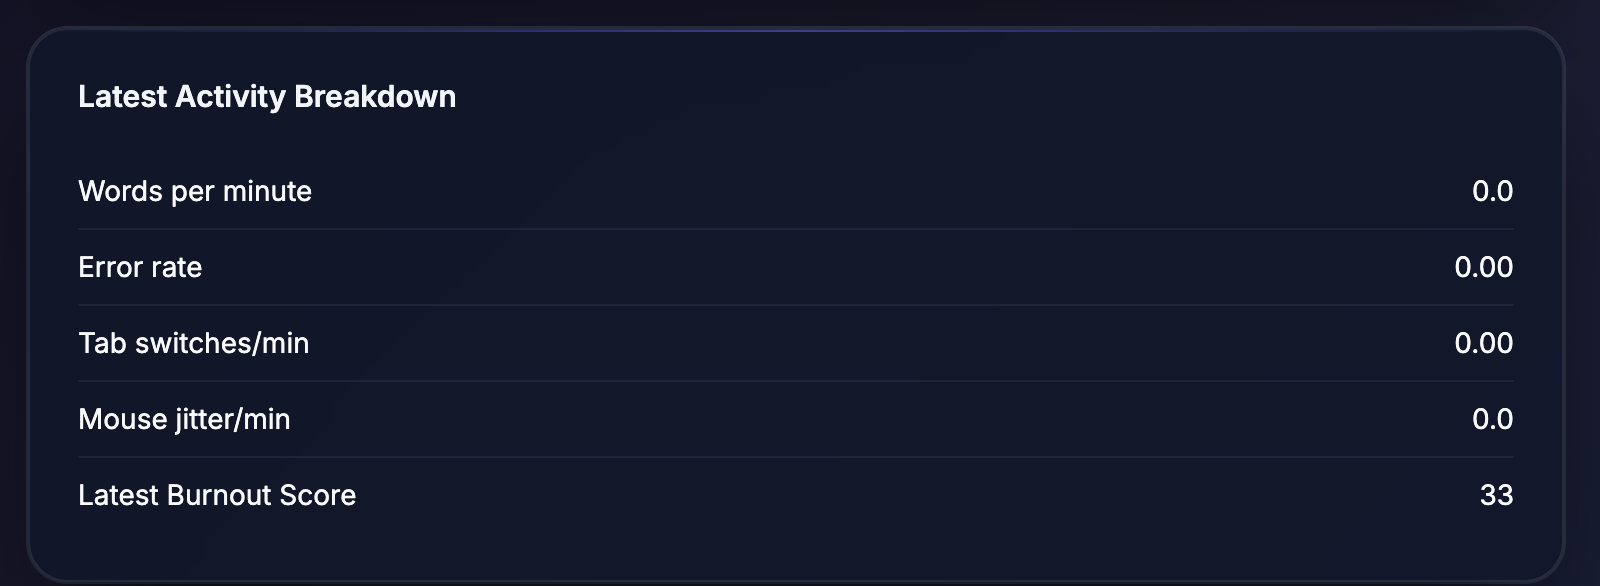
2. Behavioral Signals Tracked
Examples of signals:
- Interaction latency
- Activity bursts vs inactivity
- Tab switching frequency
- Engagement duration
- Behavioral variability over time
3. Burnout Score Formula
I created a weighted behavioral index inspired by cognitive fatigue research:
[ \text{Burnout Score} = w_1 \cdot \sigma_{latency} + w_2 \cdot \Delta engagement + w_3 \cdot inactivity_{ratio} + w_4 \cdot variability_{interaction} ]
Where:
- ( \sigma_{latency} ) = standard deviation of response times
- ( \Delta engagement ) = drop in engagement over time
- ( inactivity_{ratio} ) = proportion of idle time
- ( variability_{interaction} ) = inconsistency in behavior patterns
- ( w_i ) = research-informed weights
This formula is still evolving — burnout is multi-dimensional, and no single equation perfectly captures cognitive strain.
⚠️ Challenges I Faced
1. No Data from Google Pages
Many Google sites block extension tracking.
This meant:
- No behavioral data from commonly used tools
- Incomplete session coverage
- Gaps in data continuity
2. Data Not Recording Properly
- Some interactions weren’t stored
- Storage APIs sometimes failed silently
- Real-time updates didn’t always propagate to the dashboard
This created issues where:
- The dashboard didn’t refresh
- Burnout score wasn’t recalculated correctly
- Historical data was inconsistent
3. Dashboard Sync Issues
Even when data was collected:
- It wasn’t always pushed correctly
- Real-time visualization lagged
- State management was tricky
4. Styling Charts Inside the Extension
Chart rendering inside a popup environment is restrictive:
- Limited space
- Performance constraints
- Styling inconsistencies
- Difficult responsiveness
5. The Hardest Problem: Modeling Burnout
The formula is not perfect.
Burnout is:
- Psychological
- Contextual
- Individual
- Nonlinear
The current model assumes approximate linear weighting:
[ B(t) = \sum_{i=1}^{n} w_i x_i(t) ]
But realistically, burnout may behave more like:
[ B(t) = f(x_1, x_2, ..., x_n) ]
Where ( f ) could be nonlinear and personalized.
This remains an open research challenge.
What This Project Represents
This is not just a dashboard.
It is an attempt to:
- Make cognitive strain measurable
- Detect burnout early
- Translate neuroscience into usable tools
- Bridge research and real-world behavior
Burnout should not be invisible.
If we can measure it,
we can intervene earlier.
And if we can intervene earlier,
we might prevent people from silently reaching a breaking point.

Log in or sign up for Devpost to join the conversation.