-
-
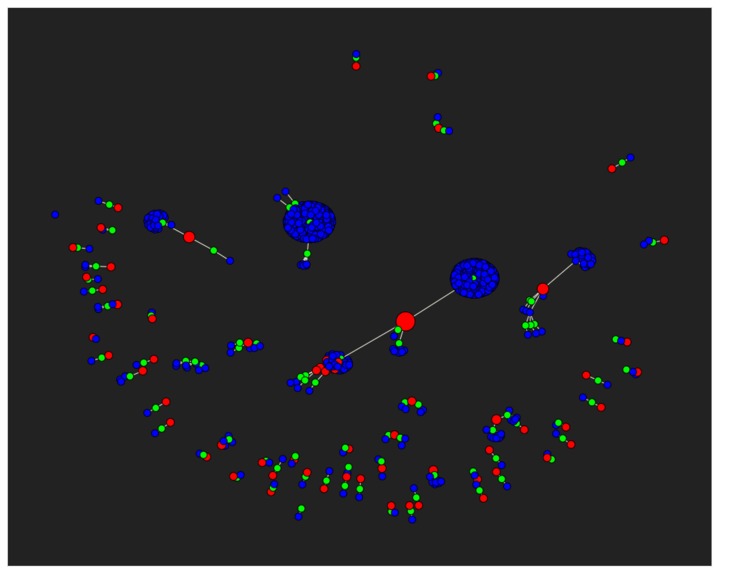
A screen shot of the network
-

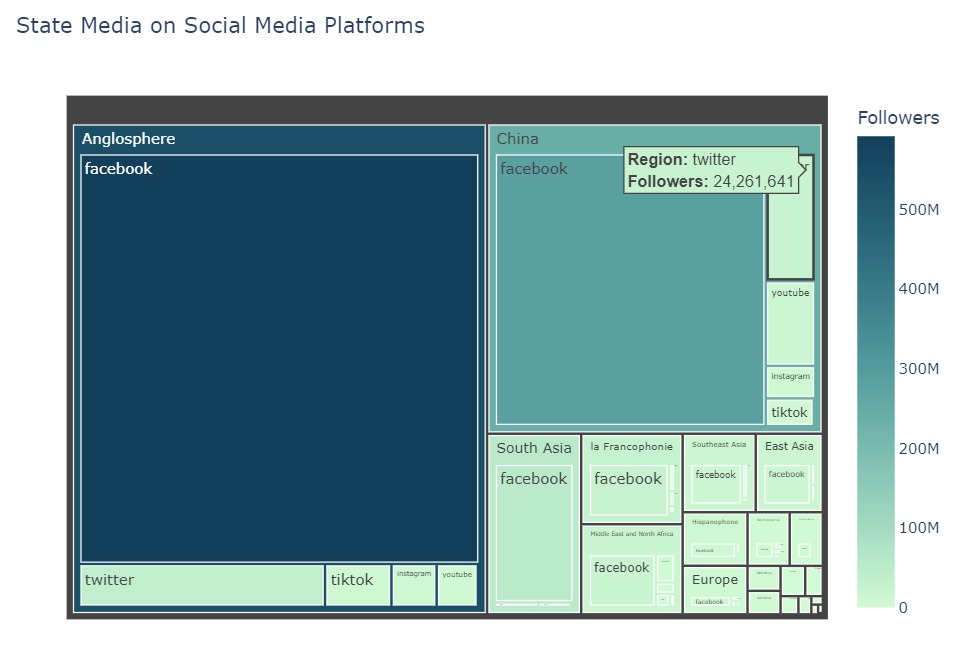
State Media on social media platforms
-

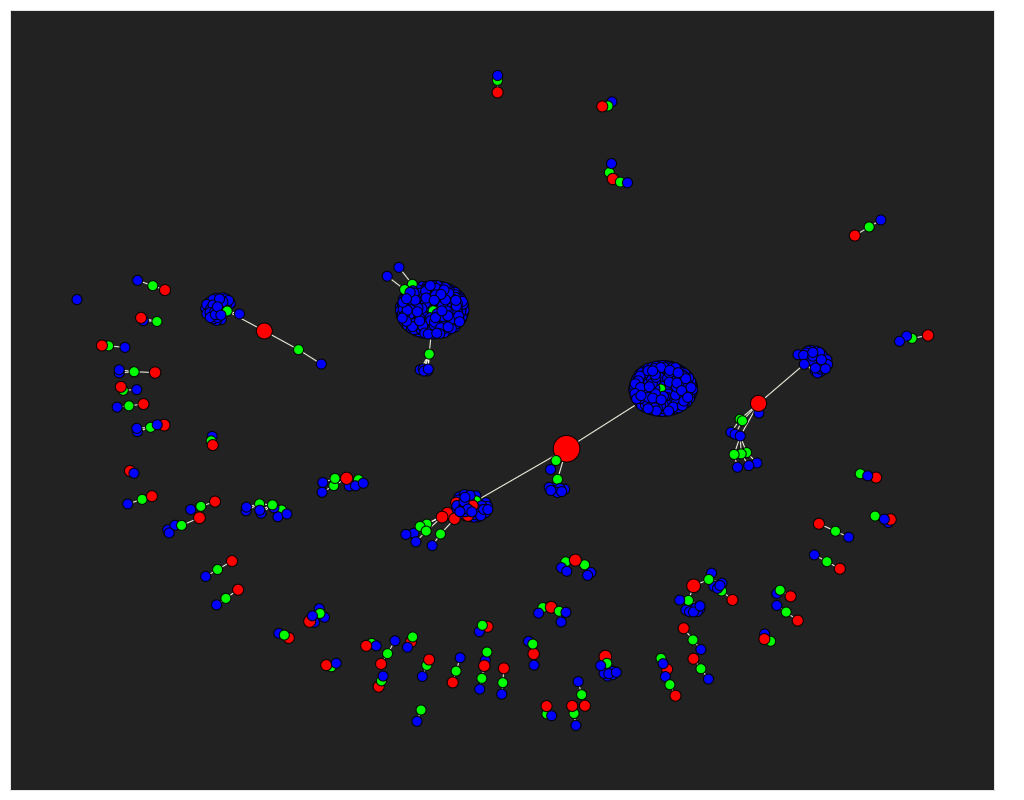
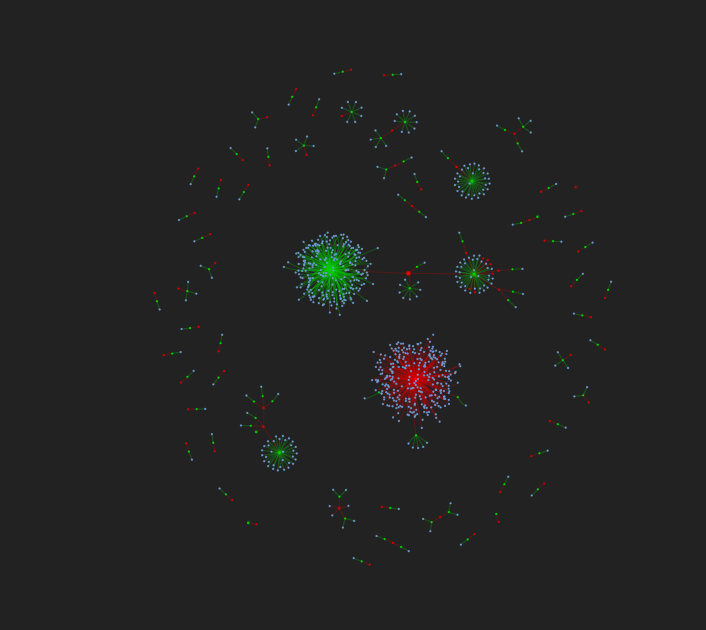
Another plot for the network
Inspiration
We were inspired by the growing complexity of social media networks and the opaque nature of online interactions. Recognizing the difficulty in understanding who is behind various Twitter accounts and how they are interconnected, we saw an opportunity to bring clarity and insight into this digital landscape. Our goal was to create a tool that not only visualizes these connections but also reveals the real-world entities behind them, fostering greater transparency and understanding.
What it does
Our network visualization tool maps out the connections between different Twitter accounts, highlighting their relationships and ownership. It integrates direct links to these Twitter accounts, offering users an interactive view of the social media network. Users can explore how accounts are interconnected, identify influential nodes, and understand the broader context of online discussions and trends.
In addition to that, we also created other visualizations that can assist during the process if analyzing this data. All these visualisation can be put together to create an even more informative dashboard.
How we built it
Our tool was developed using Python, a powerful programming language known for its versatility in data analysis and visualization. We leveraged Python's rich ecosystem, employing libraries such as Pandas for data manipulation and analysis. For the network analysis, we used HoloViews, an advanced Python library that facilitates the construction and exploration of complex data structures. The interactive and dynamic visual aspect of our tool was realized using Bokeh, a Python interactive visualization library that enabled us to create responsive and detailed graphical representations of networks. By integrating these technologies, we built a robust platform that not only accurately maps the connections between Twitter accounts but also provides an intuitive and engaging user experience.
Challenges we ran into
A significant challenge we encountered was the integration of Bokeh's JavaScript backend with our Python-based environment. Bokeh relies heavily on JavaScript for its dynamic features. This necessitated a seamless blend of Python and JavaScript, which presented a challenge. Ensuring that the interactive elements of our visualizations functioned correctly required a careful and sometimes intricate bridging of these two languages. Overcoming these hurdles was crucial for us to leverage Bokeh's full potential and provide an interactive, user-friendly experience in our network visualization tool.
Accomplishments that we're proud of
We are particularly proud of our tool's ability to accurately map complex networks and provide direct links to Twitter accounts. The intuitive nature of our visualization, allows users to easily understand and explore complex social media relationships.
What we learned
Throughout this project, we learned a great deal about network analysis and data visualization. We gained insights into the intricacies of online social structures and the technical challenges involved in representing them effectively. This project also enhanced our skills in collaborative problem-solving and innovation.
What's next for Network Vis
Moving forward, we plan to expand the capabilities of Network Vis to include more social media platforms and deeper analytical features. We aim to incorporate machine learning algorithms for more sophisticated analysis of network dynamics and influence patterns.

Log in or sign up for Devpost to join the conversation.