-
-

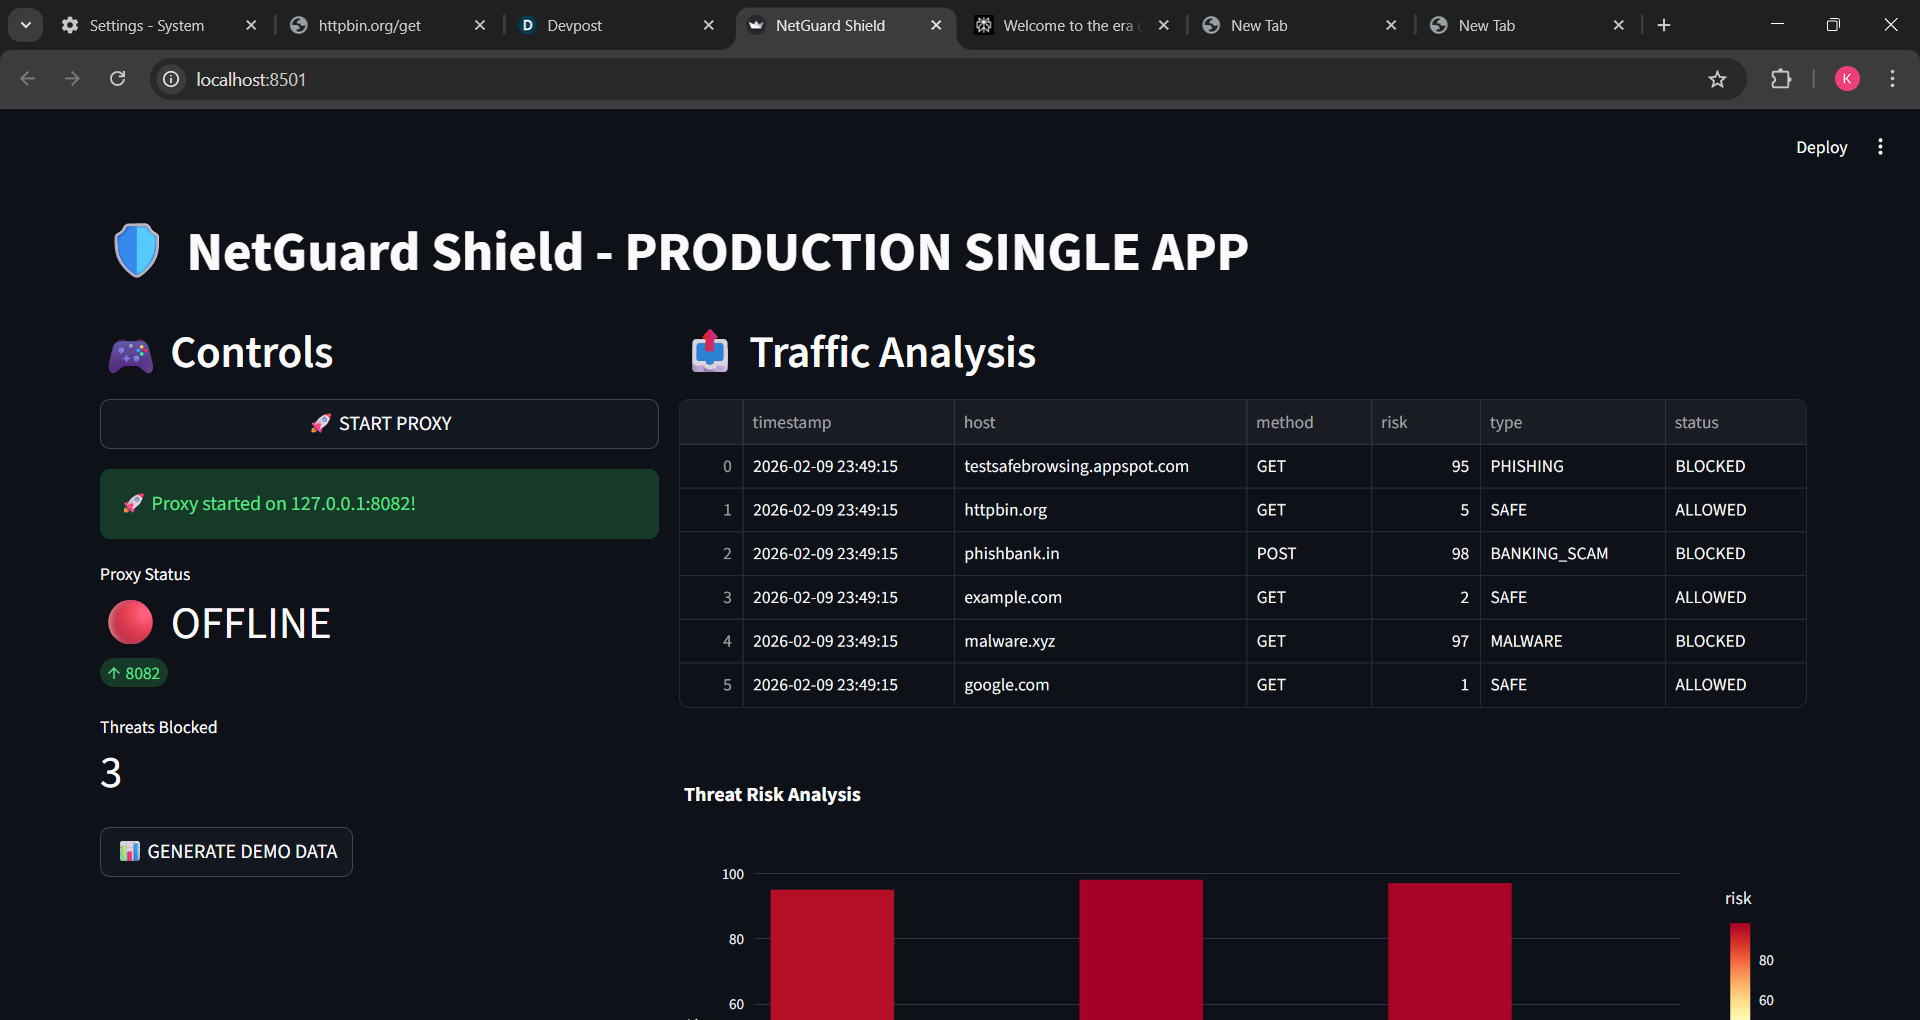
Central control panel for NetGuard Shield: start the proxy, monitor status, and visualize blocked phishing attempts.
Inspiration
Phishing and malicious sites are still one of the easiest ways to break into people’s accounts and networks. I wanted something that doesn’t just detect threats after the fact, but sits in the middle of the traffic and actively blocks them in real time. At the same time, I wanted a visual way to “see” what the network is doing, instead of only raw logs. That’s how NetGuard Shield was born: an AI‑flavoured man‑in‑the‑middle proxy plus a live dashboard.
What it does
NetGuard Shield is a small, local security layer that:
Intercepts HTTP/HTTPS traffic through a proxy.
Checks each request’s host against a threat database and AI‑style risk score.
Blocks known or high‑risk phishing / malware domains with a custom error page.
Logs traffic into a structured format (CSV) for analysis.
Visualizes recent traffic and risk levels in a Streamlit dashboard (bar charts + tables + KPIs).
The result is something you can run on a single laptop, point your browser at, and immediately see which domains are safe and which are being blocked.
How I built it
I split the project into three main parts:
Proxy and blocking engine (backend security layer)
Used mitmproxy to act as a man‑in‑the‑middle HTTP(S) proxy.
Wrote a Python addon (proxy.py) that inspects every request, extracts the host, looks it up in a simple threat database, and decides whether to allow or block it.
When a domain is flagged, the proxy returns a 403‑style response with a message like “AI BLOCKED 95% PHISHING”.
Traffic logger
Created a second mitmproxy script (traffic_logger.py) that listens to responses and appends rows to traffic_log.csv.
Each row includes timestamp, host, method, risk score, threat type, and status (BLOCKED / ALLOWED).
This gives a clean, structured dataset that the dashboard can read without touching the proxy internals.
Visualization dashboard (frontend)
Built a Streamlit app (dashboard.py) that:
Lets you upload traffic_log.csv.
Shows the latest rows in a table.
Draws a Plotly bar chart of risk scores by host.
Displays key metrics: number of analyses, blocked threats, and an overall “risk score”.
The UI is kept simple: two columns (controls + stats on the left, data + chart on the right), with a “Live Proxy Status” section to make the setup clear in a demo.
Optionally, I also explored a more “application style” setup using FastAPI as a backend and Streamlit as a frontend, where traffic is stored in SQLite instead of CSV, to make the architecture closer to a production service.
What I learned
Man‑in‑the‑middle tooling is powerful but opinionated. Getting mitmproxy scripts to behave like a clean, reusable “engine” taught me a lot about HTTP flows, events, and how to hook into them without breaking normal browsing.
Small, consistent data formats matter. Having a single CSV schema (timestamp, host, method, risk, type, status) made it trivial to plug traffic into visualizations and to iterate on the UI without touching the proxy code.
Developer experience = demo quality. Thinking in terms of “what can a judge understand in 60–90 seconds” pushed me to add things like live metrics, clear labels, and copy‑paste setup instructions right inside the UI.
Challenges
Port conflicts and multiple processes. Running mitmproxy, the logger, and Streamlit at the same time meant dealing with ports already in use, background processes, and making sure each component used a clear, fixed port. I had to adjust commands and occasionally kill old processes to keep the demo stable.
Keeping the demo simple but realistic. It’s easy to over‑engineer (e.g., full microservices, complex databases), but that would slow down development and confuse reviewers. Balancing realism (MITM proxy, logging, dashboard) with a clean, “one‑machine” setup was a constant design decision.
UX around “safe vs blocked”. I wanted it to be obvious when a site is allowed versus blocked: both in the browser (custom error text) and in the terminal/dashboards. That meant iterating on log messages, threat labels, and chart design so that the story is visually clear.
Built With
- browser
- chrome
- configured
- fastapi-(optional-backend-api-/-application-setup)
- mitmproxy-(http(s)-interception-and-blocking-engine)
- pandas-(data-handling-for-traffic-logs)
- plotly-express-(interactive-charts)
- python-3.11
- sqlite-/-csv-(traffic-logging-and-storage)
- streamlit-(web-dashboard-/-frontend)
- the
- to
- use
- uvicorn-(asgi-server-for-fastapi)

Log in or sign up for Devpost to join the conversation.