Inspiration
Inspiration
Traditional network scanning tools output flat lists of IP addresses and open ports, making it difficult to visualize how devices interconnect across subnets or spot lateral movement paths. I built NetGraph to model network infrastructure naturally as a graph using relate-db.
What it does
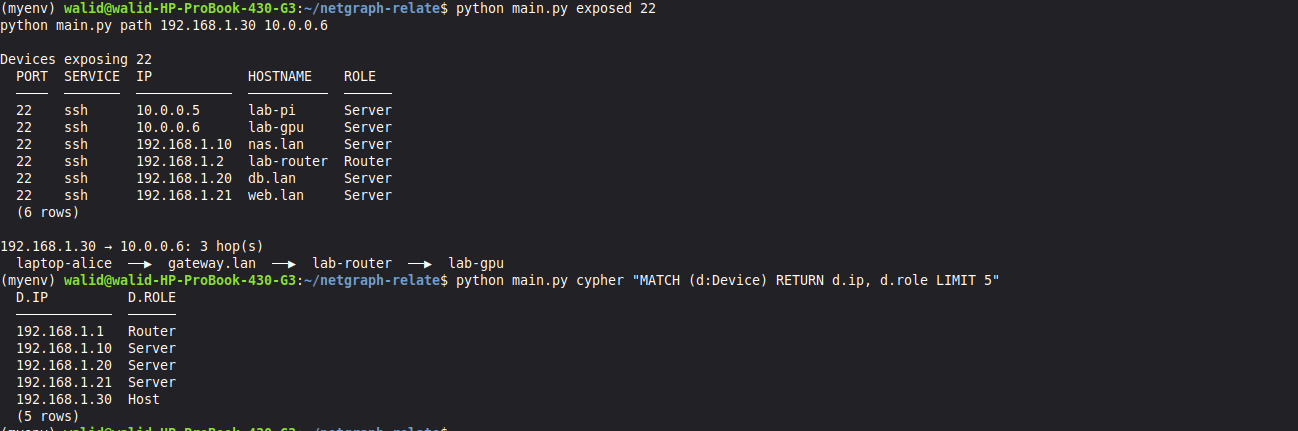
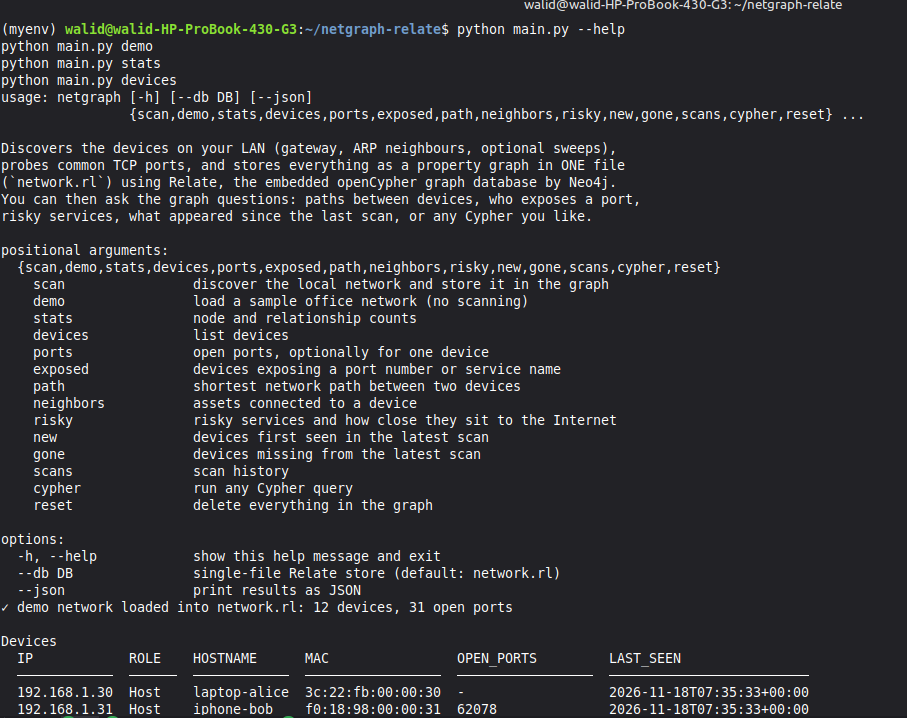
NetGraph is a fast, lightweight CLI tool that discovers active hosts, services, and network relationships, storing them persistently in a local Relate graph database. It allows network engineers and security analysts to:
- Scan live subnets or load a realistic office topology (
demomode). - Inspect network statistics, device roles, and exposed services/ports.
- Trace the shortest network path between any two assets.
- Detect network drift (
newandgonedevices across scans). - Execute custom Cypher queries directly from the terminal.
How I built it
- Language & CLI: Built in Python using
argparsefor clean subcommand routing. - Graph Engine: Powered by
relate-dbto storeDevice,Port,Network, andScannodes alongside relationships (EXPOSES_PORT,CONNECTS_TO,MEMBER_OF). - Network Discovery: Uses
scapyand standard Linux networking utilities.
Challenges we ran into
Designing a clean graph schema that handles multi-homed routers, dynamic port states, and cross-subnet pathfinding efficiently while keeping the CLI response time instantaneous.
Accomplishments that we're proud of
Delivering a zero-configuration local graph network analyzer where users can immediately run Cypher queries against their own network topology right from the command line.
What we learned
How naturally network topologies map to property graphs compared to relational tables, especially when running multi-hop pathfinding and exposure queries in Cypher.
What's next for NetGraph
Adding automated CVE vulnerability correlation for discovered service banners and an interactive web graph visualizer.
