-
-
neonpilot: probe your Arm chip, auto-tune llama.cpp, get receipts. Arm AI Optimization Challenge 2026 — Mobile AI track, Apache-2.0.
-
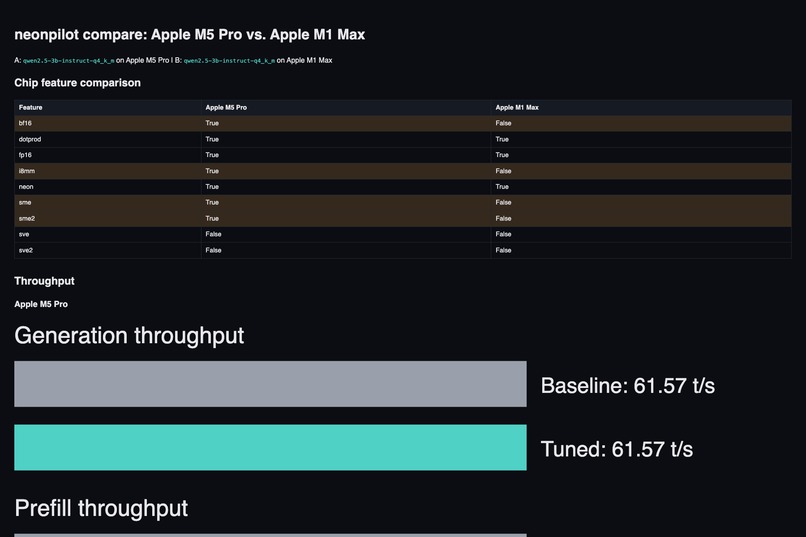
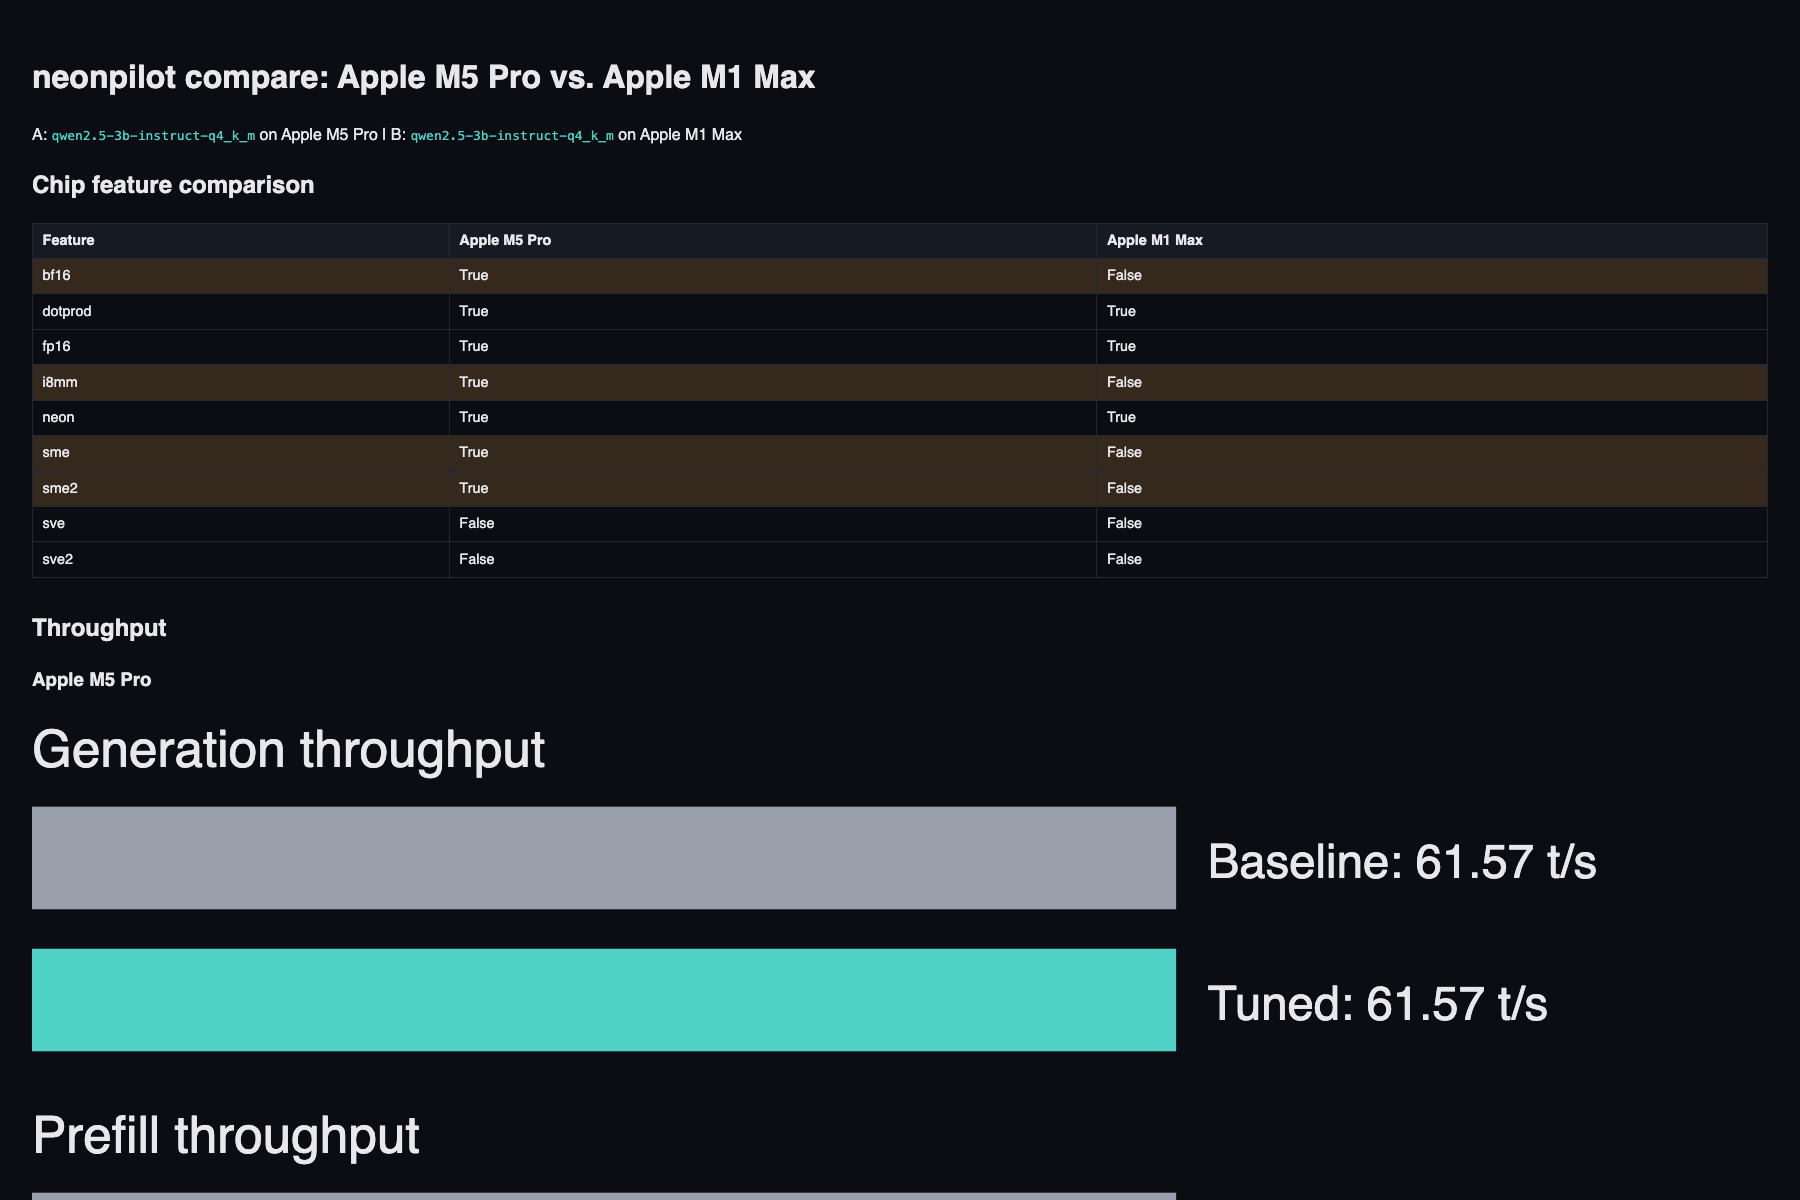
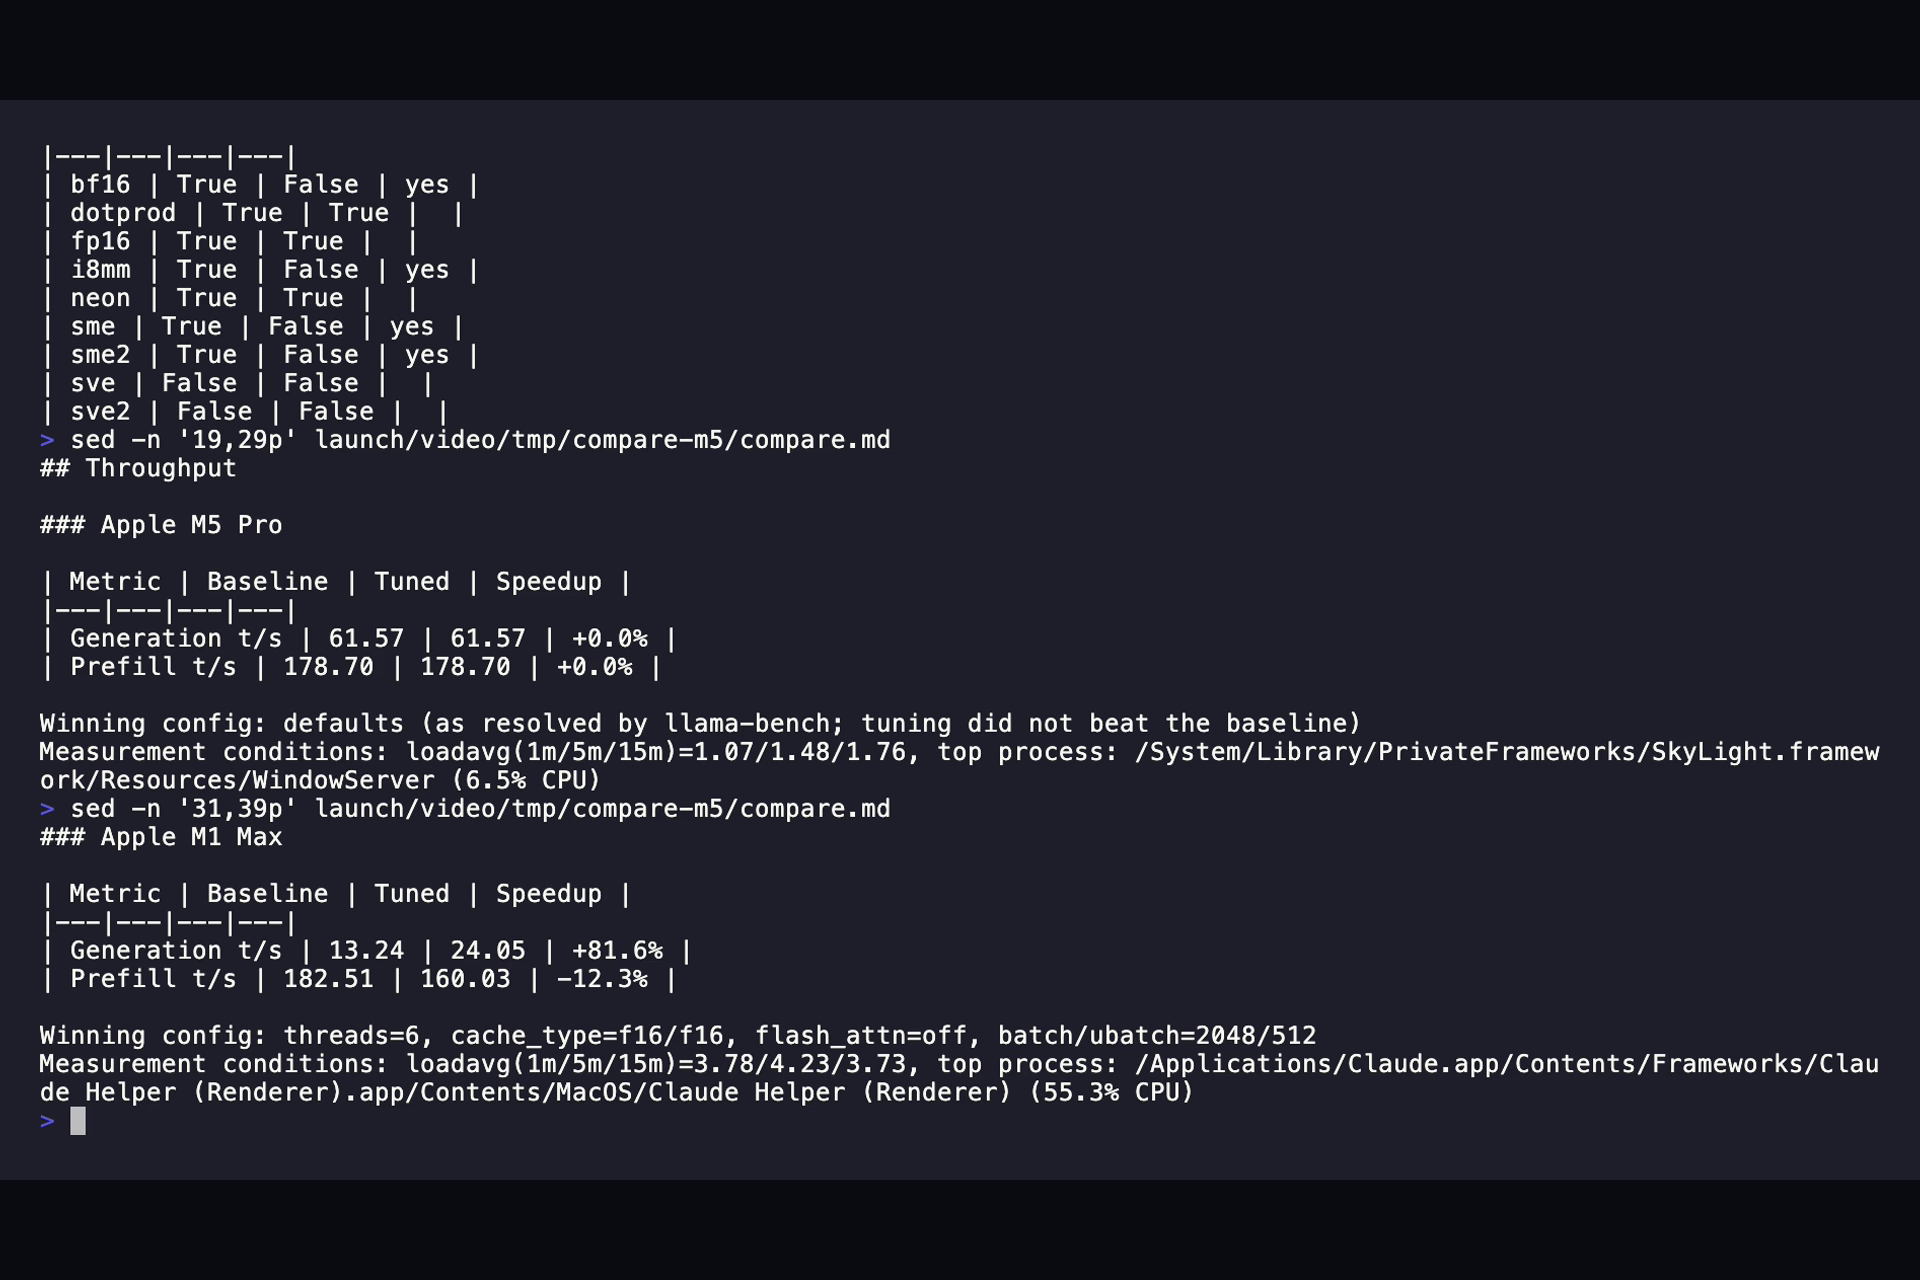
Cross-generation compare: M5 Pro (SME2, i8mm, BF16) vs M1 Max — ISA deltas highlighted, verdicts with recorded load conditions.
-
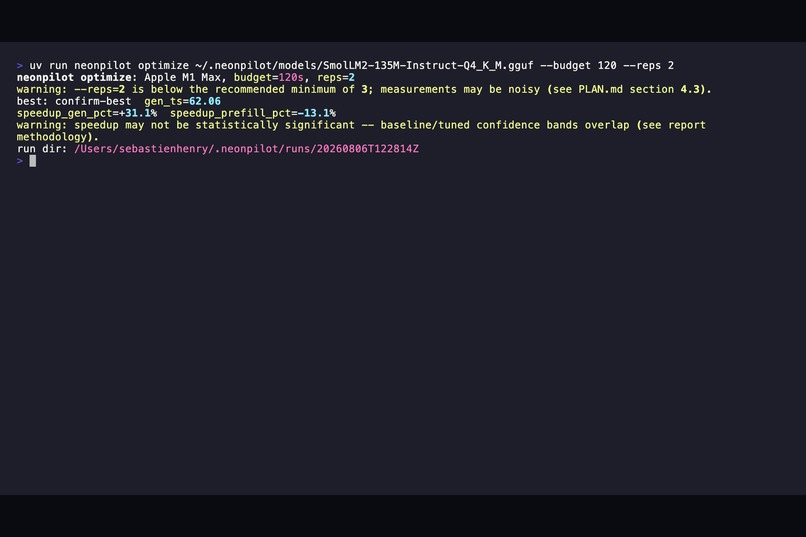
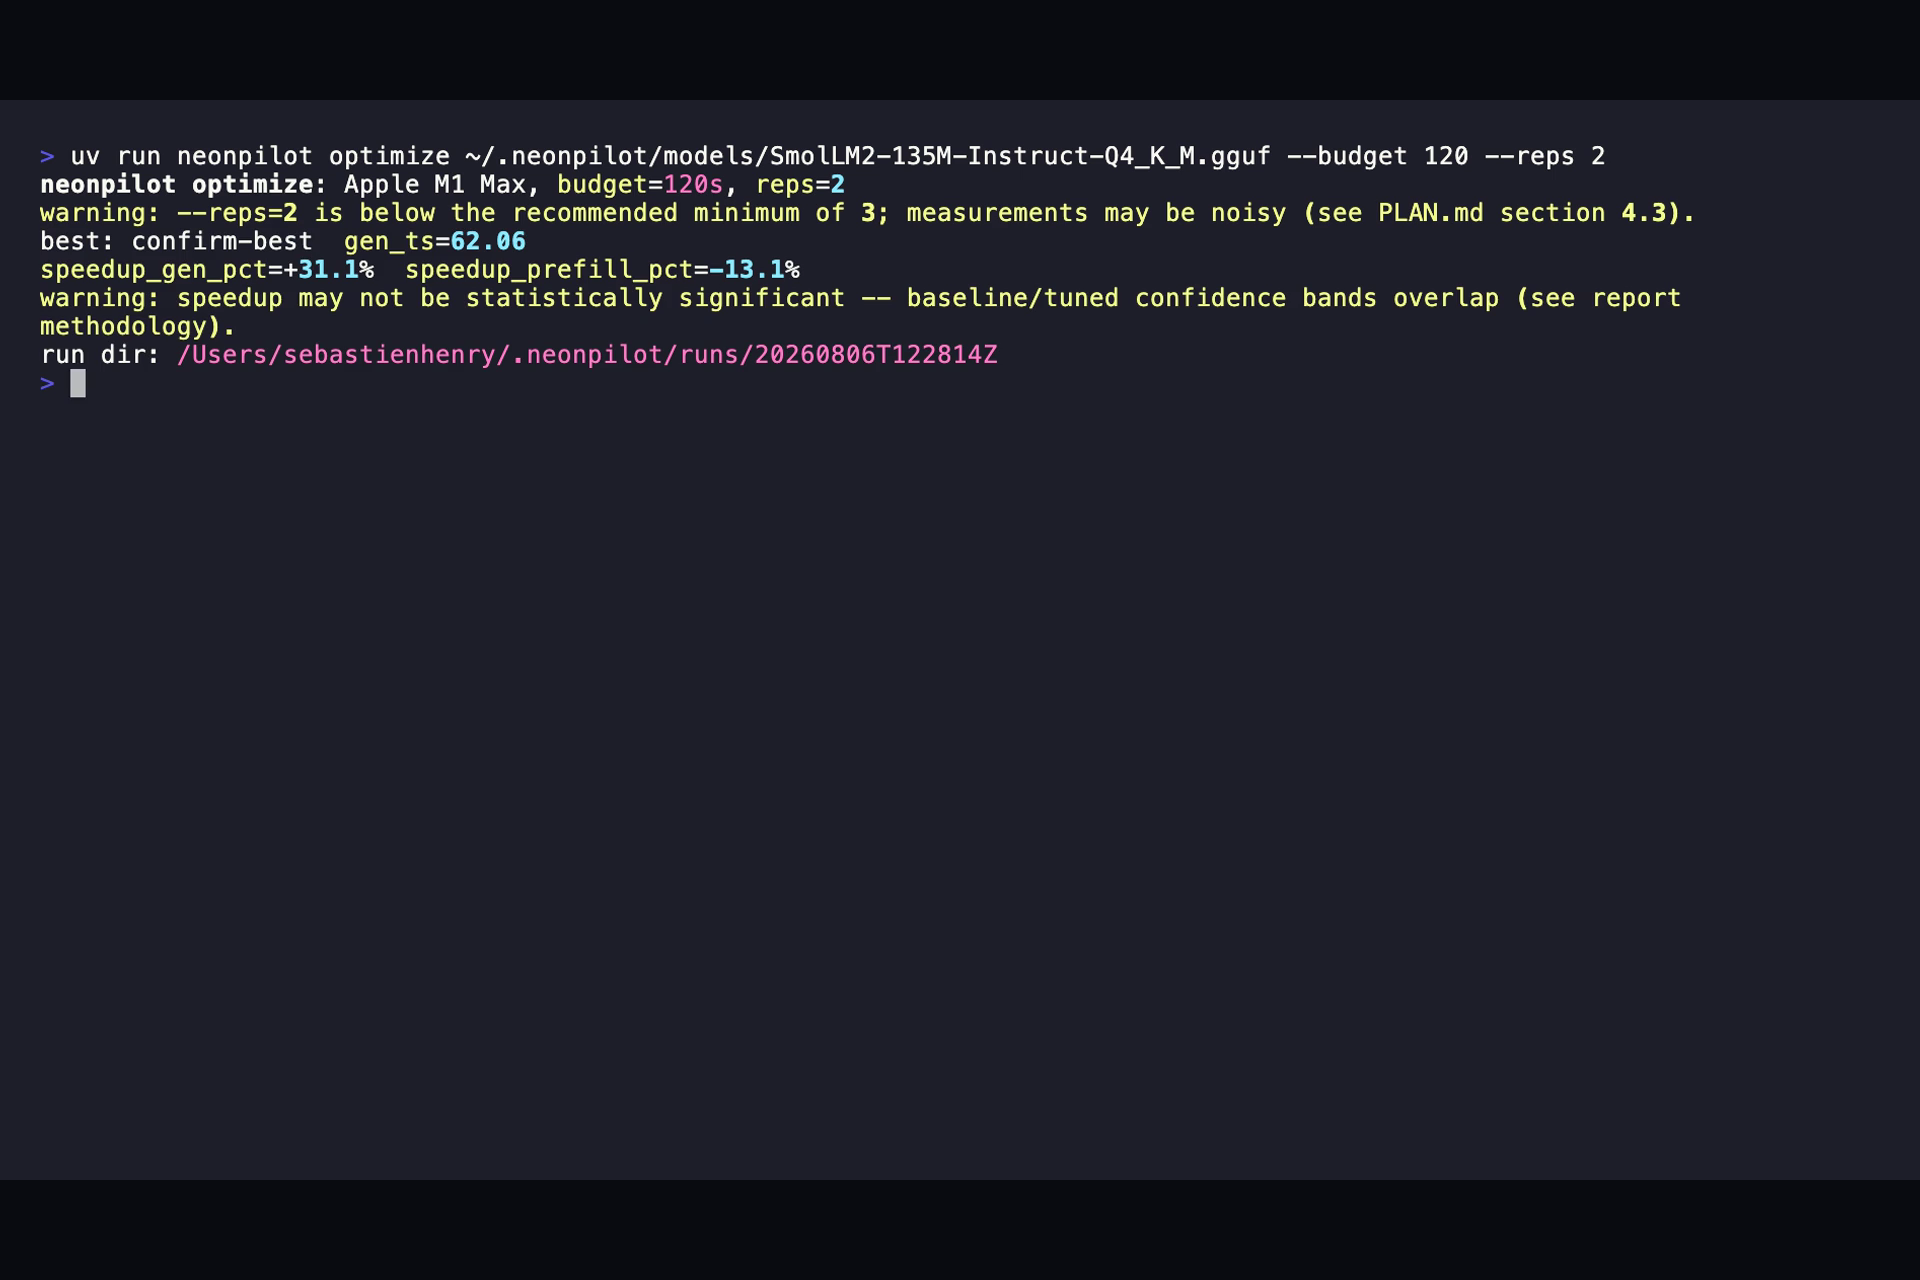
Honesty built in: low-rep runs and statistically insignificant speedups get flagged right in the CLI, never hidden.
-
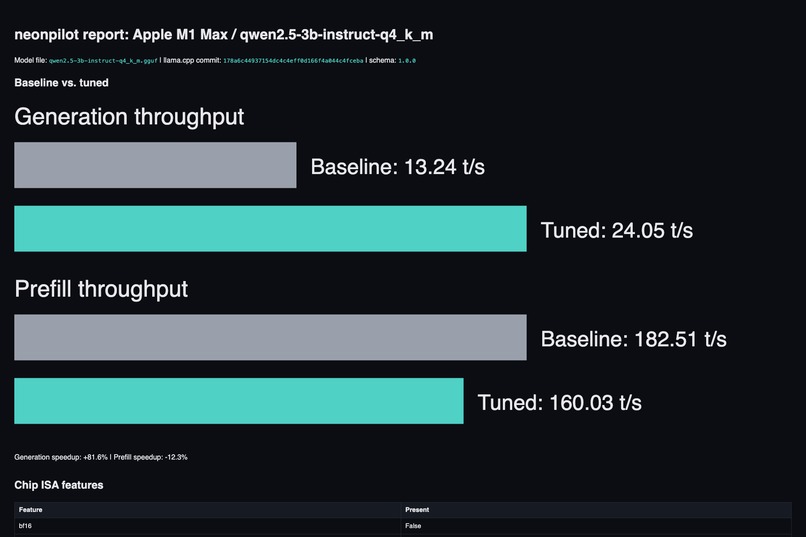
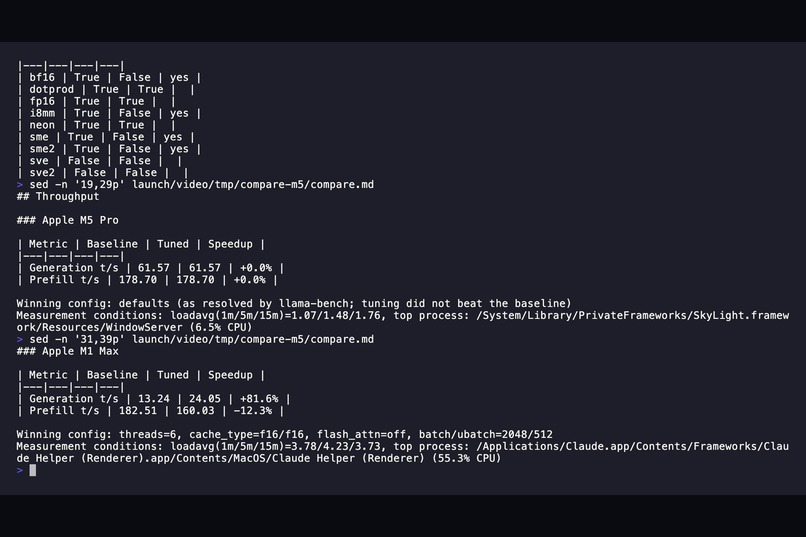
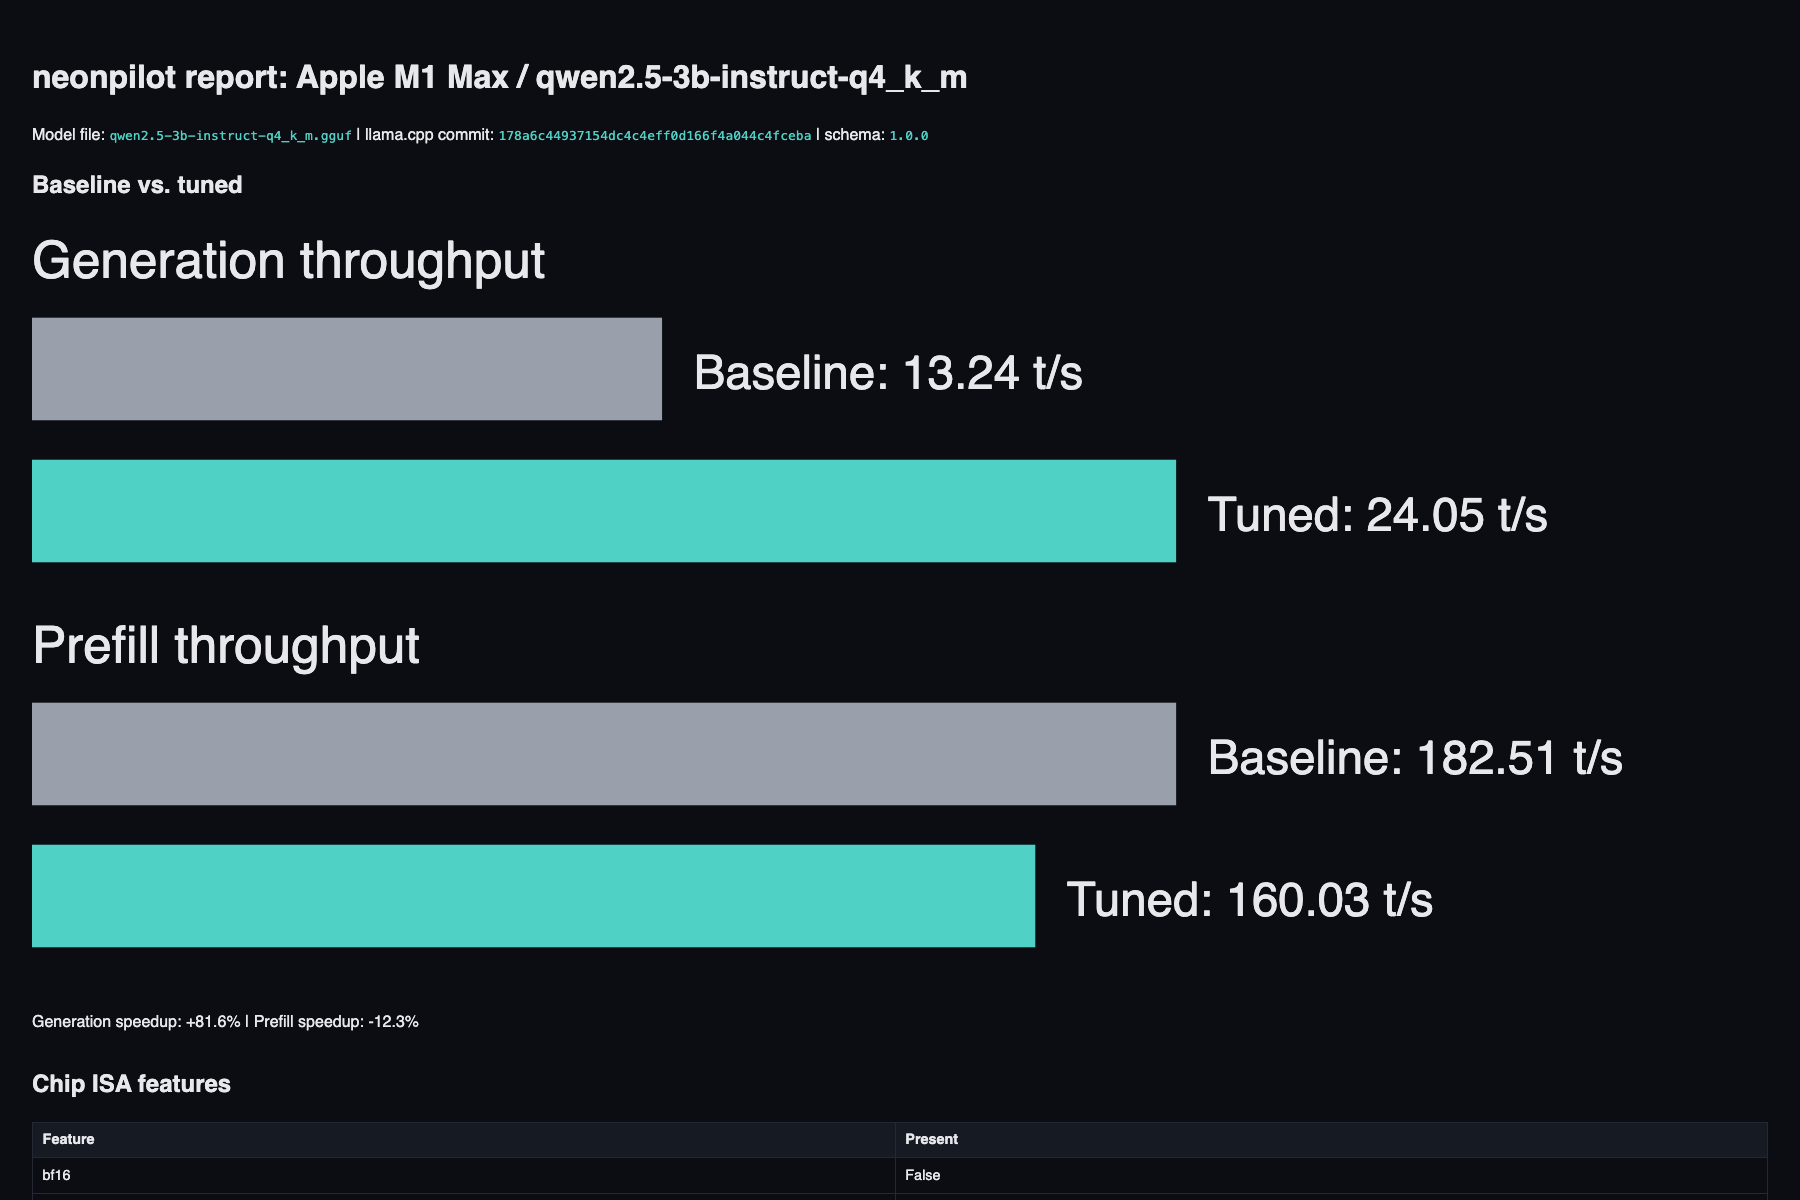
Self-contained HTML report (M1 Max under load): +81.6% generation by leaving cores for the machine's real workload.
-
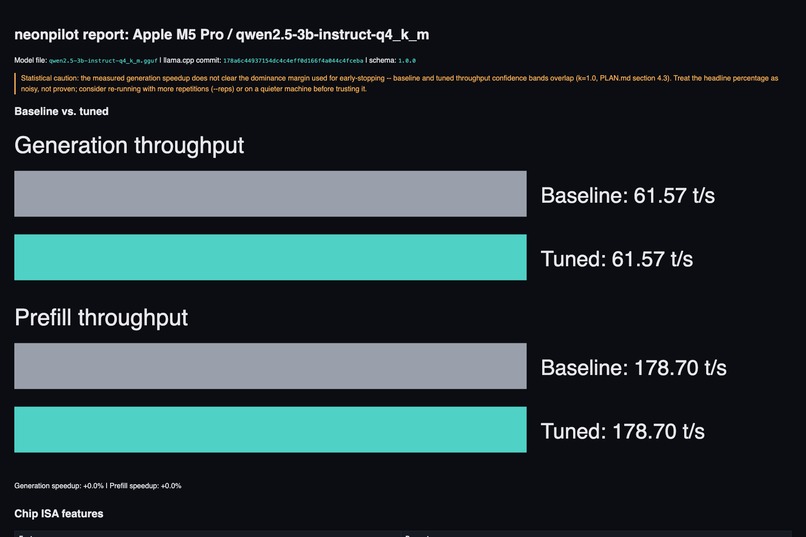
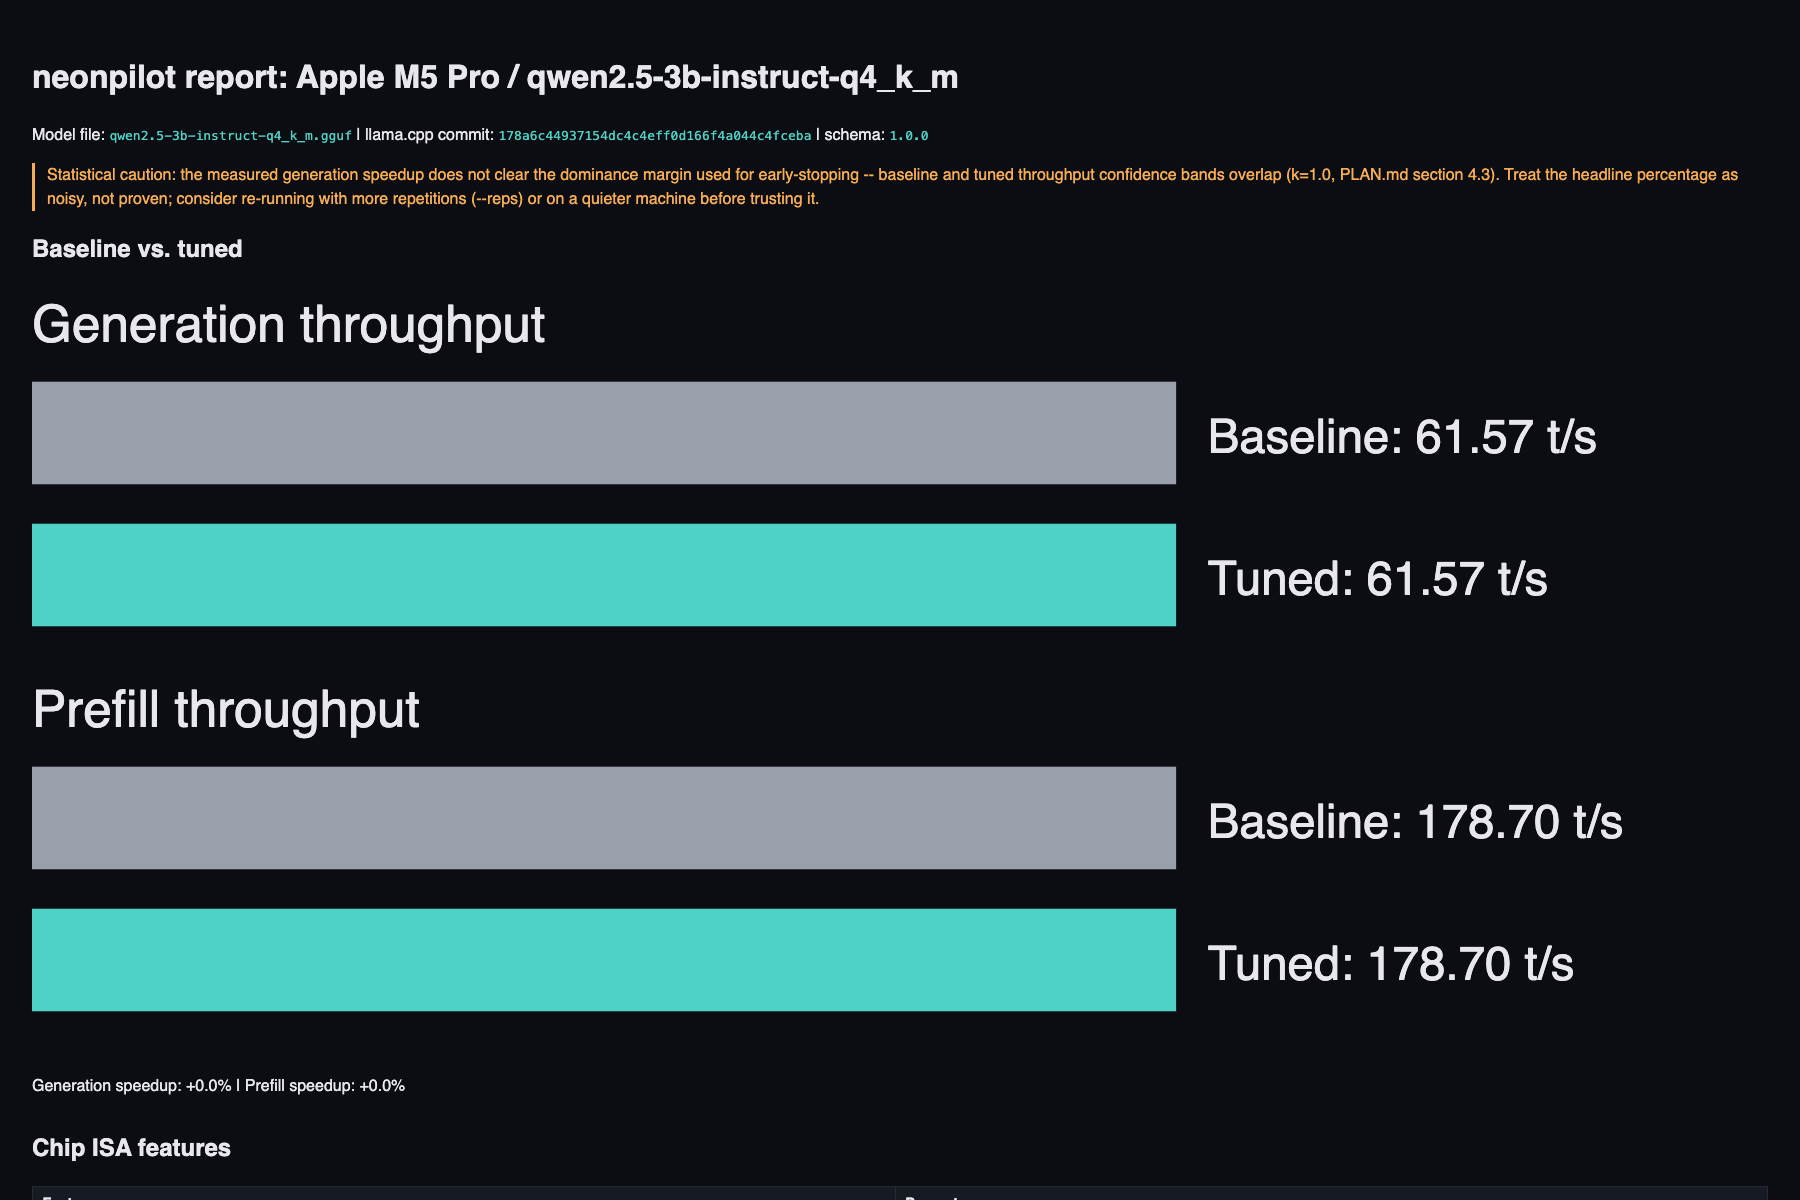
The credibility moment: on an idle M5 Pro, defaults are already optimal — neonpilot reports +0.0% and refuses to fake a win.
-
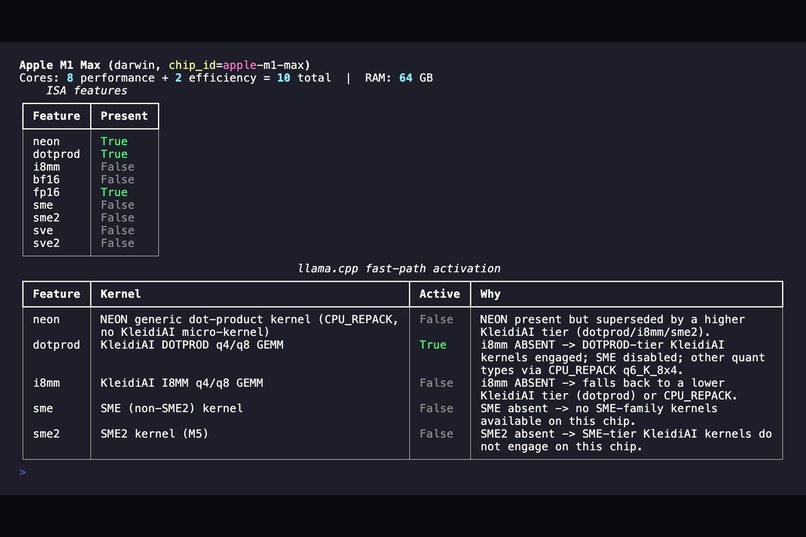
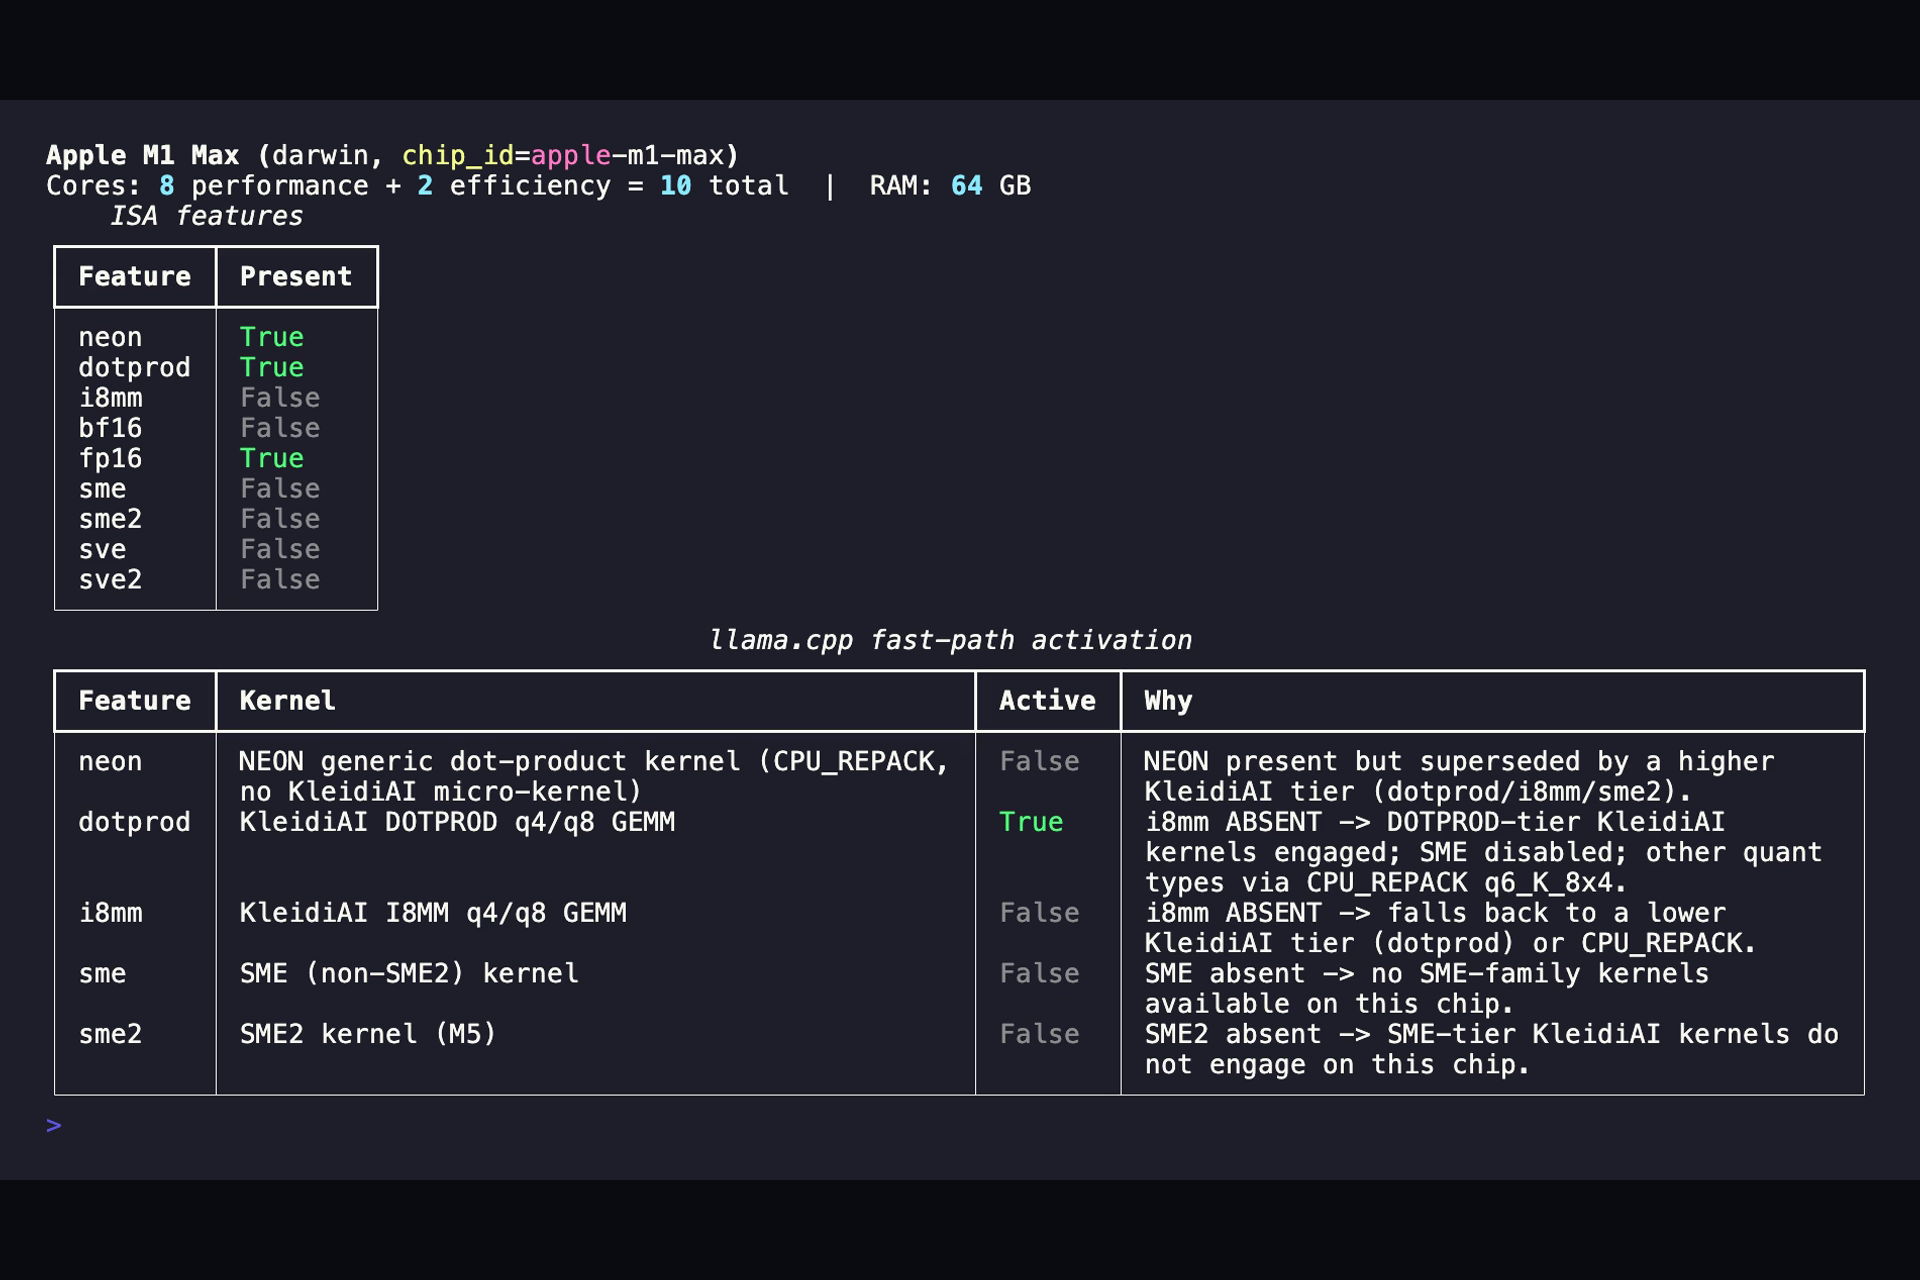
neonpilot probe on M1 Max: ISA table plus which llama.cpp KleidiAI kernel tier actually engages — verified, not assumed.
-
One command, two committed runs: idle M5 Pro defaults win (+0.0%, preset refused); loaded M1 Max gains +81.6% by adapting.
Inspiration
llama.cpp's defaults assume your machine is idle. It never is. Mine runs Docker, a VM, and Webex while I work — and when an LLM inference engine grabs all eight performance cores on a loaded machine, its per-layer thread barrier means one busy core stalls every token. I wanted a tool that tunes inference for the Arm chip — and the machine state — you actually have, not the one in the spec sheet.
Two other entrants in this very challenge were already building generic "Arm LLM auto-tuners," so honesty became the differentiator: every number this tool reports comes with machine-recorded receipts, and it would rather print +0.0% than fabricate a win.
What it does
Five commands, one pipeline:
neonpilot probe— reads the Arm ISA feature flags (NEON, dotprod, i8mm, SME/SME2, BF16) and core topology, and explains which llama.cpp fast paths will actually engage — e.g. on M1 Max, KleidiAI activates its DOTPROD-tier kernels (verified from build logs, not assumed).neonpilot optimize— a staged, thermally-guarded benchmark sweep (threads → flash-attention × KV-cache → batch sizes → back-to-back confirm pass) with median±stddev over ≥3 reps, early stopping, a hard time budget, and an ambient-load preflight. It records loadavg and top CPU consumers into the run artifacts.neonpilot report— a self-contained HTML/Markdown report (zero external assets) including the measurement conditions.neonpilot apply— packages the winner as a shareable per-chip preset — and refuses if no config beat the baseline with statistical significance.neonpilot compare— side-by-side cross-machine reports with ISA-delta highlighting.
How we built it
Python 3.11 (Typer/Rich, frozen dataclasses, strict boundary validation) wrapping a pinned llama.cpp build (b10069, CPU-only, Metal deliberately off — this is an Arm CPU story). The staged search parses llama-bench JSON via a single hardened subprocess boundary. 290 tests at 97% coverage, including golden-file report tests and integration tests that run the real binary against a 100 MB model — in CI, on GitHub's macos-arm64 runners. Development ran as an agent pipeline with adversarial review gates: a plan critic (3 rounds to pass), an independent robustness reviewer (13 findings, all fixed and re-reproduced), a security audit, and a solution verifier that re-runs everything itself.
Challenges we ran into
- A +394% "speedup" that was pure noise. An early 2-rep run produced an absurd headline number. Root cause: measurement noise on a busy machine. The fix became a feature: a statistical dominance guard that flags any result whose error bands overlap — the same test the search engine uses internally.
- The "idle reference" that never was. Every attempt at a clean baseline on my M1 Max got contaminated — once by Docker at 54% CPU, once by a VM restarting mid-benchmark. Instead of fighting it, we built load telemetry: every run records its own conditions, and the tool warns you when your numbers aren't reference-grade. My workstation's chaos became the product's best demo.
- CI reality check. llama.cpp cold-builds in ~4 minutes on my M1 Max — and 26 minutes on GitHub's shared 3-core runner, blowing the job timeout. Split cache save/restore so one successful build seeds every future run (now ~75 seconds).
Accomplishments that we're proud of
- +144.2% and +81.6% generation speedups on a loaded M1 Max — real, reproducible, receipted — by leaving cores for the machine's actual workload.
- The M5 Pro result: +0.0%. On genuinely idle modern silicon (SME2, i8mm, BF16 — all probe-verified), llama.cpp's defaults won, and neonpilot said so and refused to package a preset. A benchmark tool you can trust is one that can say "nothing to improve."
- A measured ~2.6× cross-generation uplift (same GGUF, M5 Pro defaults vs M1 Max best-tuned) and a committed M5↔M1 comparison report anyone can regenerate from the repo.
What we learned
That the interesting performance frontier on consumer Arm hardware isn't peak tokens/sec — it's robustness to reality. llama.cpp's defaults are excellent on idle machines; the wins live in adapting to load. We also learned our own tooling's limits the honest way: our search once explored the wrong thread neighborhood when the baseline dominated early — the confirm pass caught it, and the wart is documented in the repo rather than hidden.
What's next for neonpilot — auto-tune llama.cpp for Arm CPUs
Fix the documented stage-winner selection wart; Linux/Graviton validation (the probe already parses /proc/cpuinfo); a community preset registry with idle-run-only admission enforced by the load receipts; and wider tuning surfaces — speculative decoding and quant-format recommendation.

Log in or sign up for Devpost to join the conversation.