-
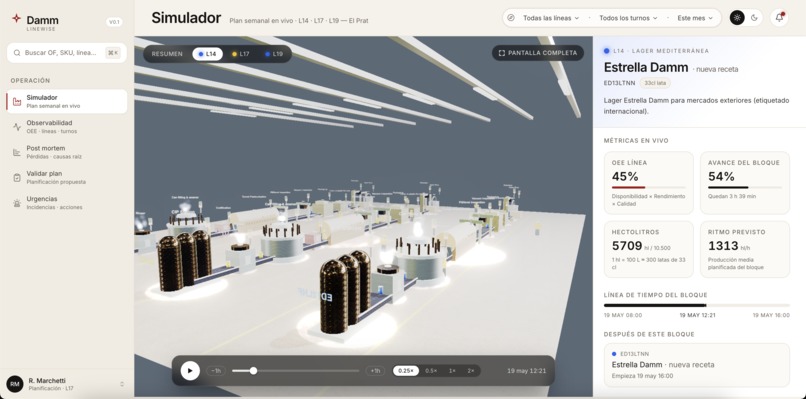
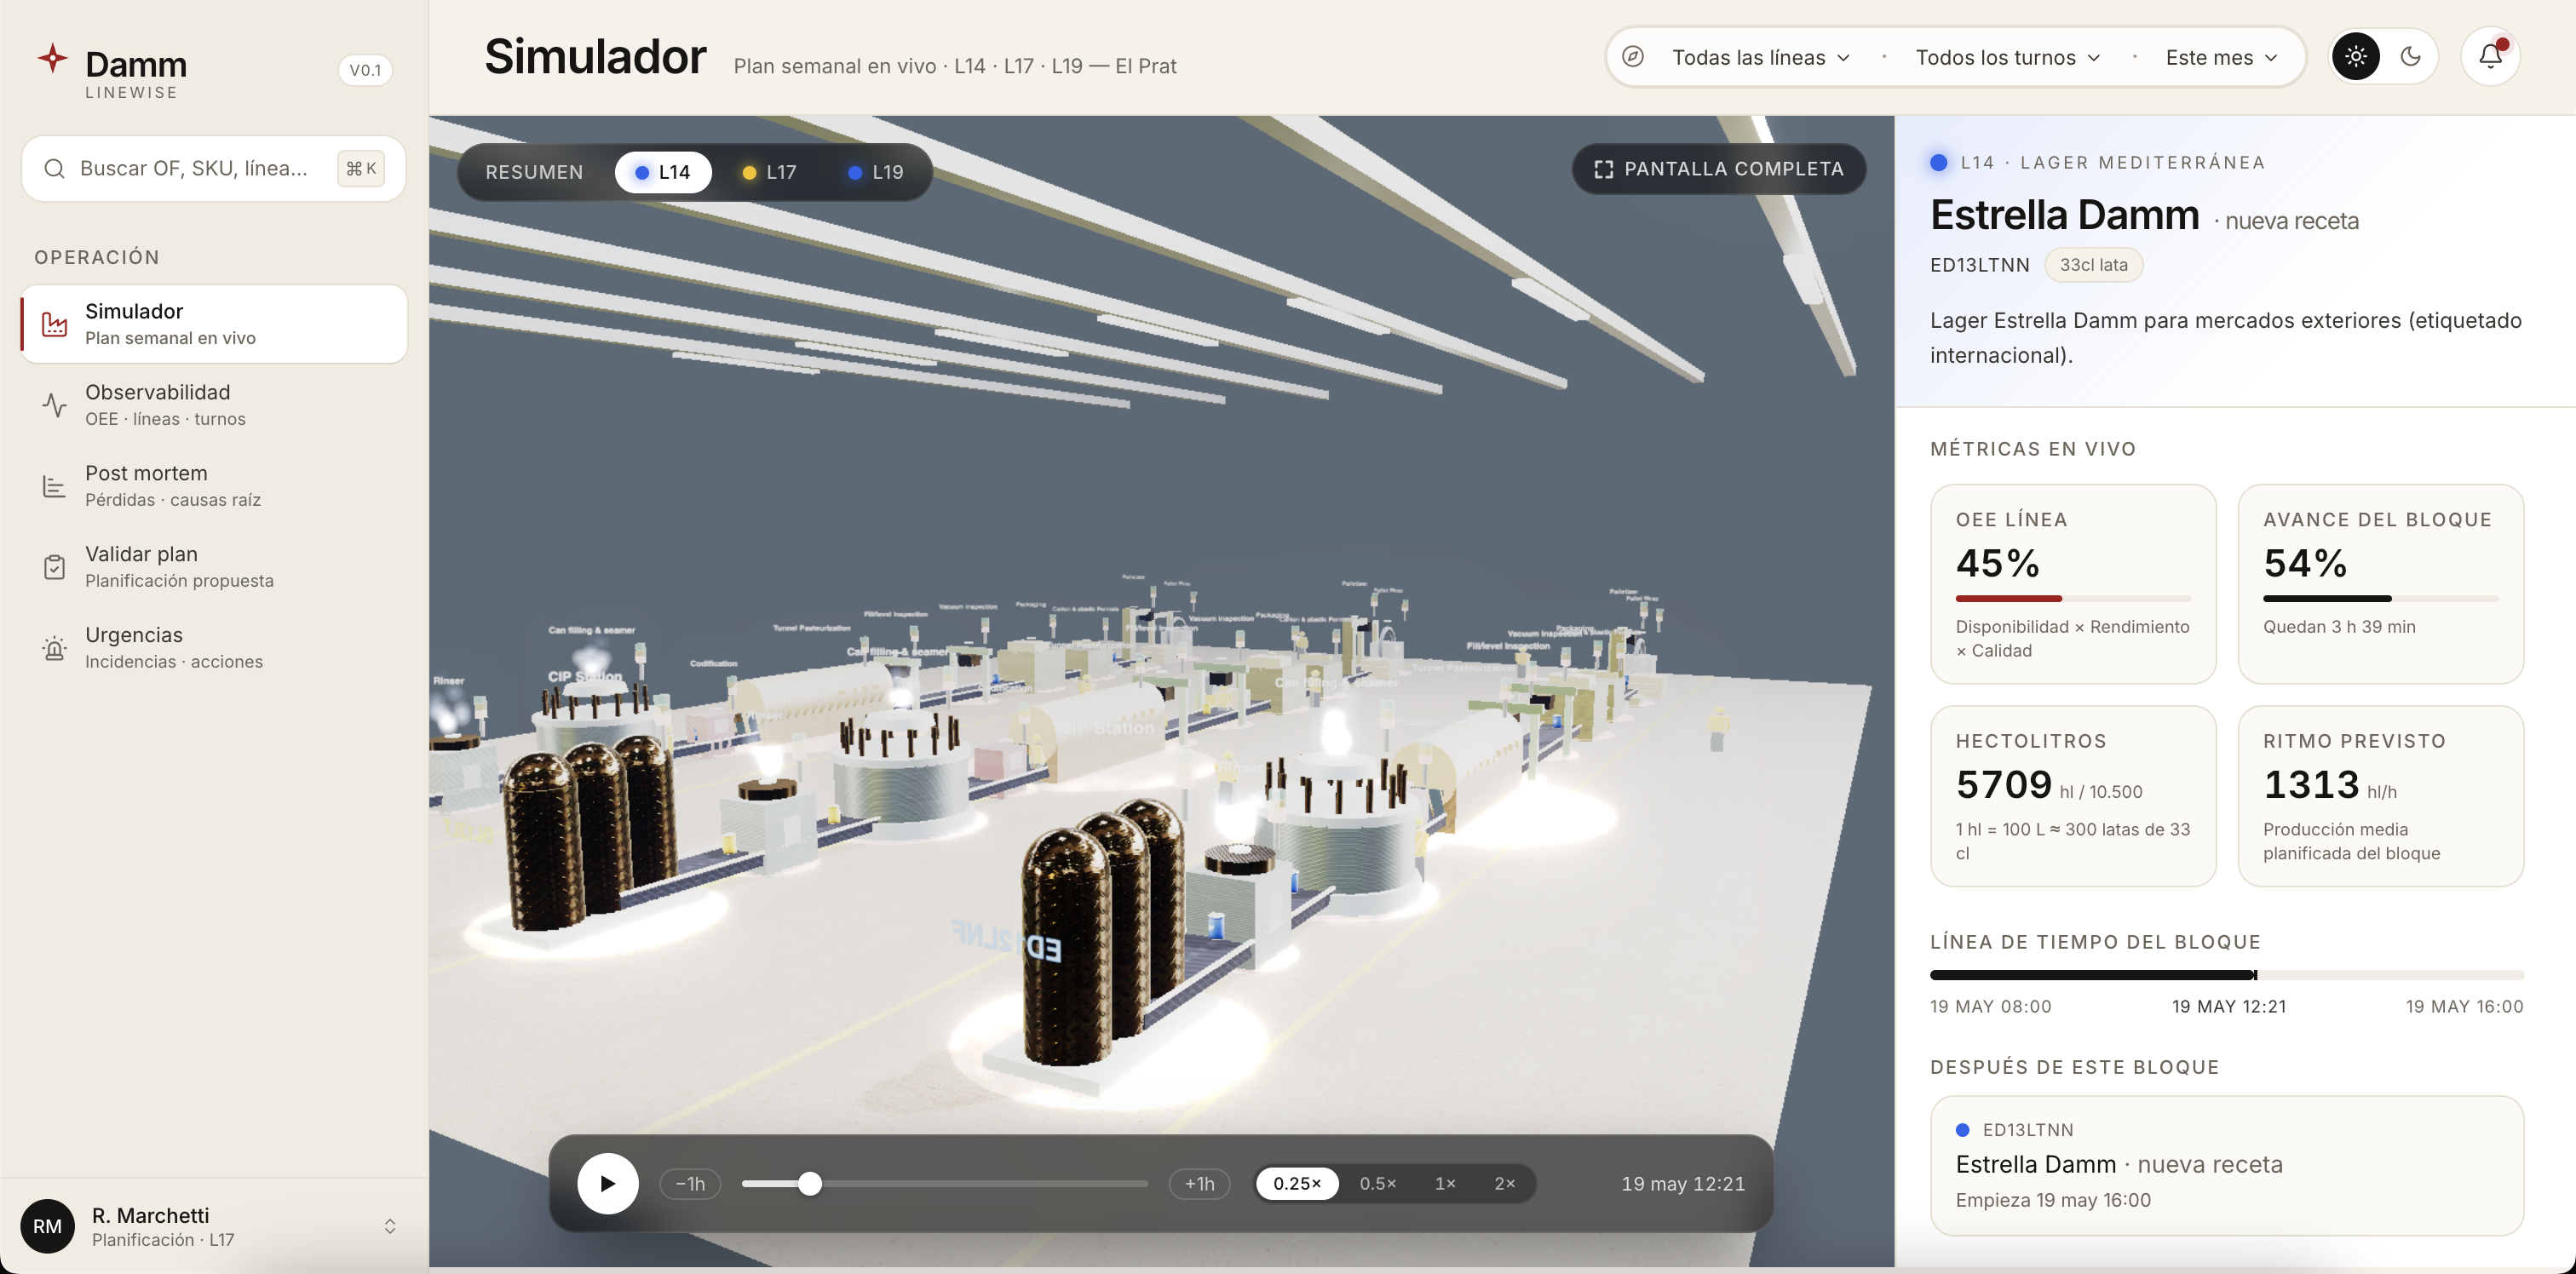
Production Line Render
-
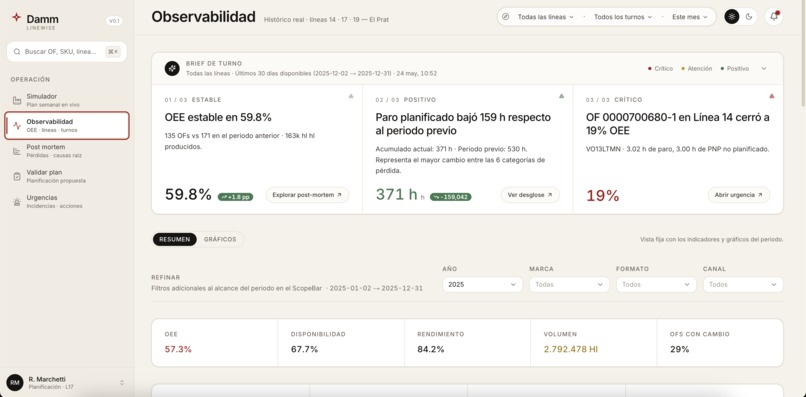
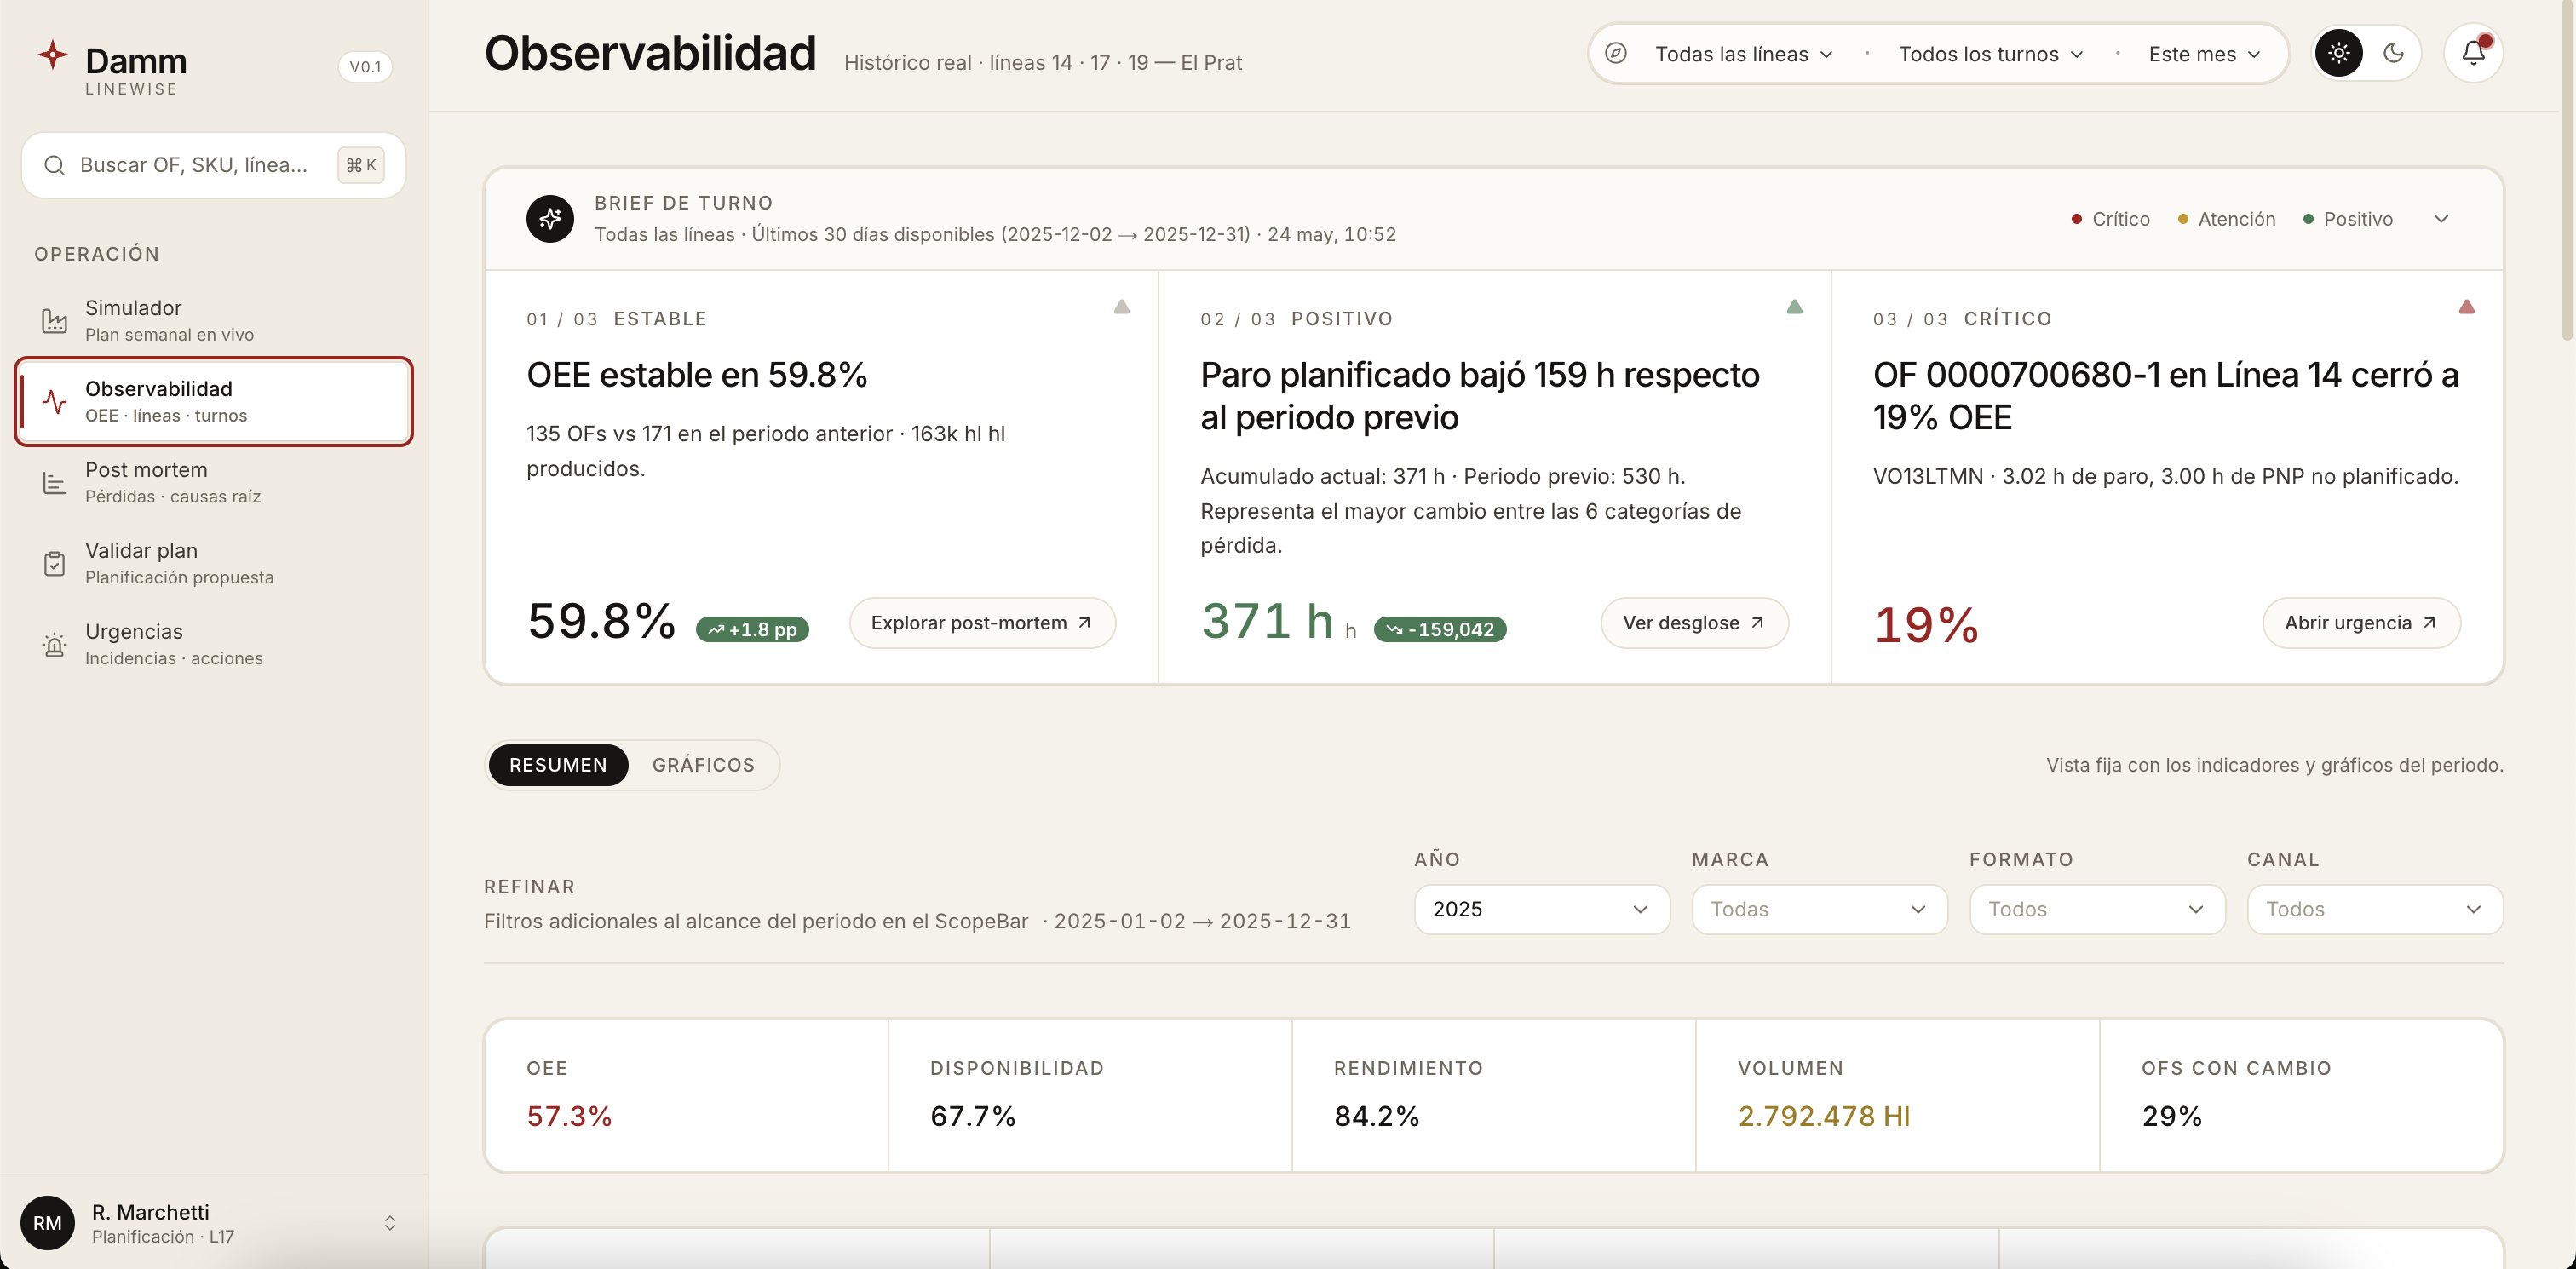
Observability
-
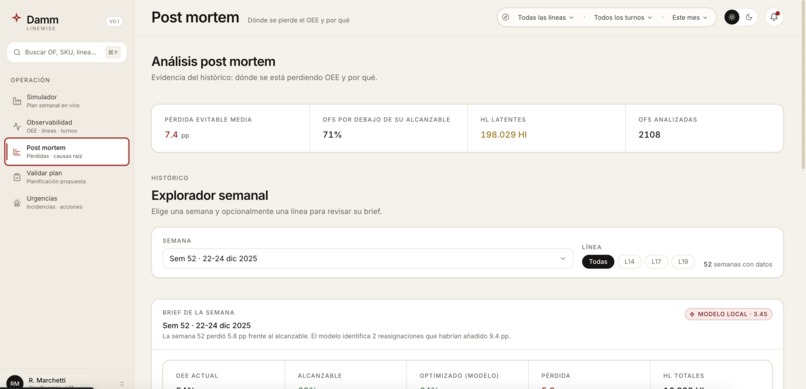
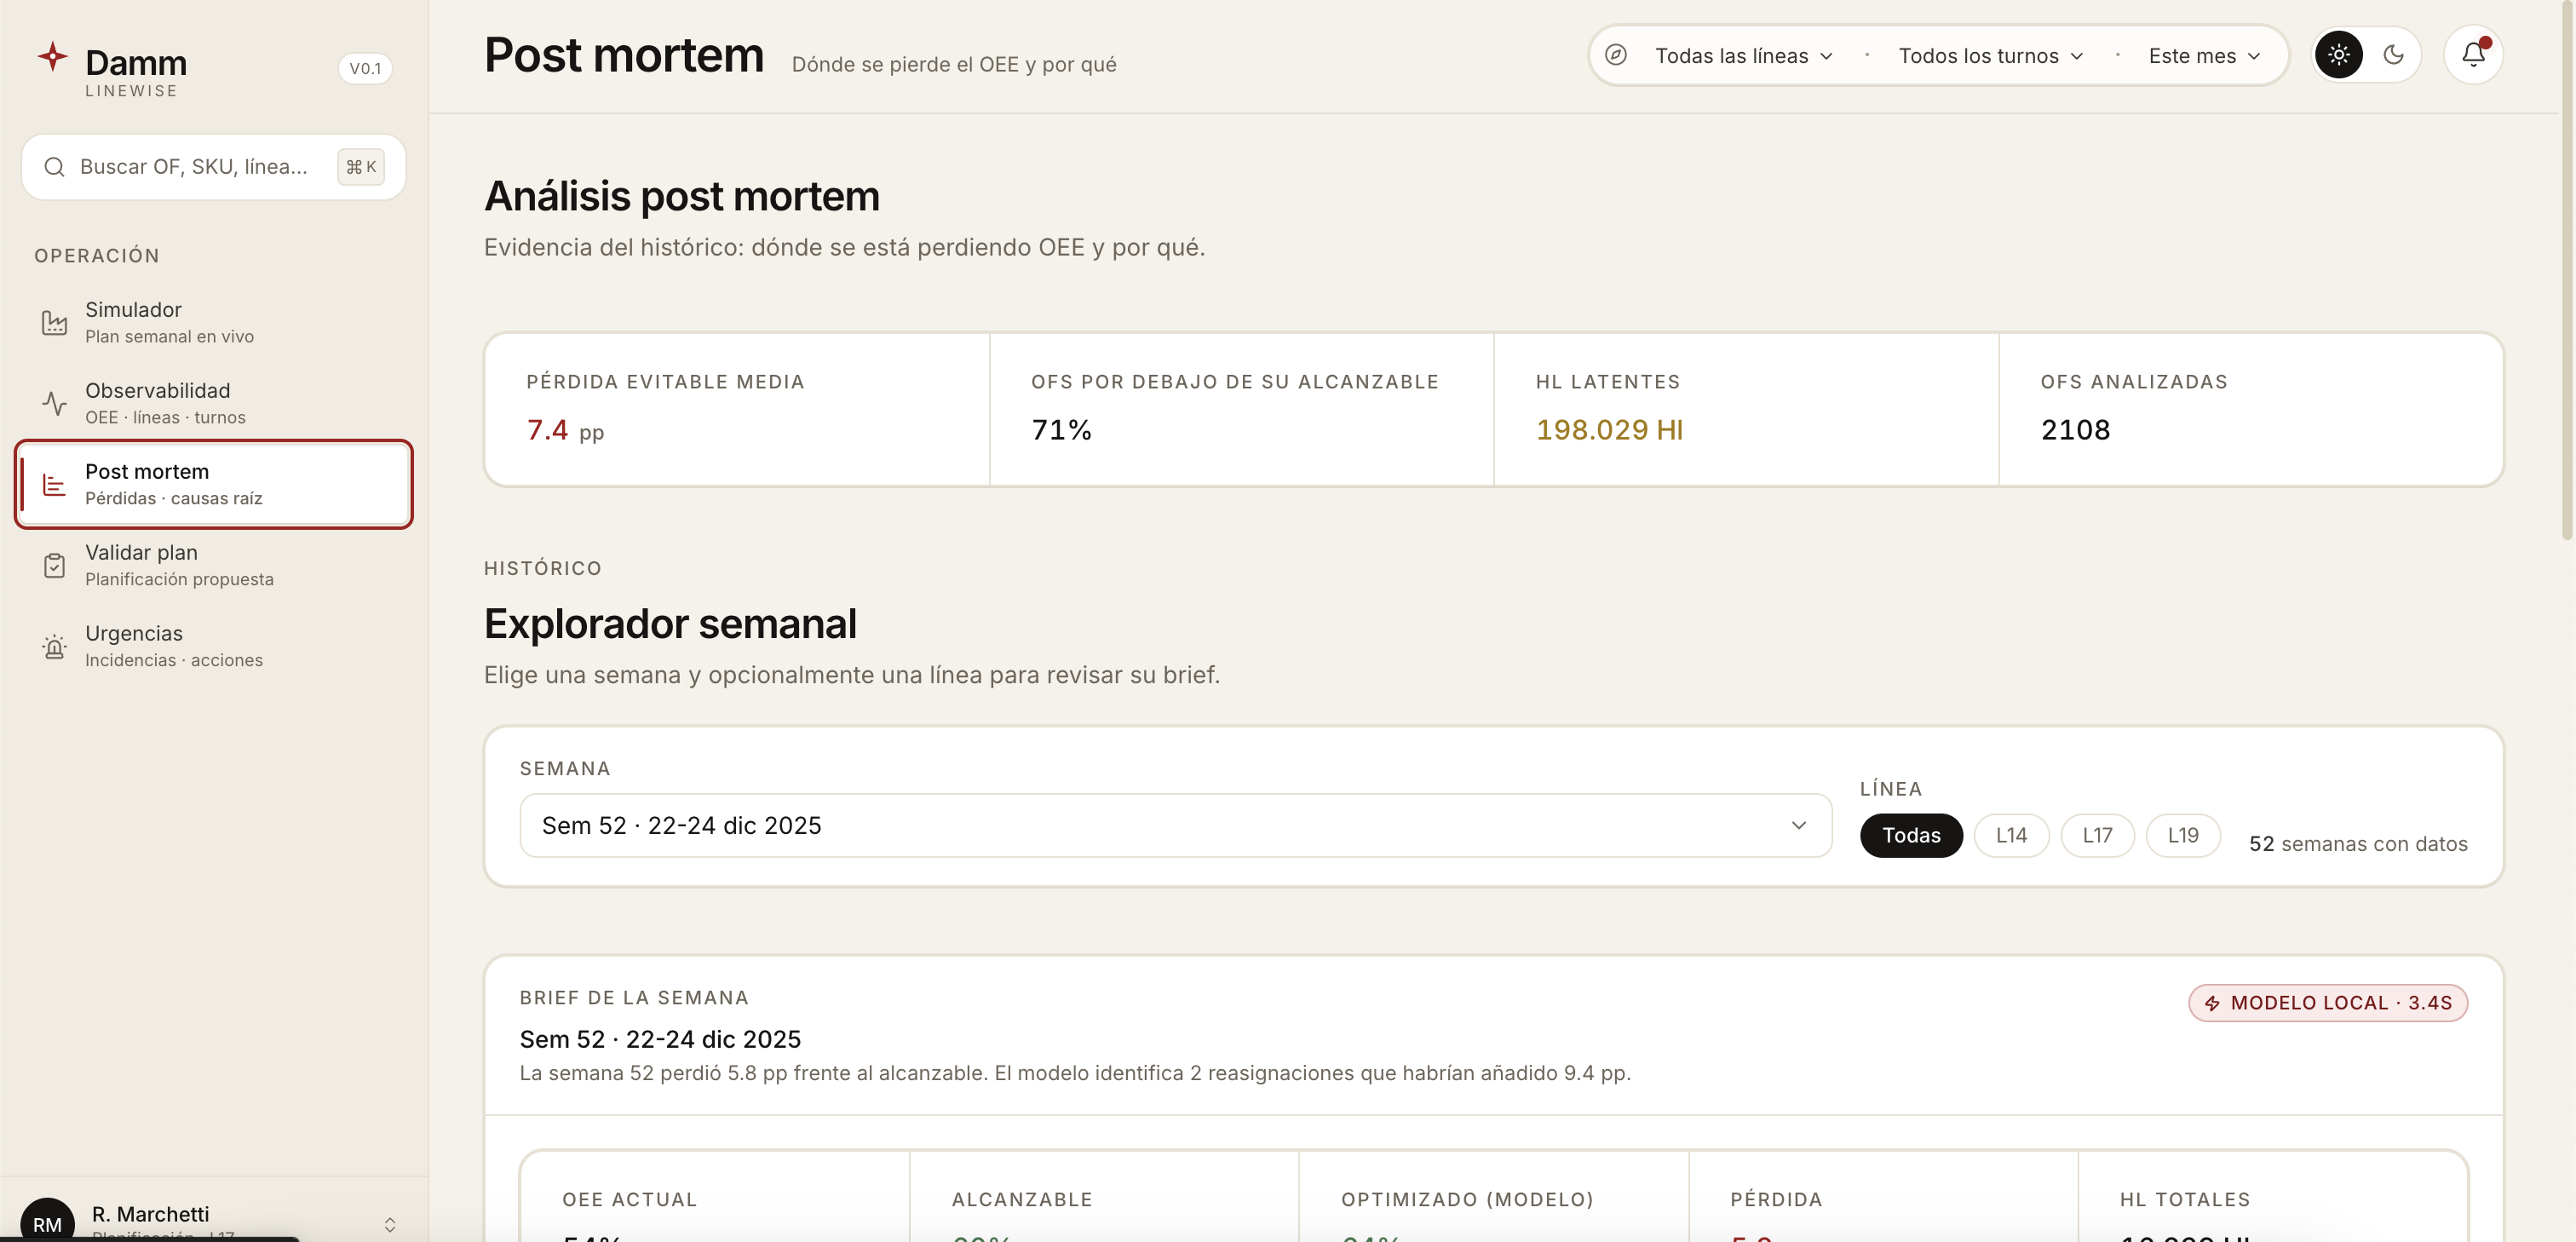
Post Mortem
-
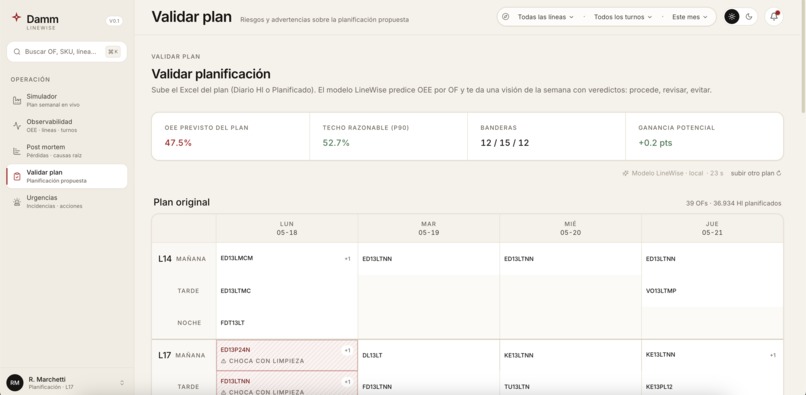
Planner
-
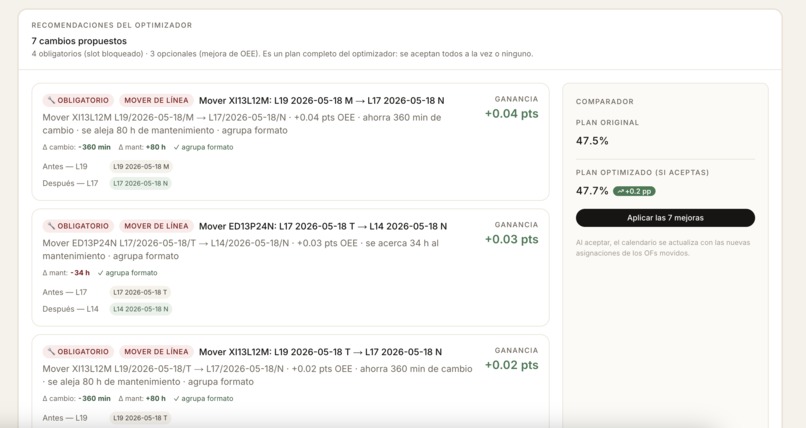
Proposed Optimizations
Inspiration
Damm's canning lines L14, L17 and L19 at El Prat produce hundreds of millions of cans a year. Their planner uses Blue Yonder, which schedules with theoretical changeover times — a number from a spec sheet. Reality is different: format changes, warm-ups after CIP, micro-stops, the SKU mix of the day, who's on shift.
Across 2.141 production orders in 2025, the mean OEE on these three lines was about 49%. The historical p90 — the achievable ceiling on a good day, with the same machines and the same people — was about 68%.
That gap is roughly $68\% - 49\% = 19$ points. Conservatively, half of it is plan-driven (sequencing, format affinity, line choice) rather than physical. Nobody was harvesting that ten-point gap systematically. Every point on these lines is millions of cans. That's what we built for.
## What it does
LineWise is a planning platform for Damm's canning hall. It has four moves:
- Observability. A 2025-history dashboard with KPIs, a chart-builder, and a natural-language Ask bar that translates a question into a DuckDB query against the
fact_runstable. - Validate plan. The planner uploads next week's Excel (
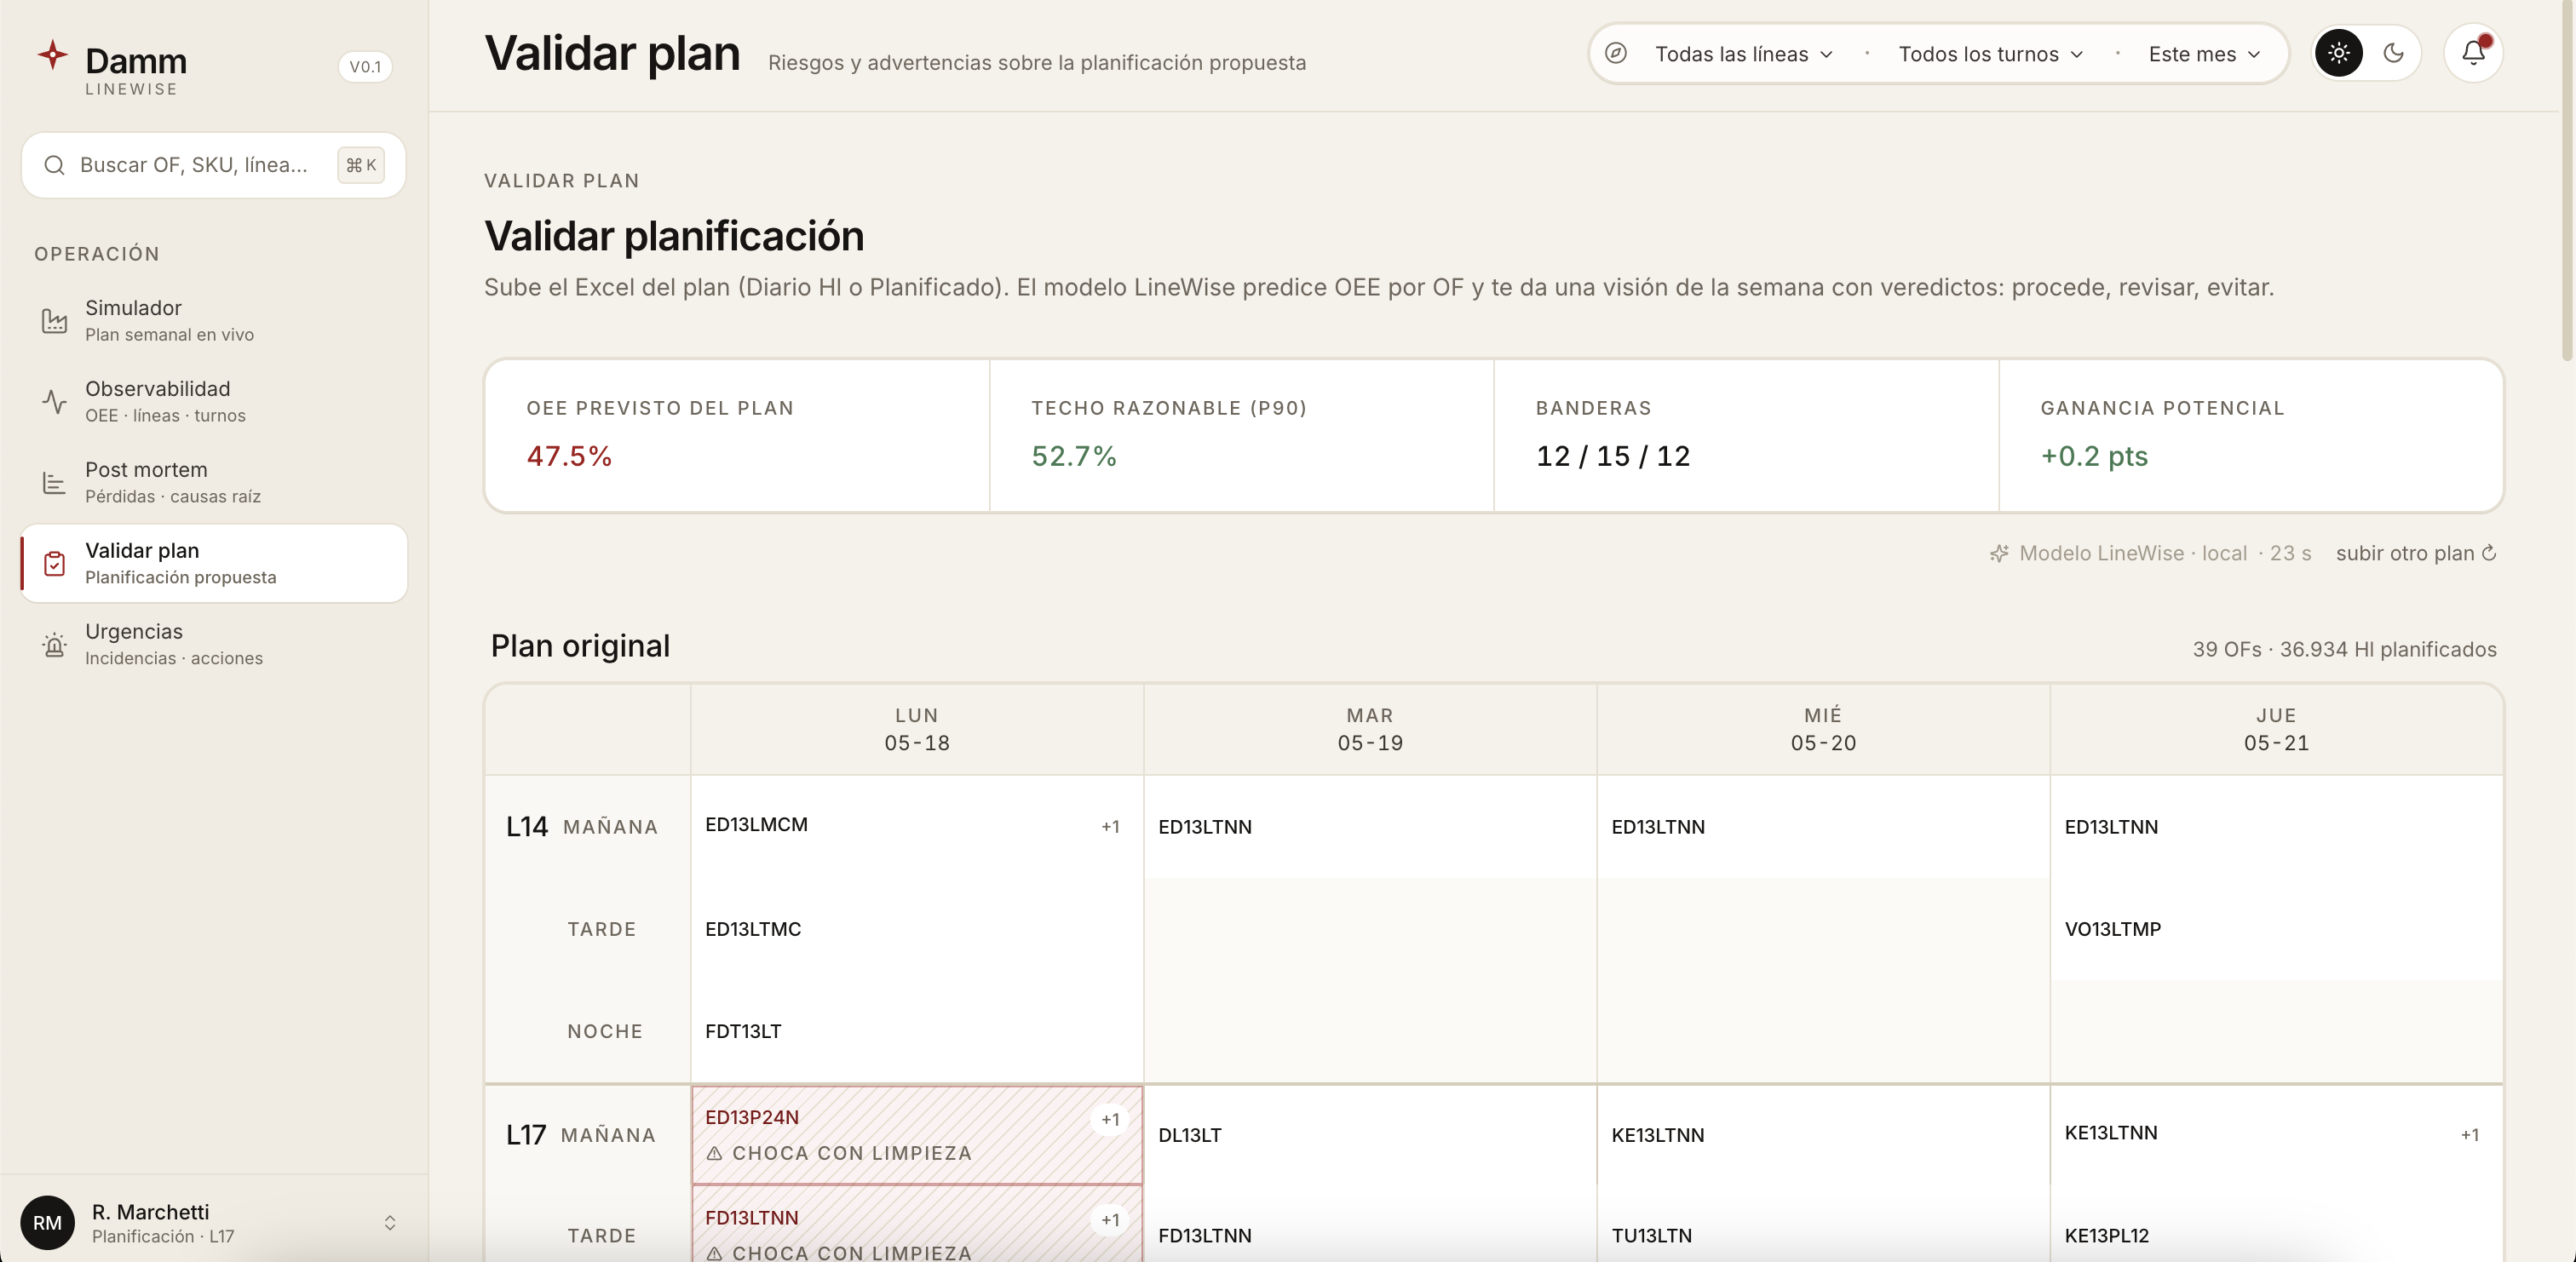
Planificado produccionesorDiario Hl_Planif) and gets a per-OF verdict — 🔧 Obligatorio · 💡 Opcional · ⭐ Prioritario · ⚠️ Desplazado · ↪️ Realojo — with the SHAP drivers behind each prediction. - Post mortem. Root-cause attribution for past weeks: which factors explain the gap between the plan's expected OEE and what actually happened.
- Emergencies. Reactive replanning. Declare an avería (line out in a given turno) or inject a last minute order; the model re-optimizes the remaining shifts in seconds and shows the OEE impact before the planner applies it.
A three.js scene renders the factory floor in real time, color-coded by predicted OEE per (línea, turno) — the same numbers the dashboard shows, made tangible.
## How we built it
### Predict — quantile regression on real history
We trained twelve LightGBM models: four labels (OEE, Disponibilidad, Rendimiento, Calidad) times three quantiles ($\alpha \in {0.10, 0.50, 0.90}$). Quantile regression minimizes the pinball loss
$$ \mathcal{L}_\alpha(y, \hat{y}) = \begin{cases} \alpha (y - \hat{y}) & \text{if } y \geq \hat{y} \ (\alpha - 1)(y - \hat{y}) & \text{otherwise} \end{cases} $$
so the model learns three different views of the same outcome: a pessimistic floor (p10), an expected value (p50), and an achievable ceiling (p90). Planners don't just get "we expect 78% OEE" — they get "between 71% and 84%, with the upside reachable if changeover holds."
Training set: 1.670 OFs, 84 columns, January → September 2025. The features are everything a planner knows before the OF runs: SKU identity, family, format (1/3, 1/2, 2/5), packaging hierarchy, previous OF on the same line, theoretical changeover minutes, recent line and SKU history (7d and 30d windows), pair-transition statistics, maintenance proximity, calendar parts. Categorical variables go in natively — no one-hot blow-up.
Hyperparameters: 1.500 trees, 31 leaves, early stopping at 50 rounds on a time-ordered inner holdout. No future leakage — the model is never allowed to see what comes after the date it's predicting.
### Optimize — constraint-aware sequencing
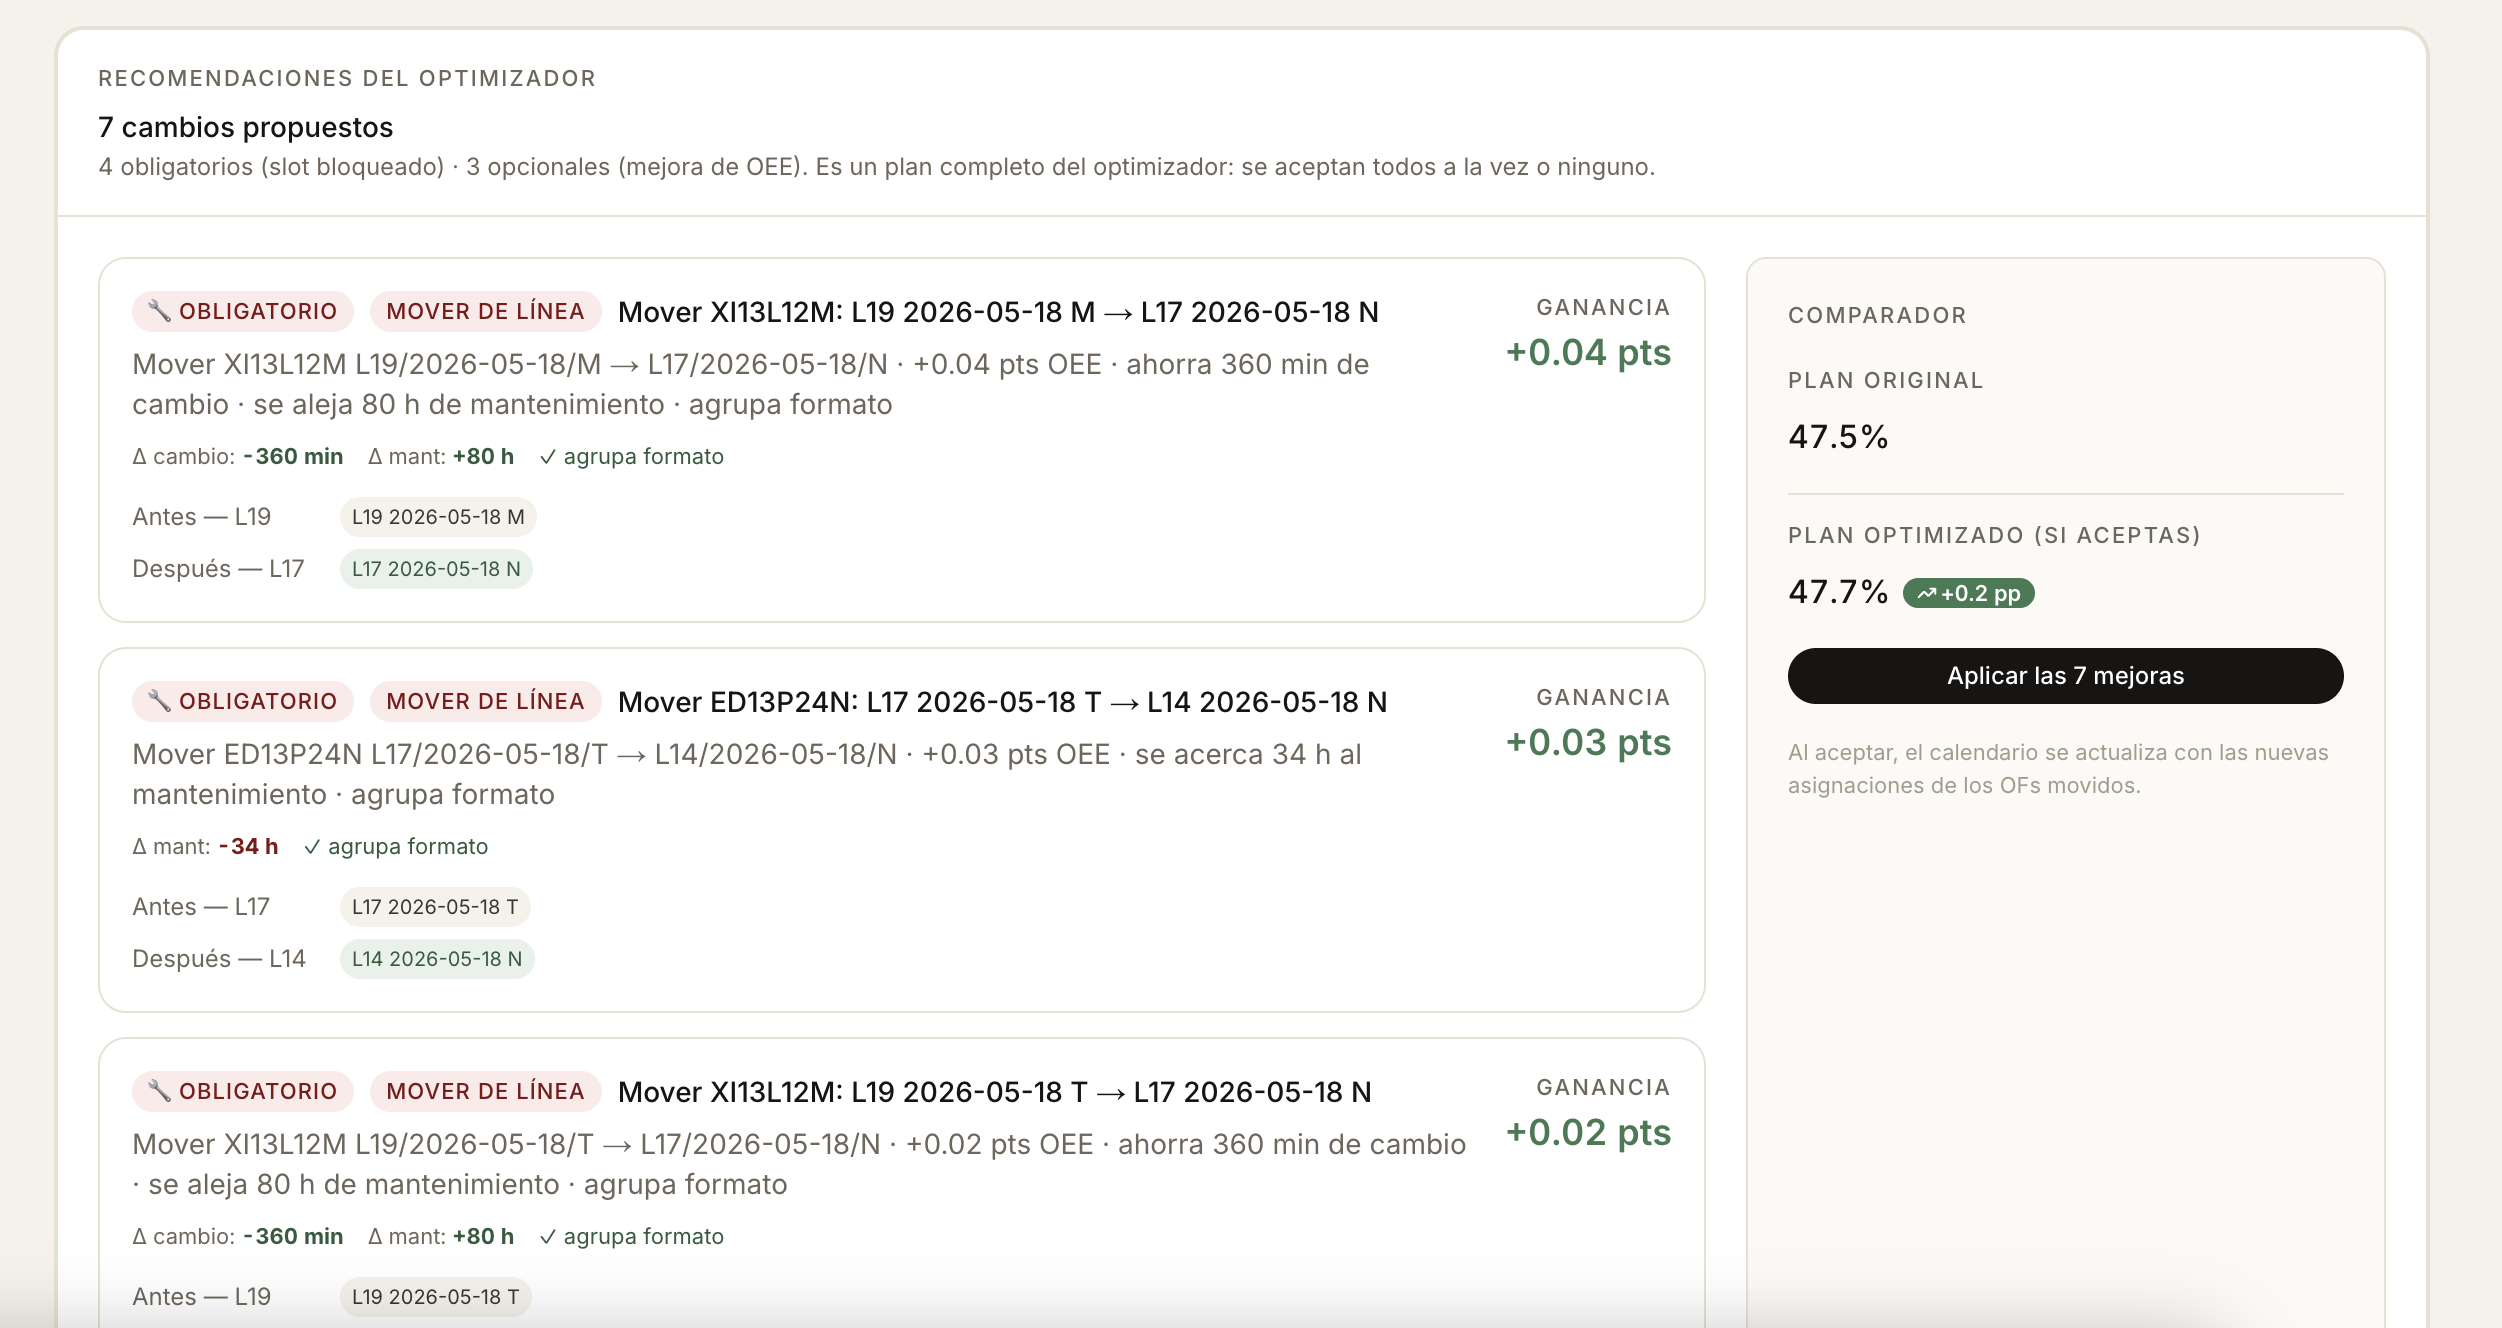
A greedy + tabu solver explores swap and move proposals across (línea, día, turno). Hard constraints: line × format compatibility ($L14 \in {1/3, 1/2}$, $L17 \in {1/3}$, $L19 \in {1/3, 1/2, 2/5}$), HL invariance, dependency order, deadline windows, and a quality gate of $\geq 3$ historical runs per (SKU × línea). Objective: maximize expected p50 factory OEE (with an aggressive p90 variant). Cleaning slots from Damm's CF Prat 5-TURNOS schedule are pinned — the optimizer routes around them, never over them.
### Stack
Next.js 14 (App Router + Server Components) + Tailwind for the dashboard. Prisma + SQLite for editable objects (plans, saved charts, SKU master). DuckDB (~6 MB) for the analytics layer. A FastAPI sidecar on
:8001 wraps the LightGBM models and the optimizer; the Next app talks to it over HTTP. Three.js for the 3D viewer. No LLM in the prediction or optimization paths — only on the Observabilidad Ask bar, which
translates natural language into SQL against DuckDB.
## Challenges we ran into
- The Hugging Face Space died mid-hackathon. We had deployed the model as a private HF Space for the demo. It returned
RUNTIME_ERRORtwo days before submission because a file on the Space was stale. We bypassed the Space entirely and built a local FastAPI sidecar (scripts/local_model_server.py) that the dashboard now talks to on:8001. - Simpson's paradox in the per-OF verdicts. Our first /validar version colored every OF as "Evitar" because we accidentally used the factory-wide daily OEE ($\approx 47{,}5\%$) as the per-OF score — below the 50% threshold for every row. Per-OF predictions had to be kept distinct from the aggregate.
- Rounding hid real wins.
pts(0.04)was rendering as+0,0 pts, making the optimizer's output look like a no-op when it had actually placed a 1.000.000-HL priority order. We bumped precision when $|n| < 0{,}1$. - Silent failures on infeasible inputs. If a planner typed "1bulluion" HL into the priority-OF form, the optimizer would silently drop it and the UI would show "0 reasignaciones." We added explicit warning banners that fire when a submitted priority OF doesn't make it into the recommendations.
- State across navigation. /validar lost its analysis every time the planner navigated to /urgencias and back. We added a
Plan.analisisJsoncache column and a/api/planes/latest/fullrehydration endpoint. - Two Excel formats, one parser.
Planificado produccionesandDiario Hl Planifhave different sheet structures. A dispatcher inweb/src/server/parser.tsdetects the format and routes to the right parser. - The confidence band is narrower than the target. Our $[p10, p90]$ interval covers $67\%$ of holdout outcomes, below the 80% goal. With more data and Optuna-tuned quantile alphas (0,05 / 0,95), we'd close it.
- Cold-start SKUs. The model was trained on 2025 only. SKUs introduced in May 2026 fall back to family-level priors (
familia_line_oee_p50) — correct, but lower fidelity.
## Accomplishments that we're proud of
- A working end-to-end loop on real Damm data. From raw Excel ingest to per-OF prediction to constraint-aware optimization to live reactive replan — every step runs on real 2025 history from El Prat. No synthetic data, no slideware.
- MAE of $0{,}103$ on the p50 OEE forecast on a Q4 2025 holdout, a +20% improvement over a naive-mean baseline using only what the planner knows before the OF runs.
- One-command setup.
./start.shon a fresh clone provisions the Python venv, builds the DuckDB analytics layer from the Damm Excels, applies Prisma migrations, syncs the 3D assets, and launches the Next dashboard + the FastAPI sidecar concurrently. We tested it from scratch. - A 3D viewer of the canning hall wired to live optimizer output. The factory floor isn't a stock asset — it's a real-time visualization of the same OEE numbers the dashboard shows.
- Explainability by default. Every recommendation ships with its drivers. No black box. A planner can audit any swap.
## What we learned
- Forecasting beats sequencing as the value driver. We started believing the optimizer was the headline. After backtesting we learned that the optimizer's typical lift on already-decent plans is modest — about $+0{,}4$ OEE points. The real value is in the diagnostic part: telling the planner that this specific OF will underperform and why, before reality proves it.
- Quantile regression is the right framing for operational risk. A point forecast is a lie of confidence. Showing $[p10, p90]$ alongside the median lets planners separate "the model is sure" from "the model thinks 78% but it could swing to 60% on a bad shift."
- The hard part isn't ML — it's the data contract with reality. Encoding Damm's verbal constraints (line × format compatibility, the OEE formula's exclusion of
IDLE, the maintenance schedule pattern) into hard solver constraints took more iteration than any modeling choice. - Explain everything, automate nothing the planner hasn't signed off on. Every recommendation surfaces its drivers; every swap is opt-in. LineWise is a copilot, not an autopilot — and that distinction is what makes it shippable in a regulated industrial setting.
## What's next for LineWise
- Block splitting in the optimizer (V3) so large OFs can span multiple (línea, día, turno) slots.
- Wider confidence bands. Optuna hyperparameter search plus recalibrated quantile alphas (0,05 / 0,95) to push $[p10, p90]$ coverage from $67\%$ toward the $80\%$ target.
- OR-tools CP-SAT formulation for global optimization. The current solver is greedy with tabu — good enough for the demo, not optimal.
- Multi-week horizon. Today we optimize one week at a time; the natural extension is rolling 2-4 week windows with shared inventory and deadline constraints.
- Push back into Blue Yonder. A downloadable optimized Excel in Damm's original
Planificado produccionesformat, so the planner can pipe LineWise's output back into the source-of-truth scheduler. - Live MES integration. Pull plans directly from Damm's MES, push recommendations back, and ingest 2024 and 2023 history (if Damm shares it) to lift the training set past today's 1.670 rows.


Log in or sign up for Devpost to join the conversation.