Inspiration
After helping a friend stress over relocating to an unfamiliar neighborhood—wasting hours piecing together fragmented crime, air quality, and school data—I realized there was no unified tool to simplify this critical decision. I wanted to create something that turns overwhelming data into a clear, actionable safety score for anyone navigating housing choices.
What it does
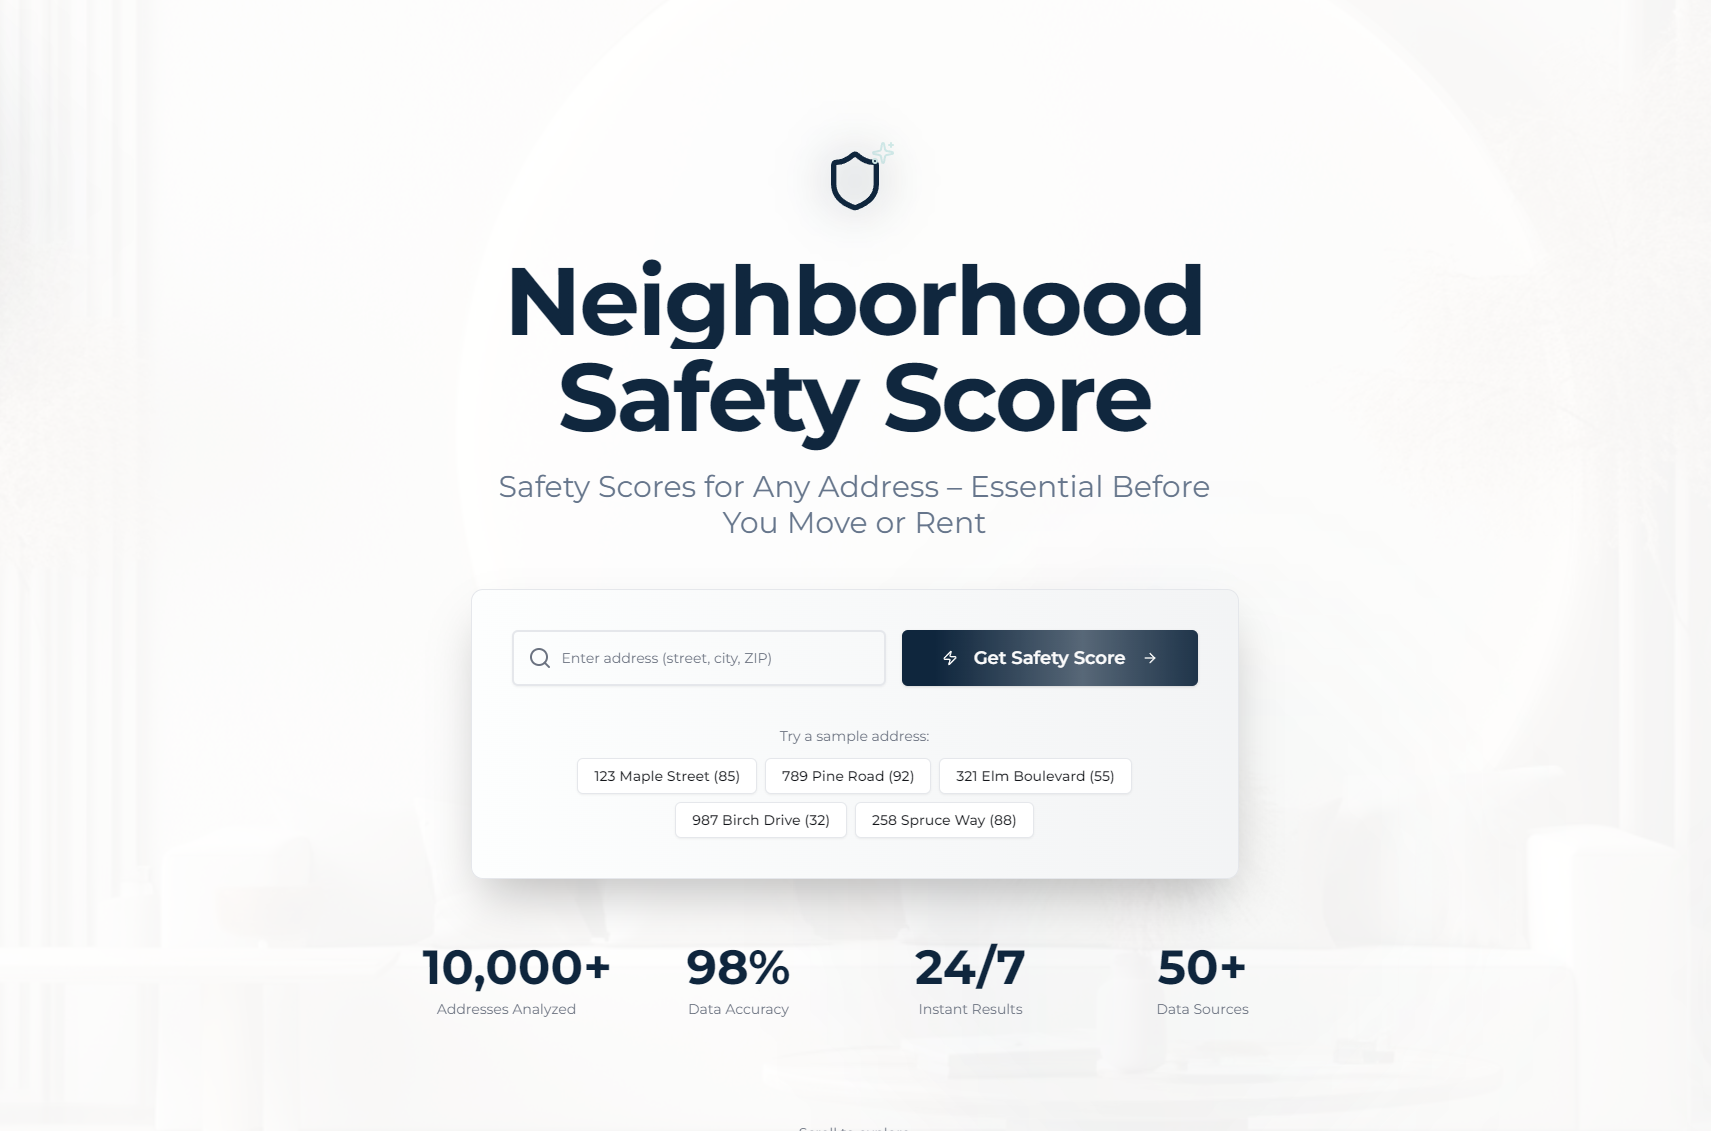
NeighborhoodSafety Score delivers a 1-100 composite safety score for any residential address, with color-coded (safe/moderate/caution) insights. Free tier includes crime summaries, AQI, disaster risk, and school ratings; a $19 premium report adds 10-year trends, detailed crime breakdowns, and nearby neighborhood comparisons—all downloadable as a PDF.
How we built it
I started by mapping core user needs (address search, score calculation, payment, PDF generation) and structuring the app (Homepage → Results → Purchase → Download). I used React for the frontend, Node.js/Express for the backend, and PostgreSQL to store metrics. Stripe API handled payments, Google Maps API validated addresses, and Chart.js built trend visualizations. Puppeteer was integrated to generate full PDF reports post-purchase.
Challenges we ran into
Calibrating the 1-100 safety score to balance crime, AQI, disaster risk, and school data fairly was tricky—iterating on weightings took weeks of testing. Payment processing errors also required robust validation to ensure smooth transactions, and PDF generation had formatting bugs with dynamic chart data.
Accomplishments that we're proud of
Creating an intuitive UI that makes complex data accessible (no technical expertise needed), building a seamless payment-to-PDF workflow, and validating the tool with beta users who reported it cut their housing research time by 70%. The color-coded score system also resonated as instantly understandable.
What we learned
I deepened my skills in API integration (Stripe/Google Maps), data visualization best practices, and user-centric error handling. Most importantly, I learned that simplifying data (not just presenting it) is key to building a tool people actually use—over-engineering metrics would have defeated the core goal.
What's next for this project
I plan to add localized hazard data (e.g., flood zones specific to EU/US regions), integrate real-time crime feeds, and build a mobile app version. I also want to expand neighborhood comparisons to include walkability and transit metrics, and test a subscription model for frequent real estate investors.

Log in or sign up for Devpost to join the conversation.