-
-
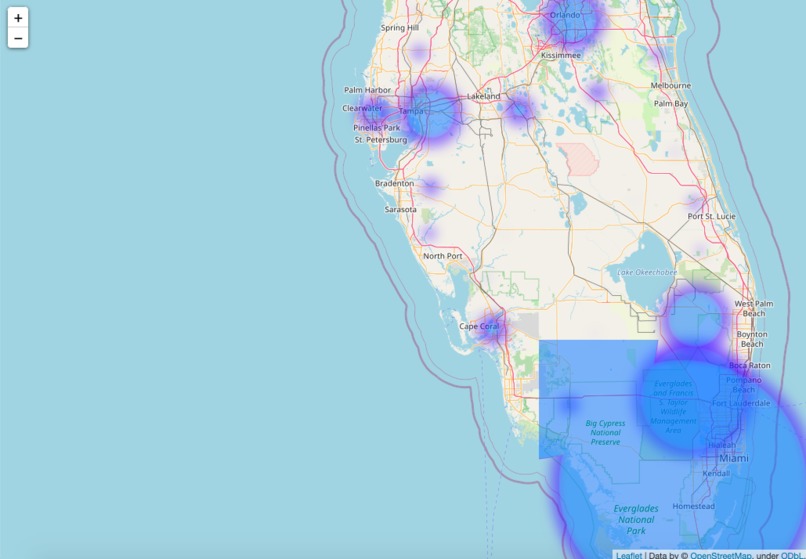
Interactive Heat Map
-
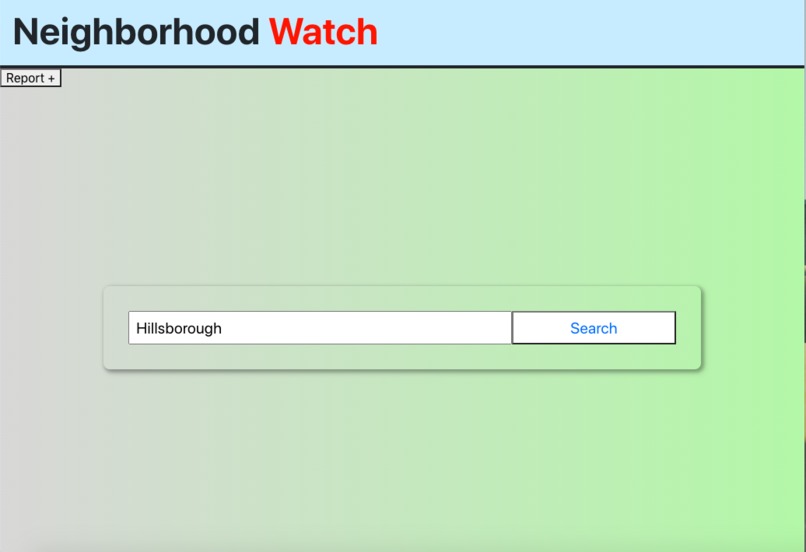
Application Home Page
Inspiration
Our inspiration for creating Neighborhood Watch stemmed from the different problems we have noticed people are facing in communities all around the world including the COVID-19 pandemic, natural disasters, and injustices committed against others. We wanted to create a virtual space where people can stay informed and inform others of potential dangers in their area in order to foster and maintain the sense of community even during times when we cannot interact physically. Accessibility of this information may help people evacuate faster during wildfires, stay away from certain areas with large infection cases, etc.
What it does
Our web application allows a user to report new case into our database, as well as viewing an interactive heat map of COVID-19 cases.
How we built it
The user interface was developed using the front-end technologies: the React library and the Bootstrap framework. The database contains U.S. COVID-19 cases up until September 26, 2020, hosted in a PostgreSQL instance on Google Cloud. This database communicates with our Django backend server. Python libraries are used to generate the heatmap, as well as COVID-19 data taken https://coronavirus-resources.esri.com/datasets/628578697fb24d8ea4c32fa0c5ae1843_0?geometry=112.752%2C22.406%2C19.764%2C64.233&where=(Confirmed%20%3E%200) .
Challenges we ran into
We had to switch the framework of our backend from .NET Core to Django to support Python scripts that will generate our heatmap. We also had to learn new functionalities in React and how they work.
Accomplishments that we're proud of
We have a backend that is able to generate a heat map and a UI that a user can interact with to generate the heatmap. Our teamwork was also awesome. Our team is also proud of the new knowledge that we have gained working on this project.
What we learned
In doing the research to acquire the necessary data, we learned additional information and statistics regarding COVID-19 such as which regions had the highest infection rates and which areas were able to reduce the number of confirmed cases and further spread of the virus. In working as a team we also all learned new technical skills. Those of us who have front-end experience assisted those who wanted to learn more and those who have more back-end experience assisted those less experienced as well.
What's next for Neighborhood Watch
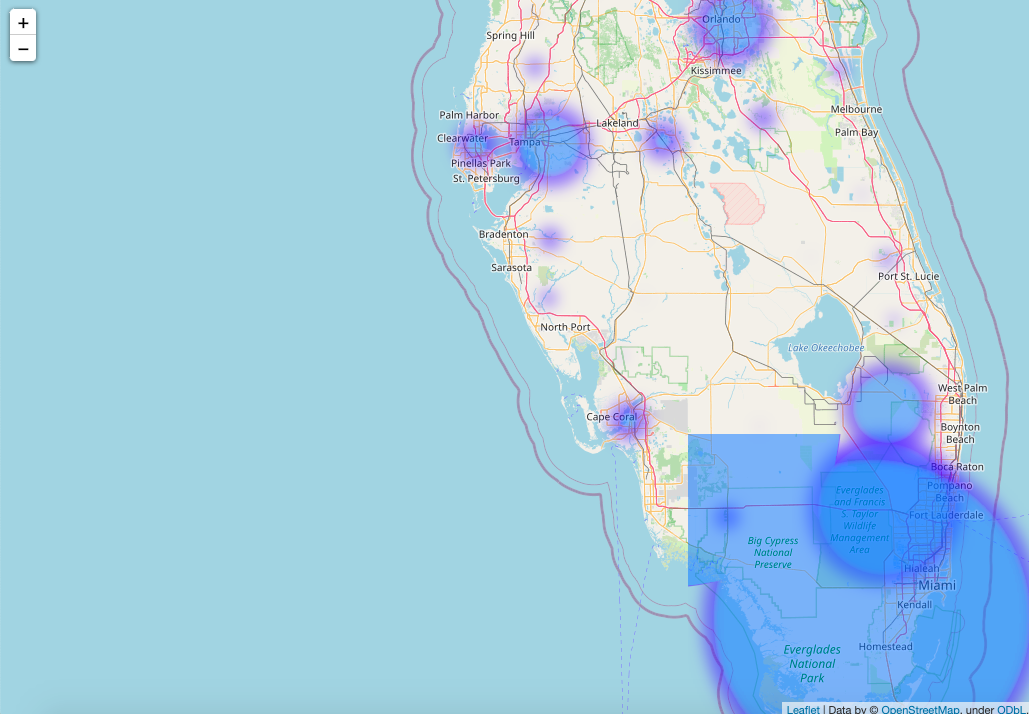
Neighborhood Watch currently only displays data for COVID-19 incidents but has the capacity to support data for additional incidents in the future as well. Users have the ability to view already reported cases of COVID-19 in the form of a heat map that visually displays the intensity of cases in a county of their choice, informing people of which areas to take extra precautions in or avoid altogether in order to reduce the risk of infection.


Log in or sign up for Devpost to join the conversation.