-
-
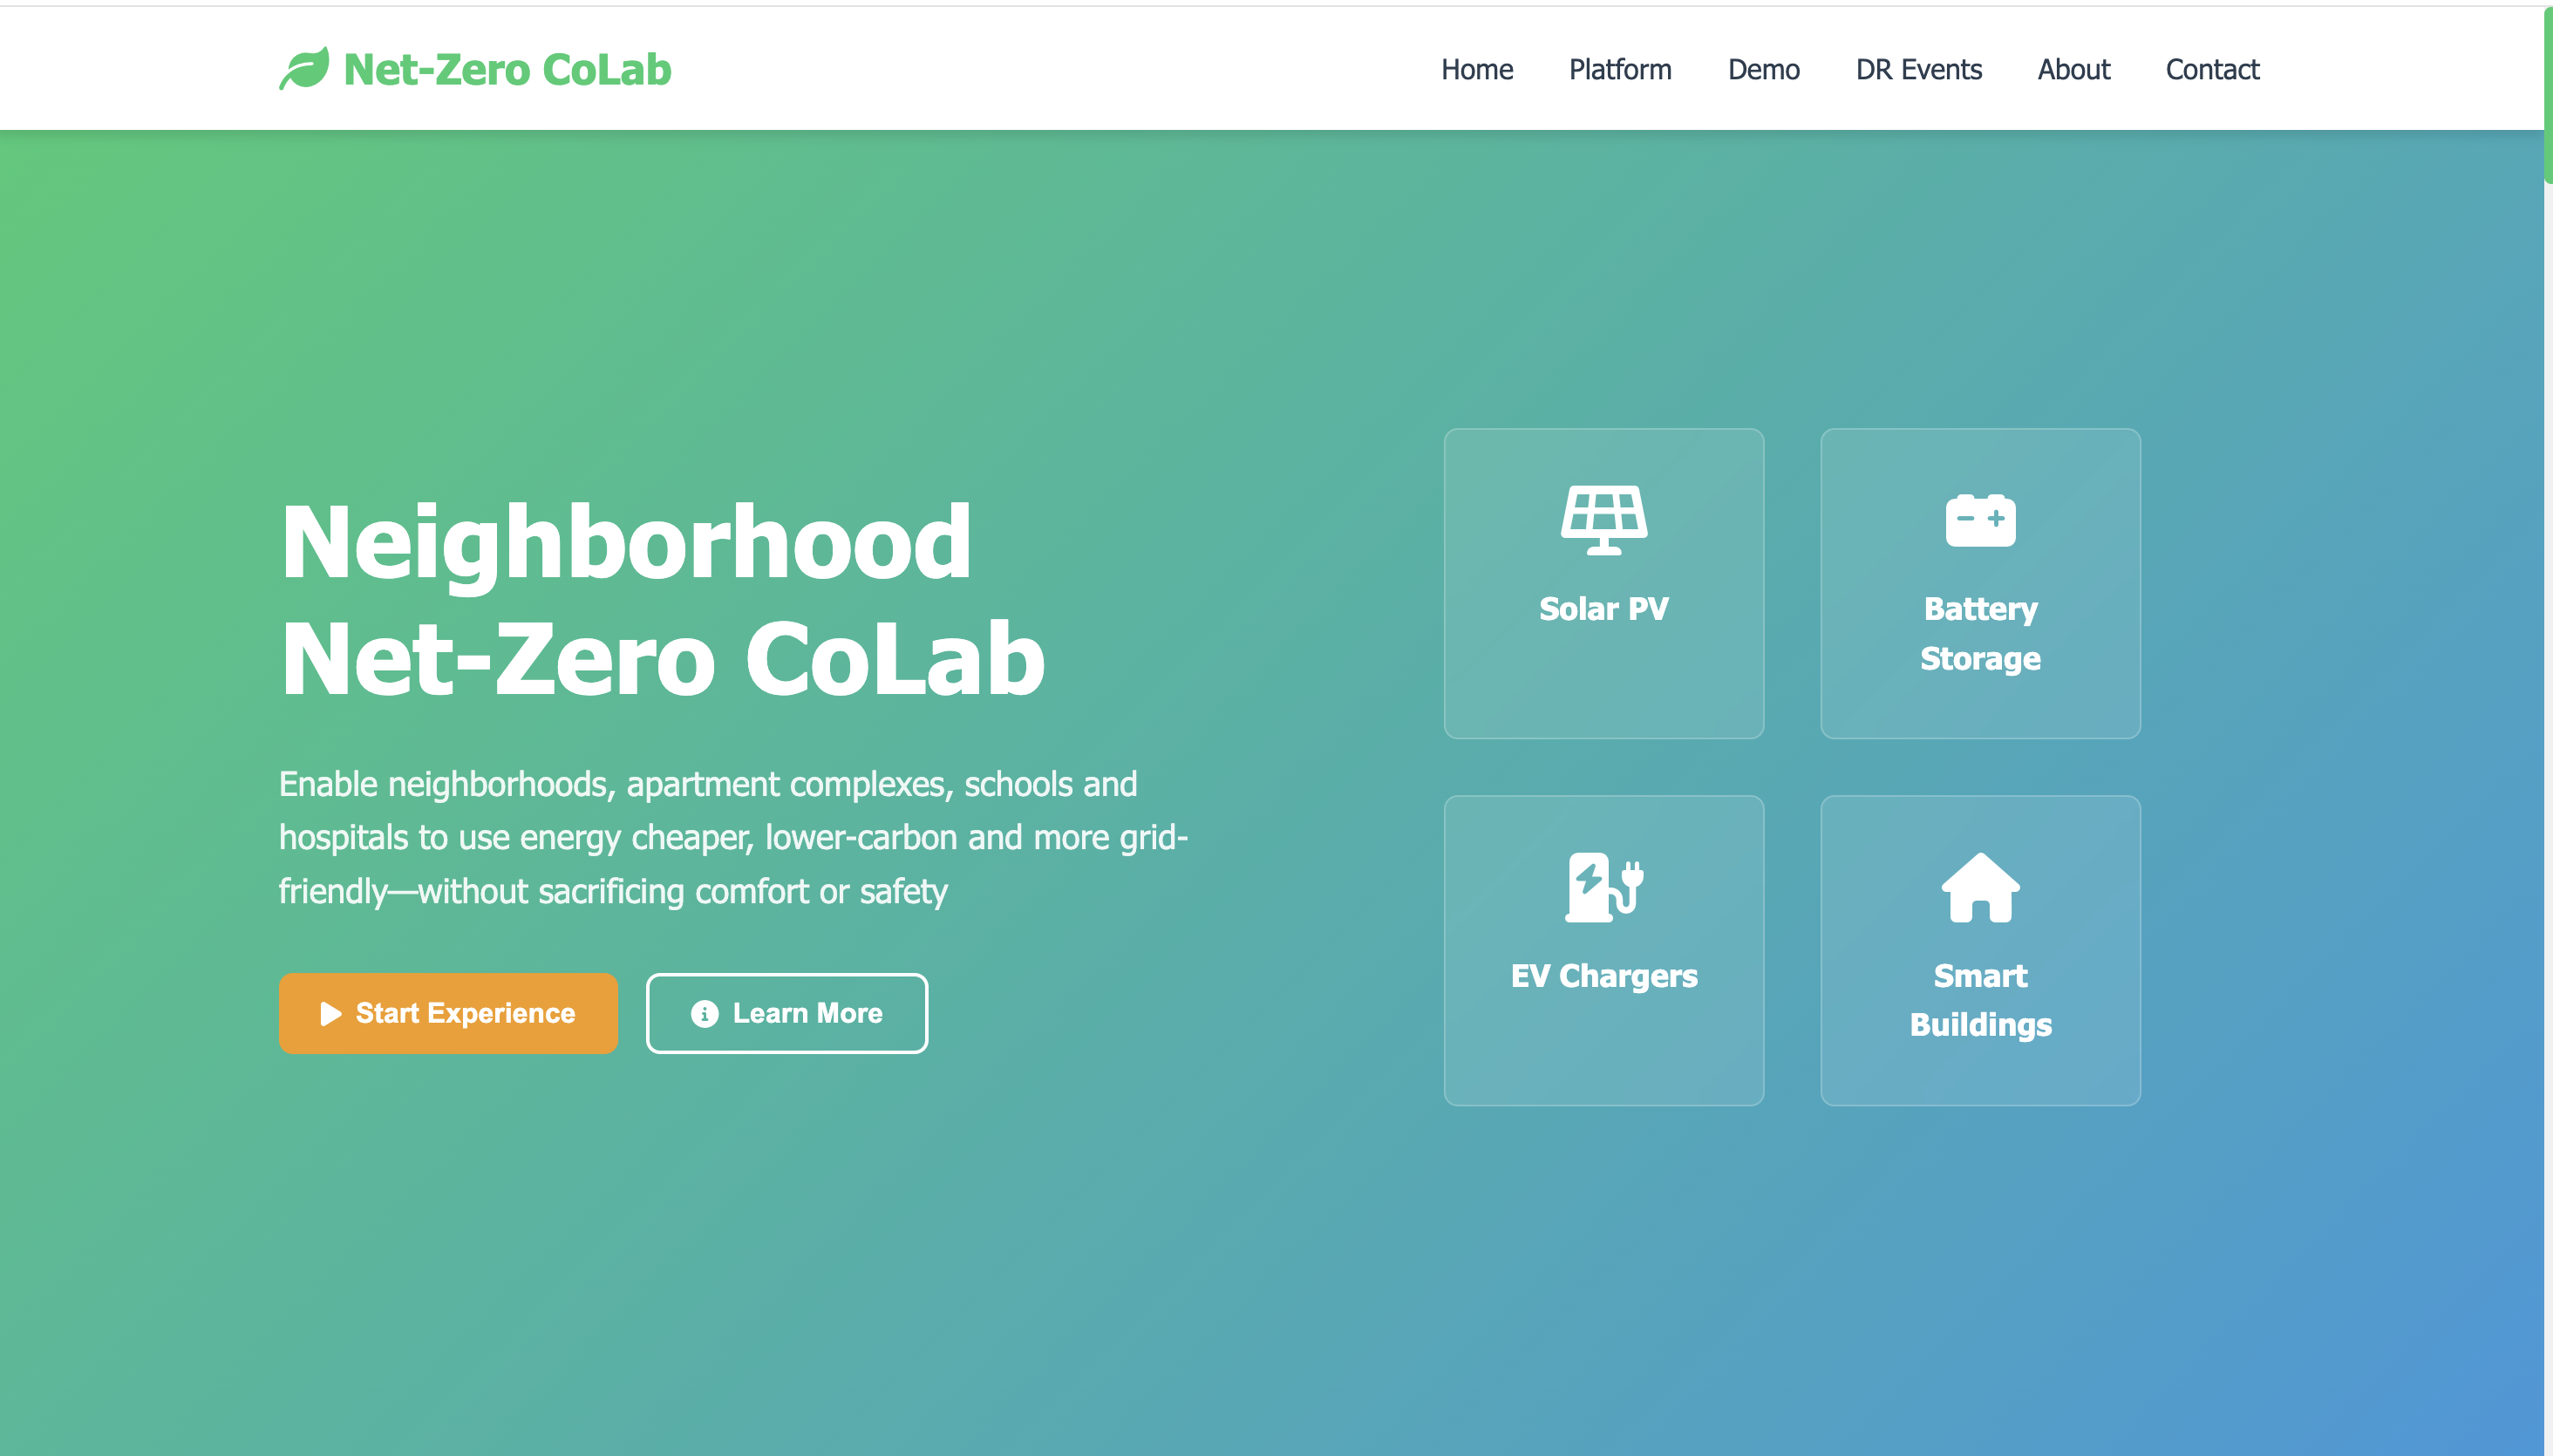
Neighborhood Net-Zero CoLab
-
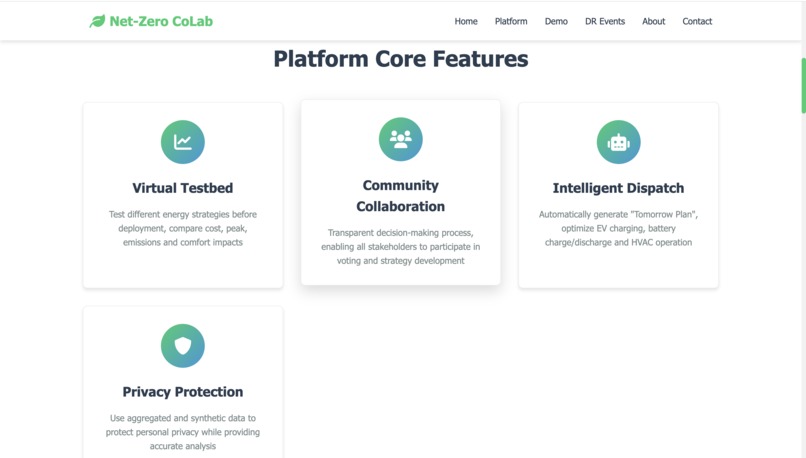
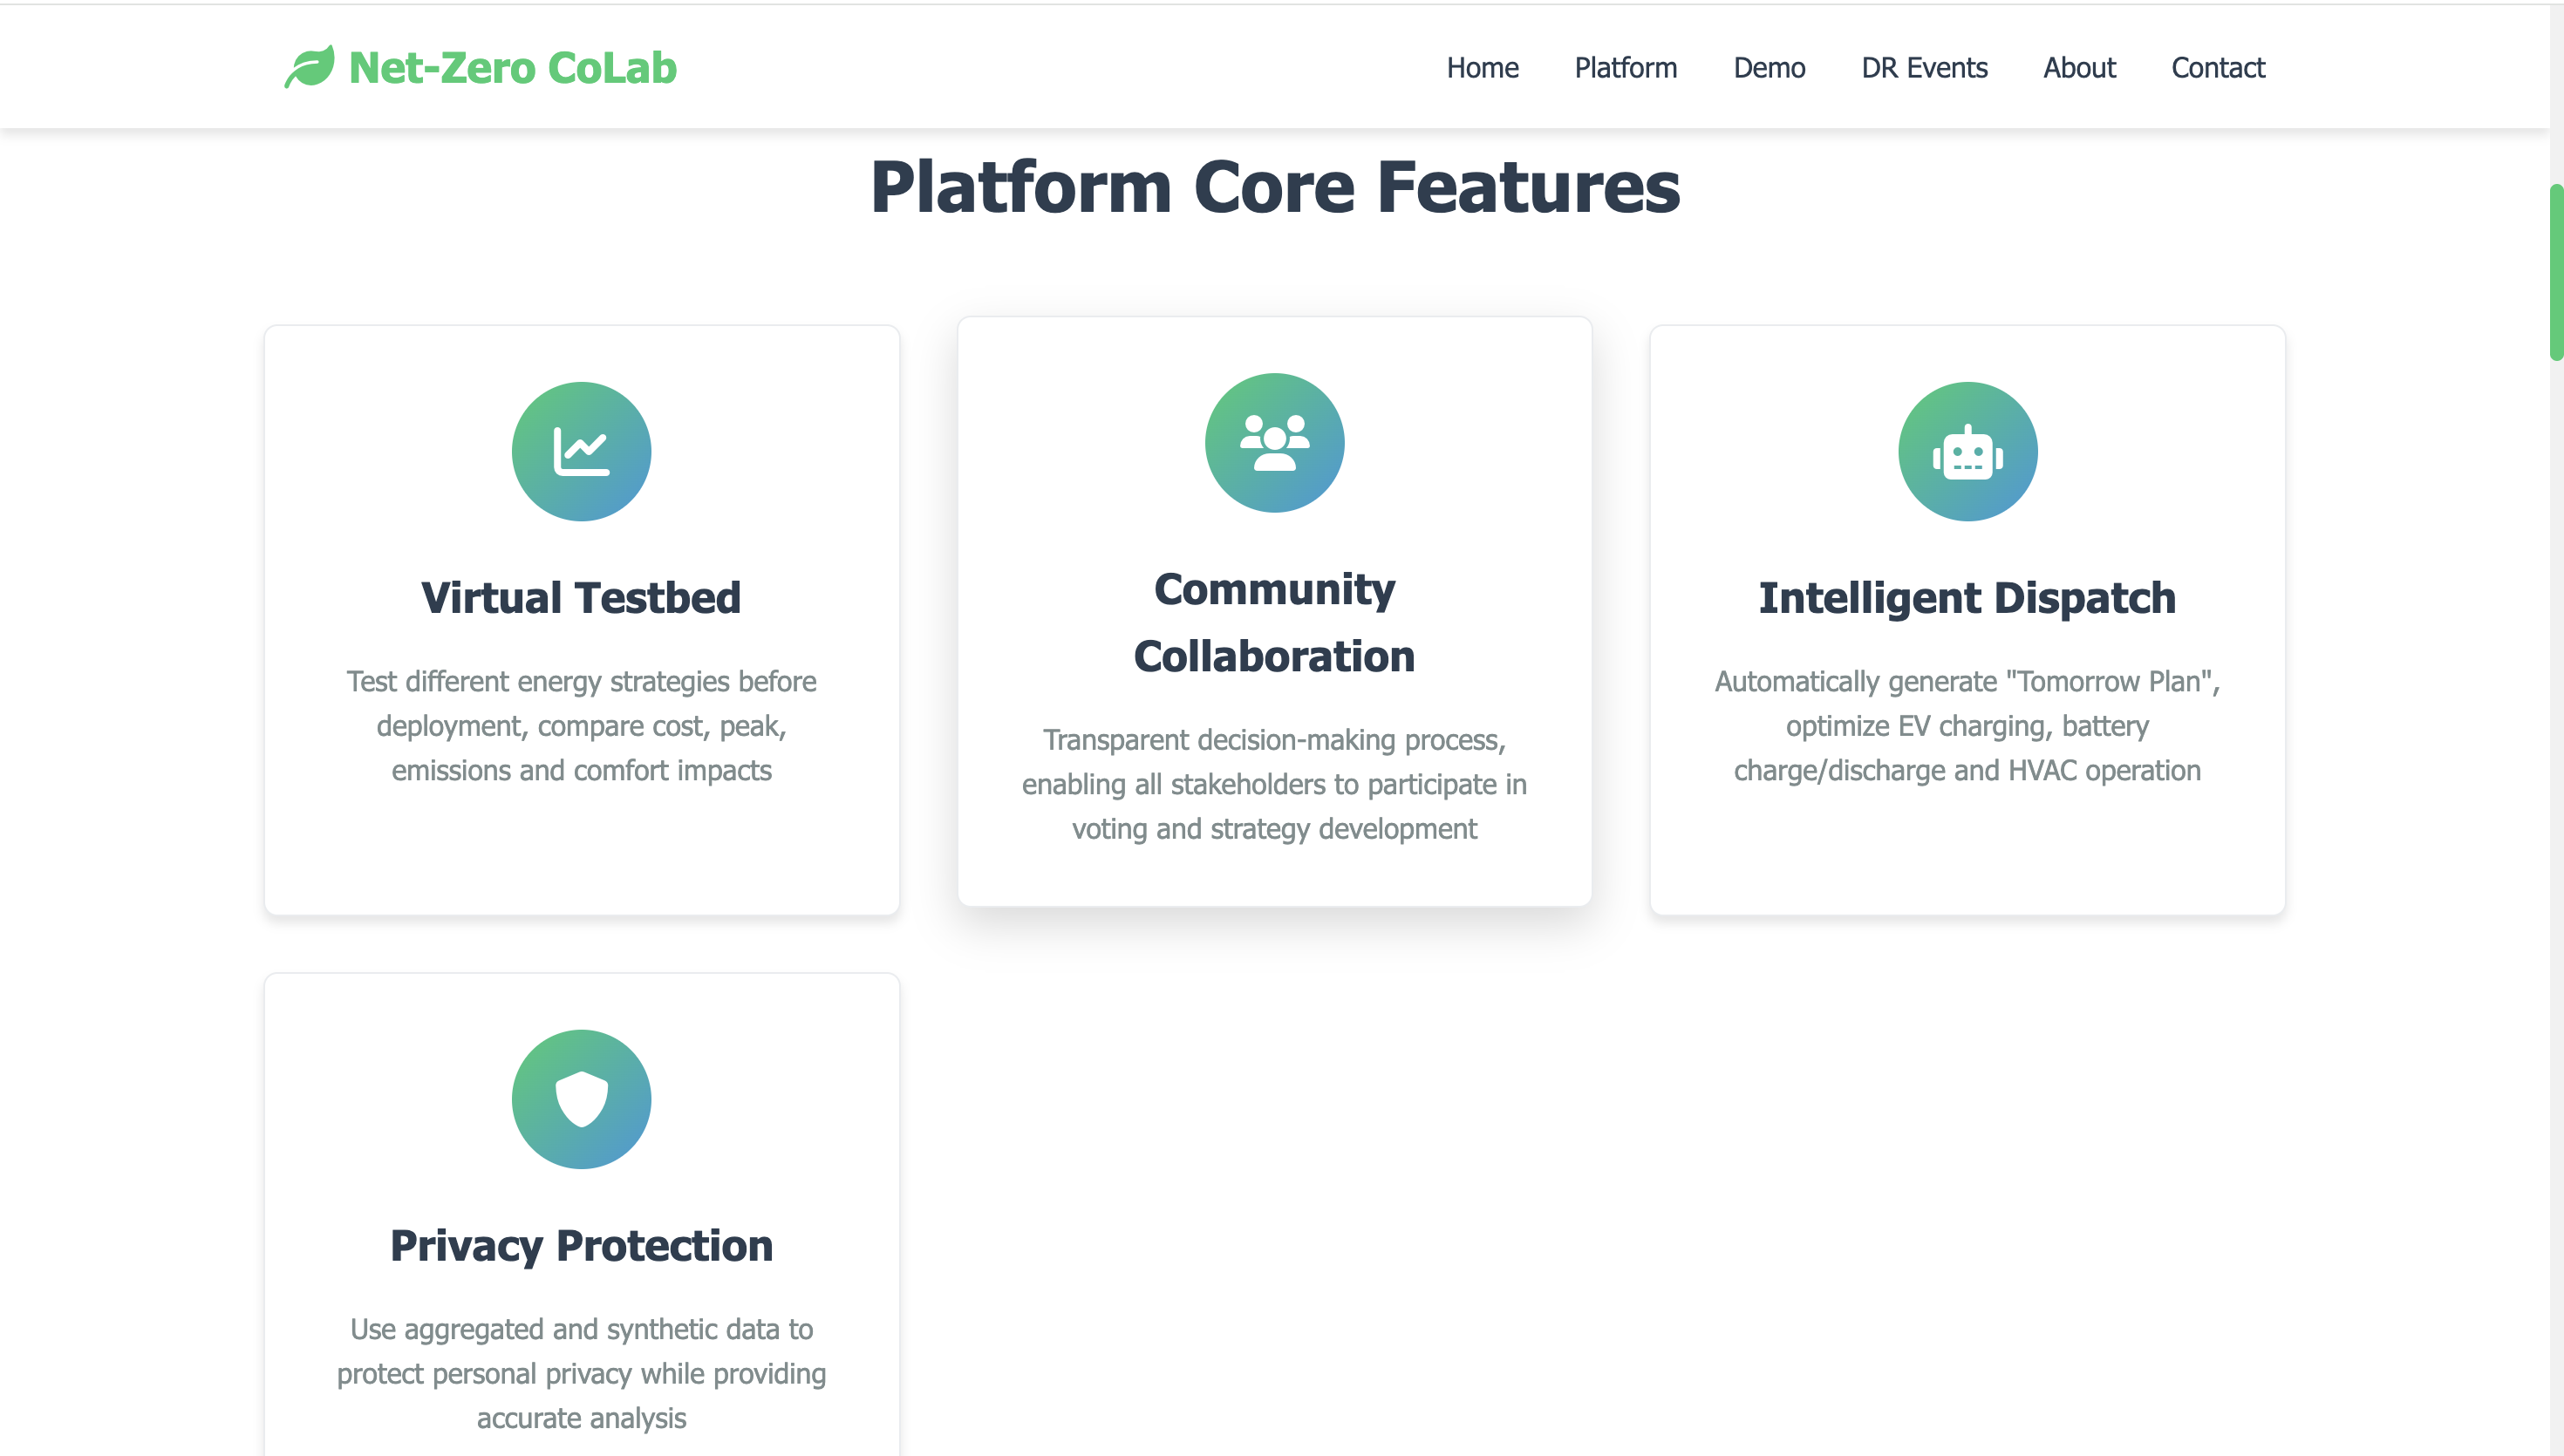
Platform Core Features
-
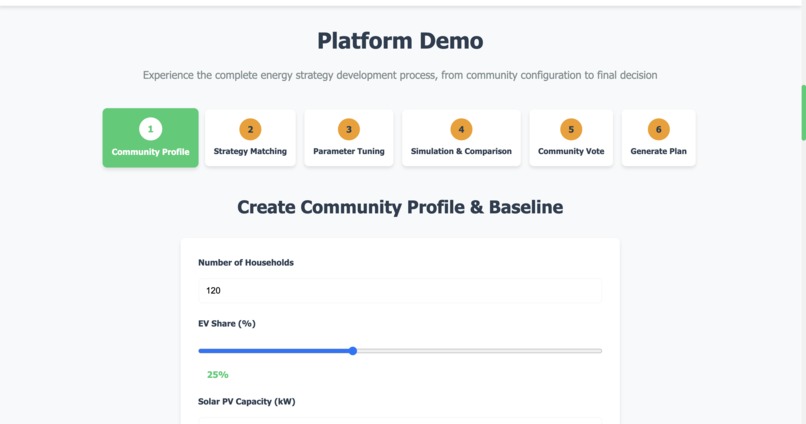
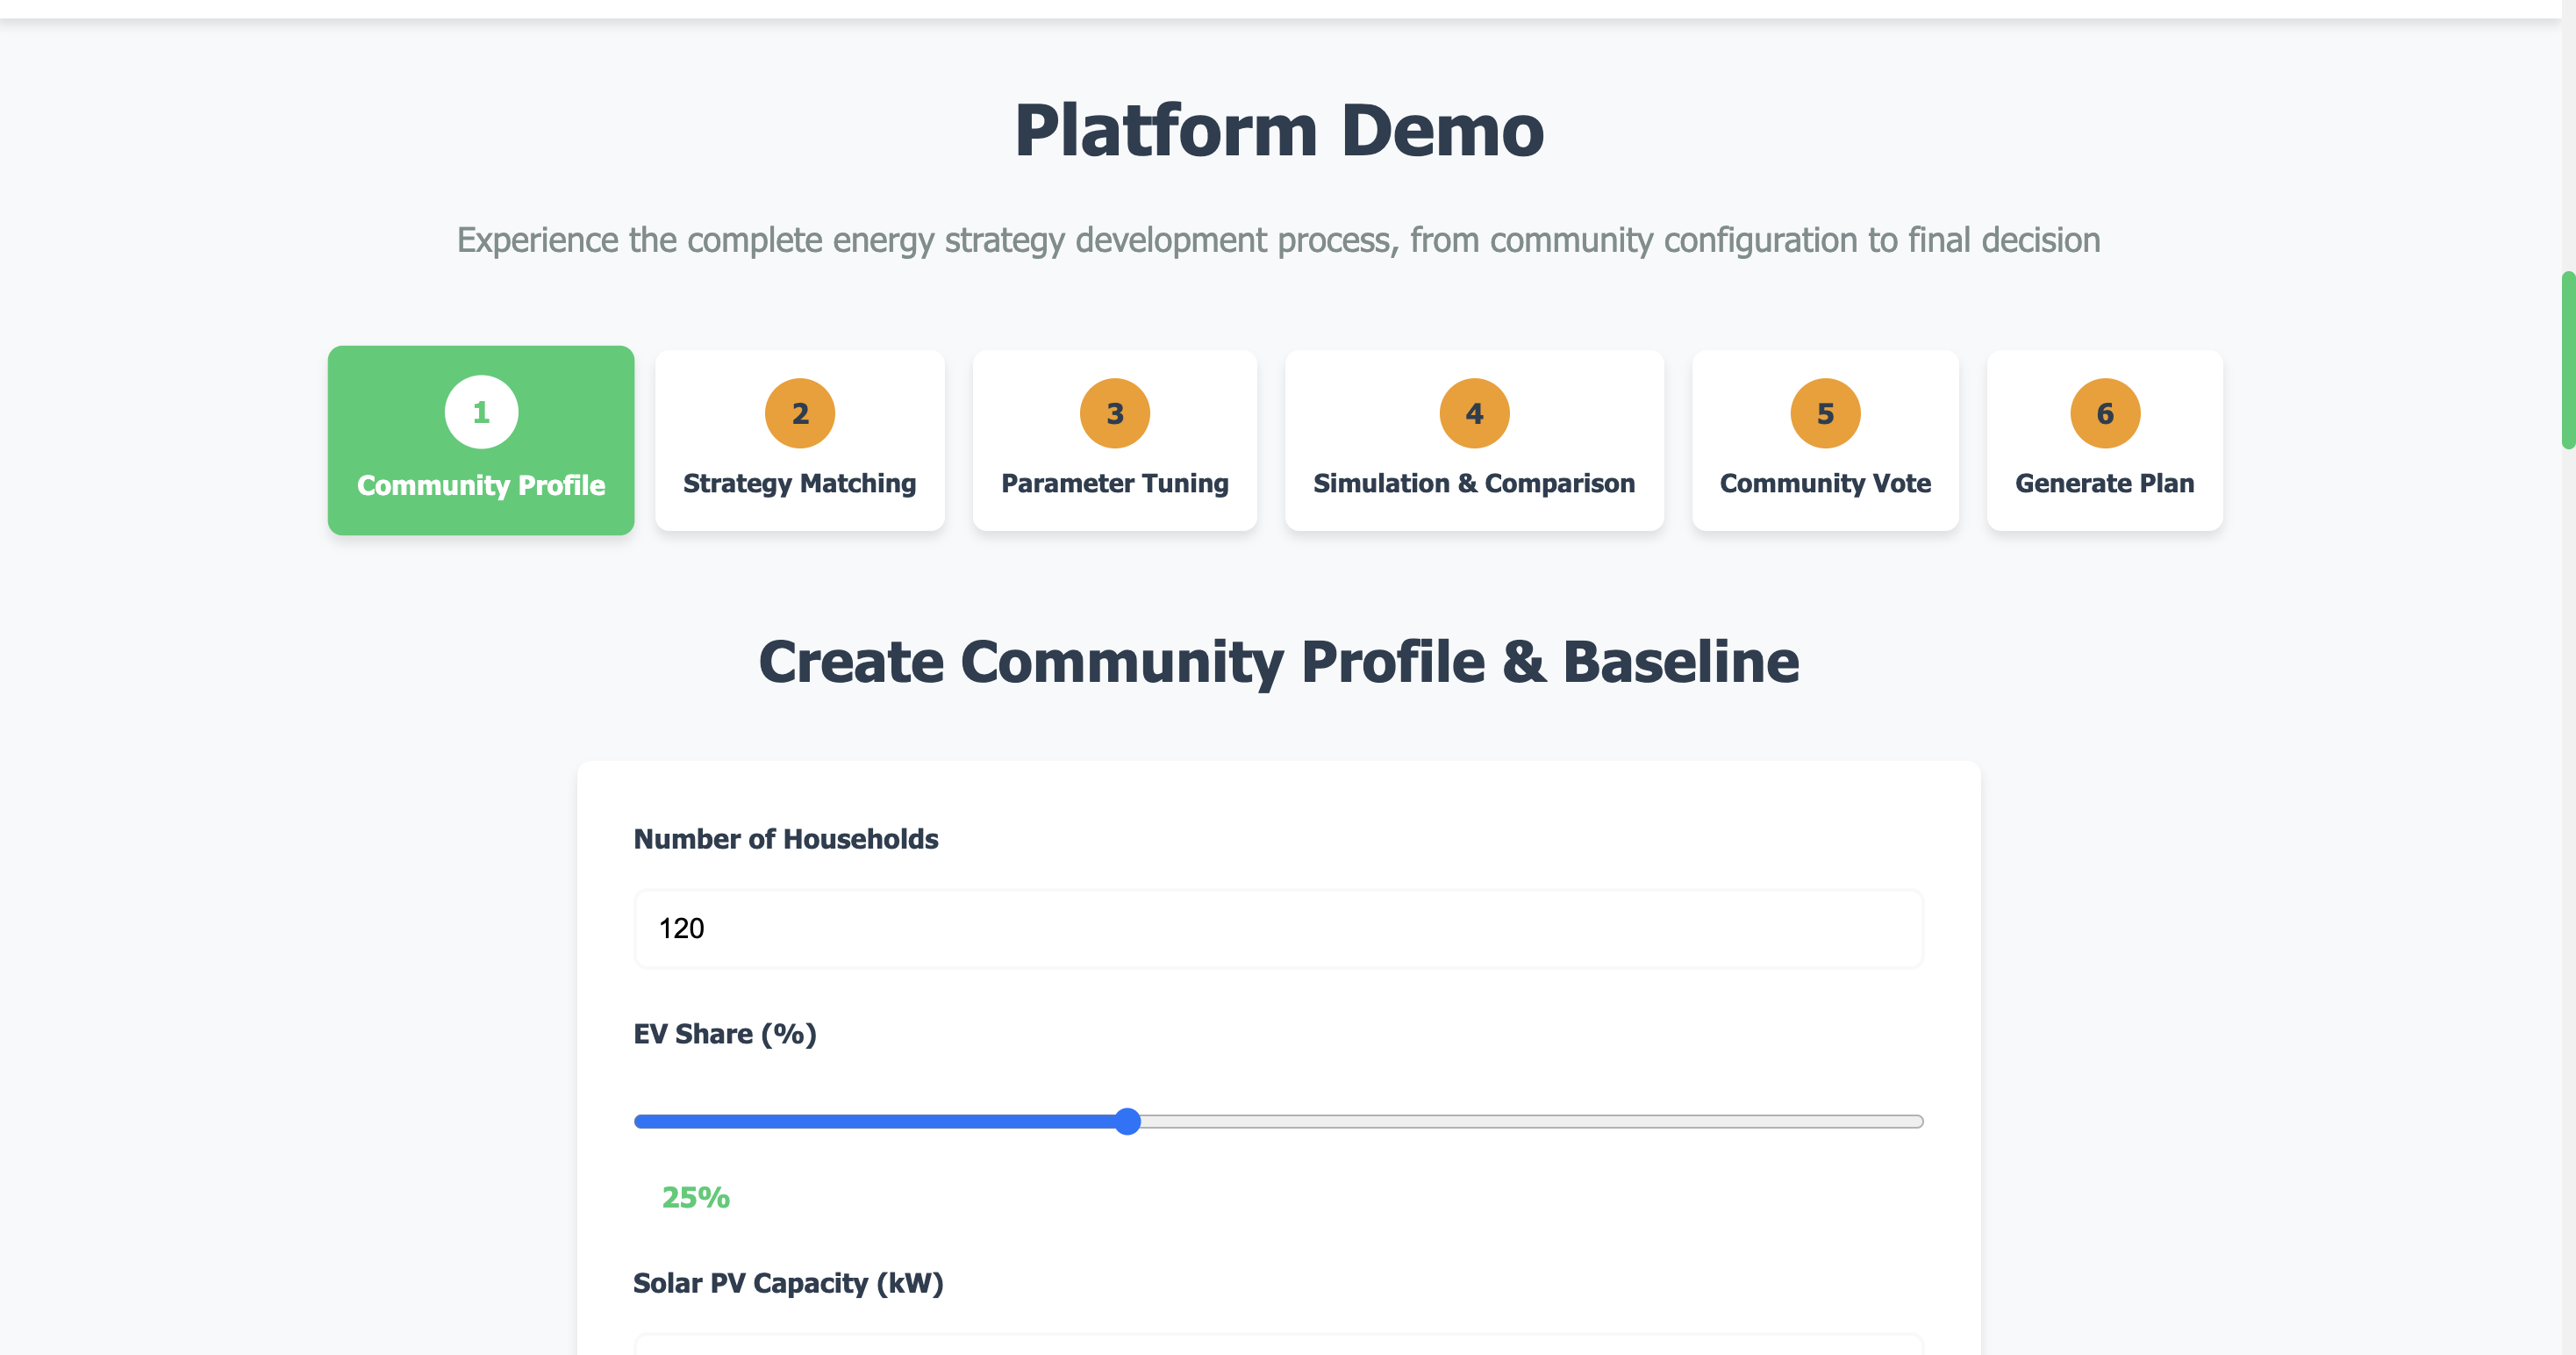
Create Community Profile & Baseline
-
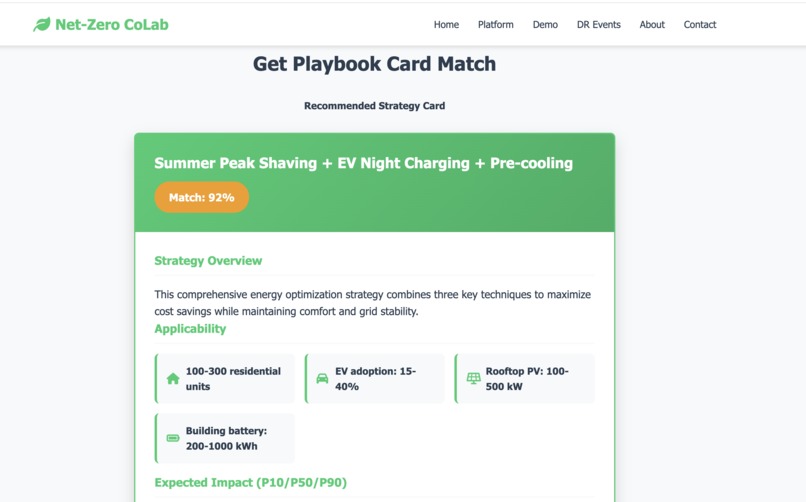
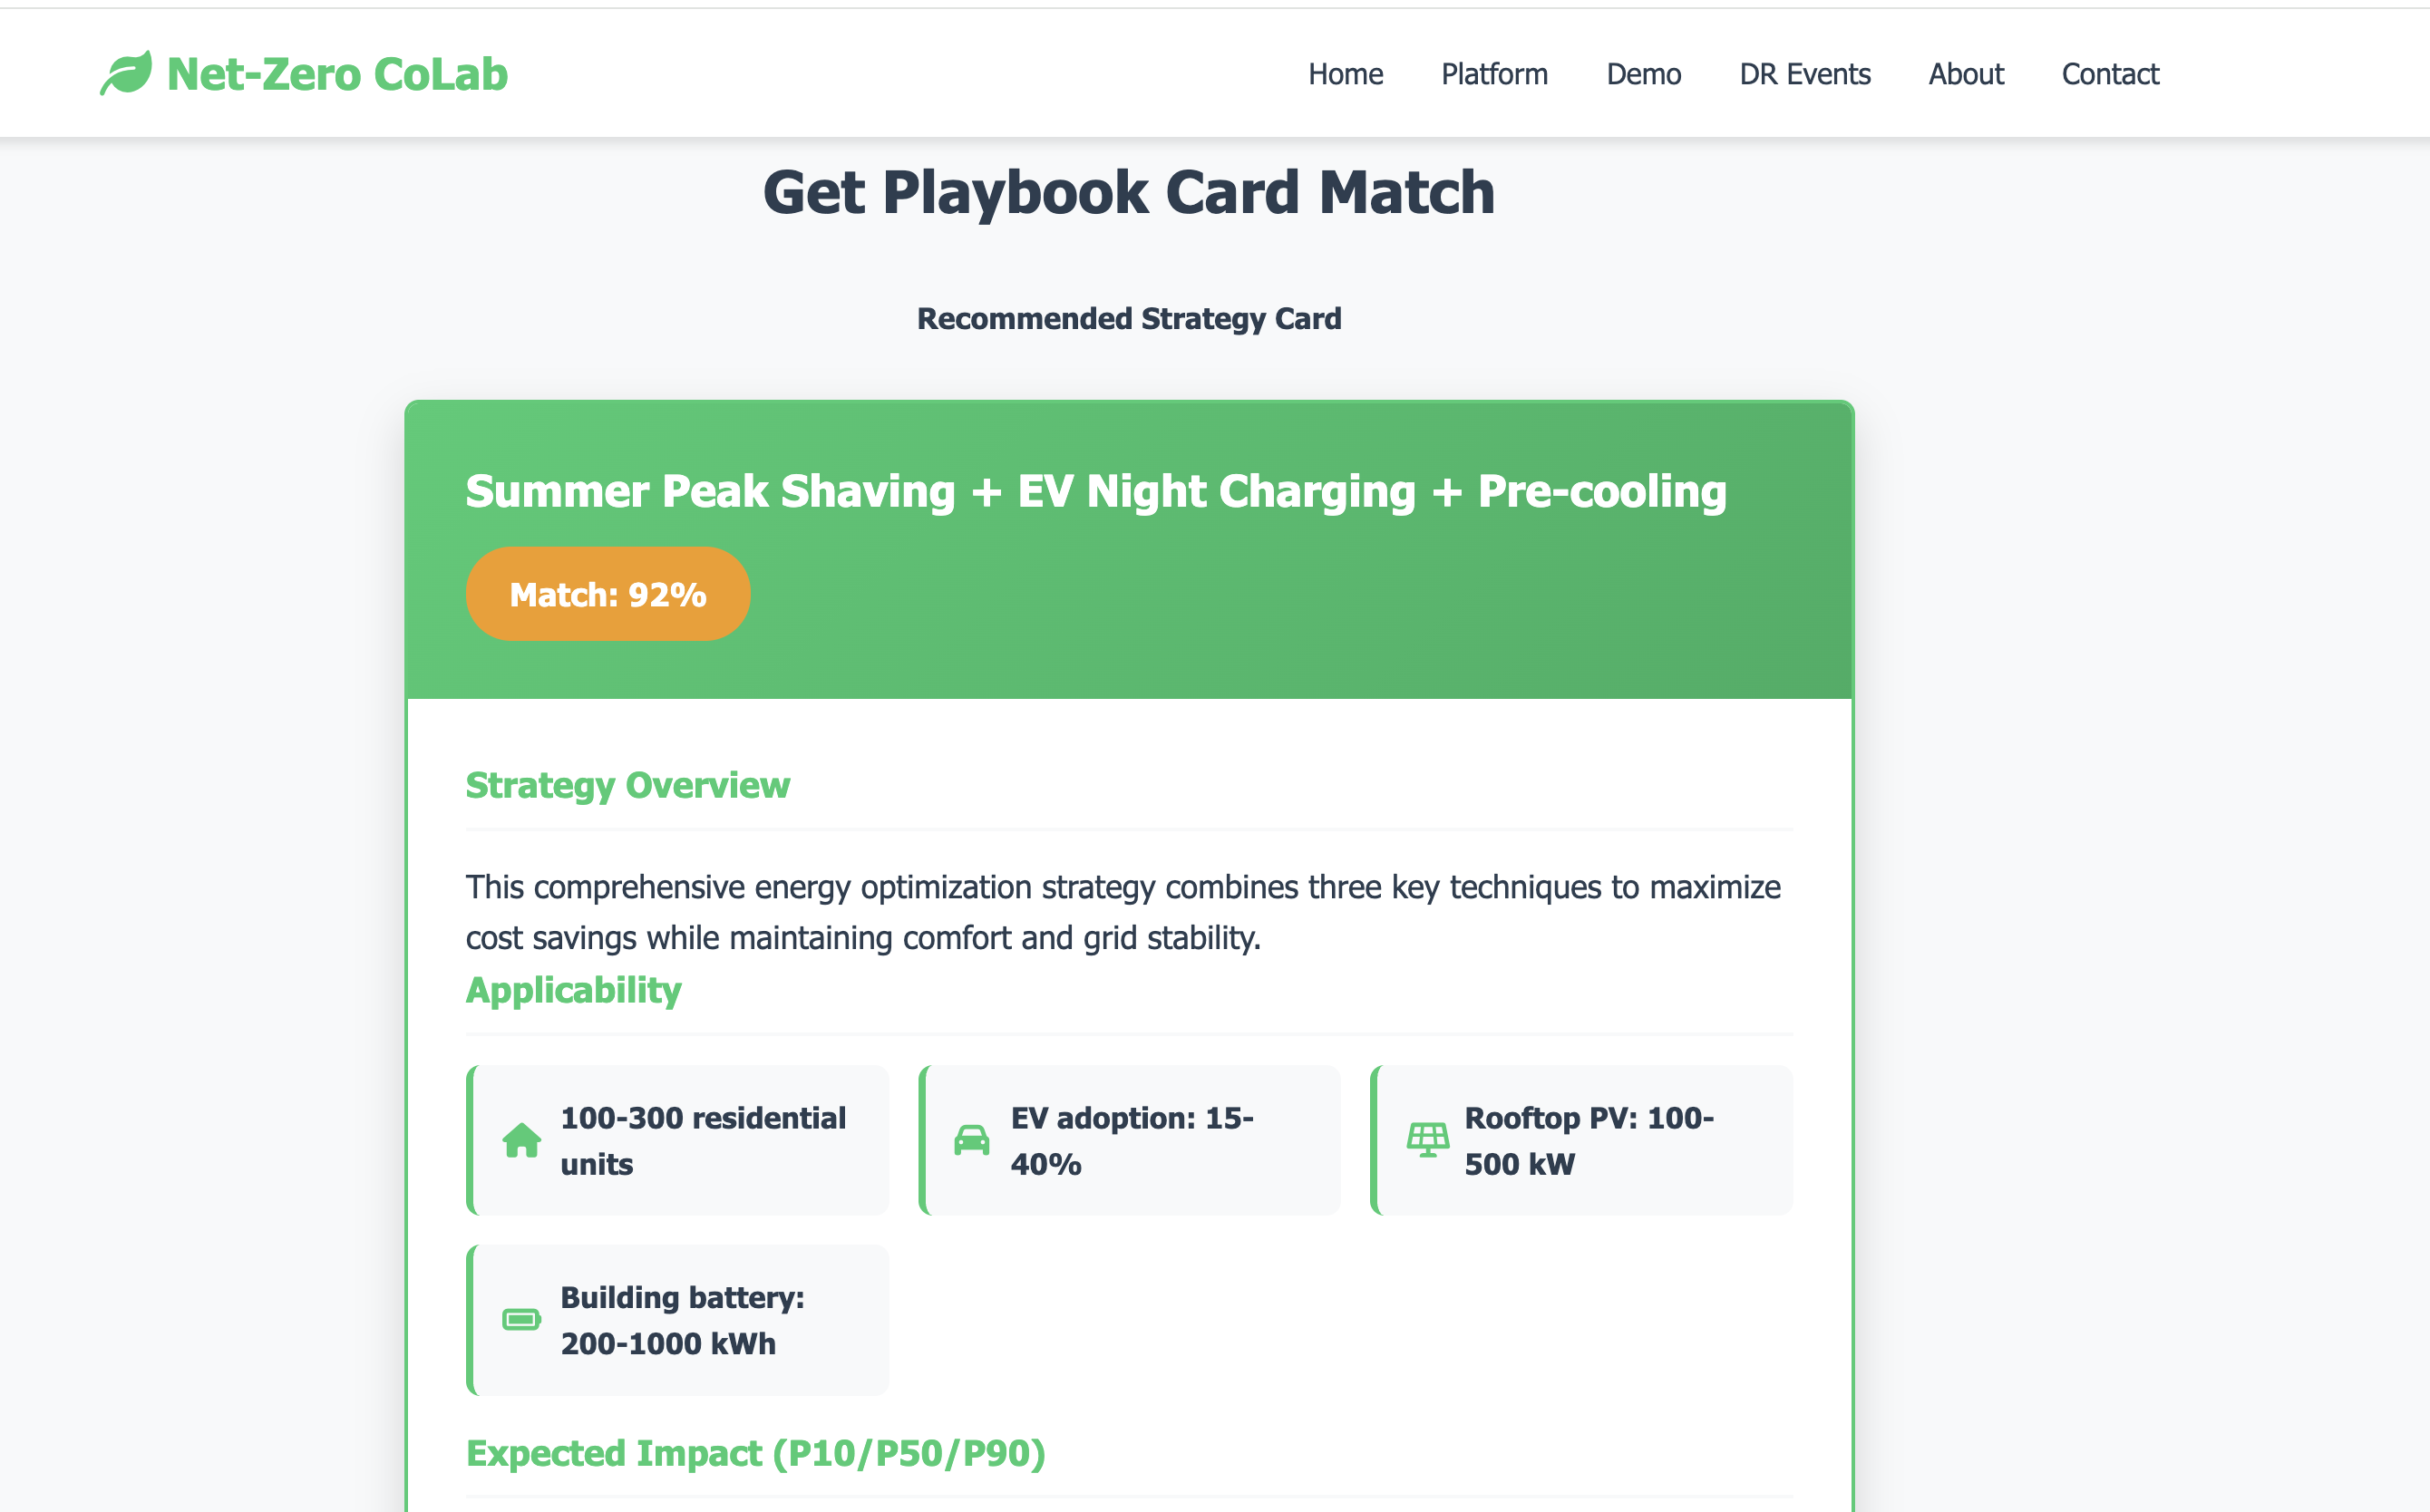
Get Playbook Card Match
-
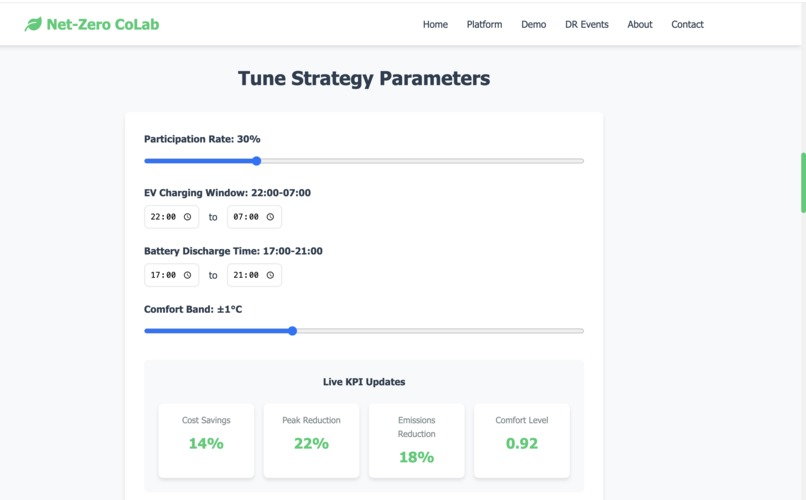
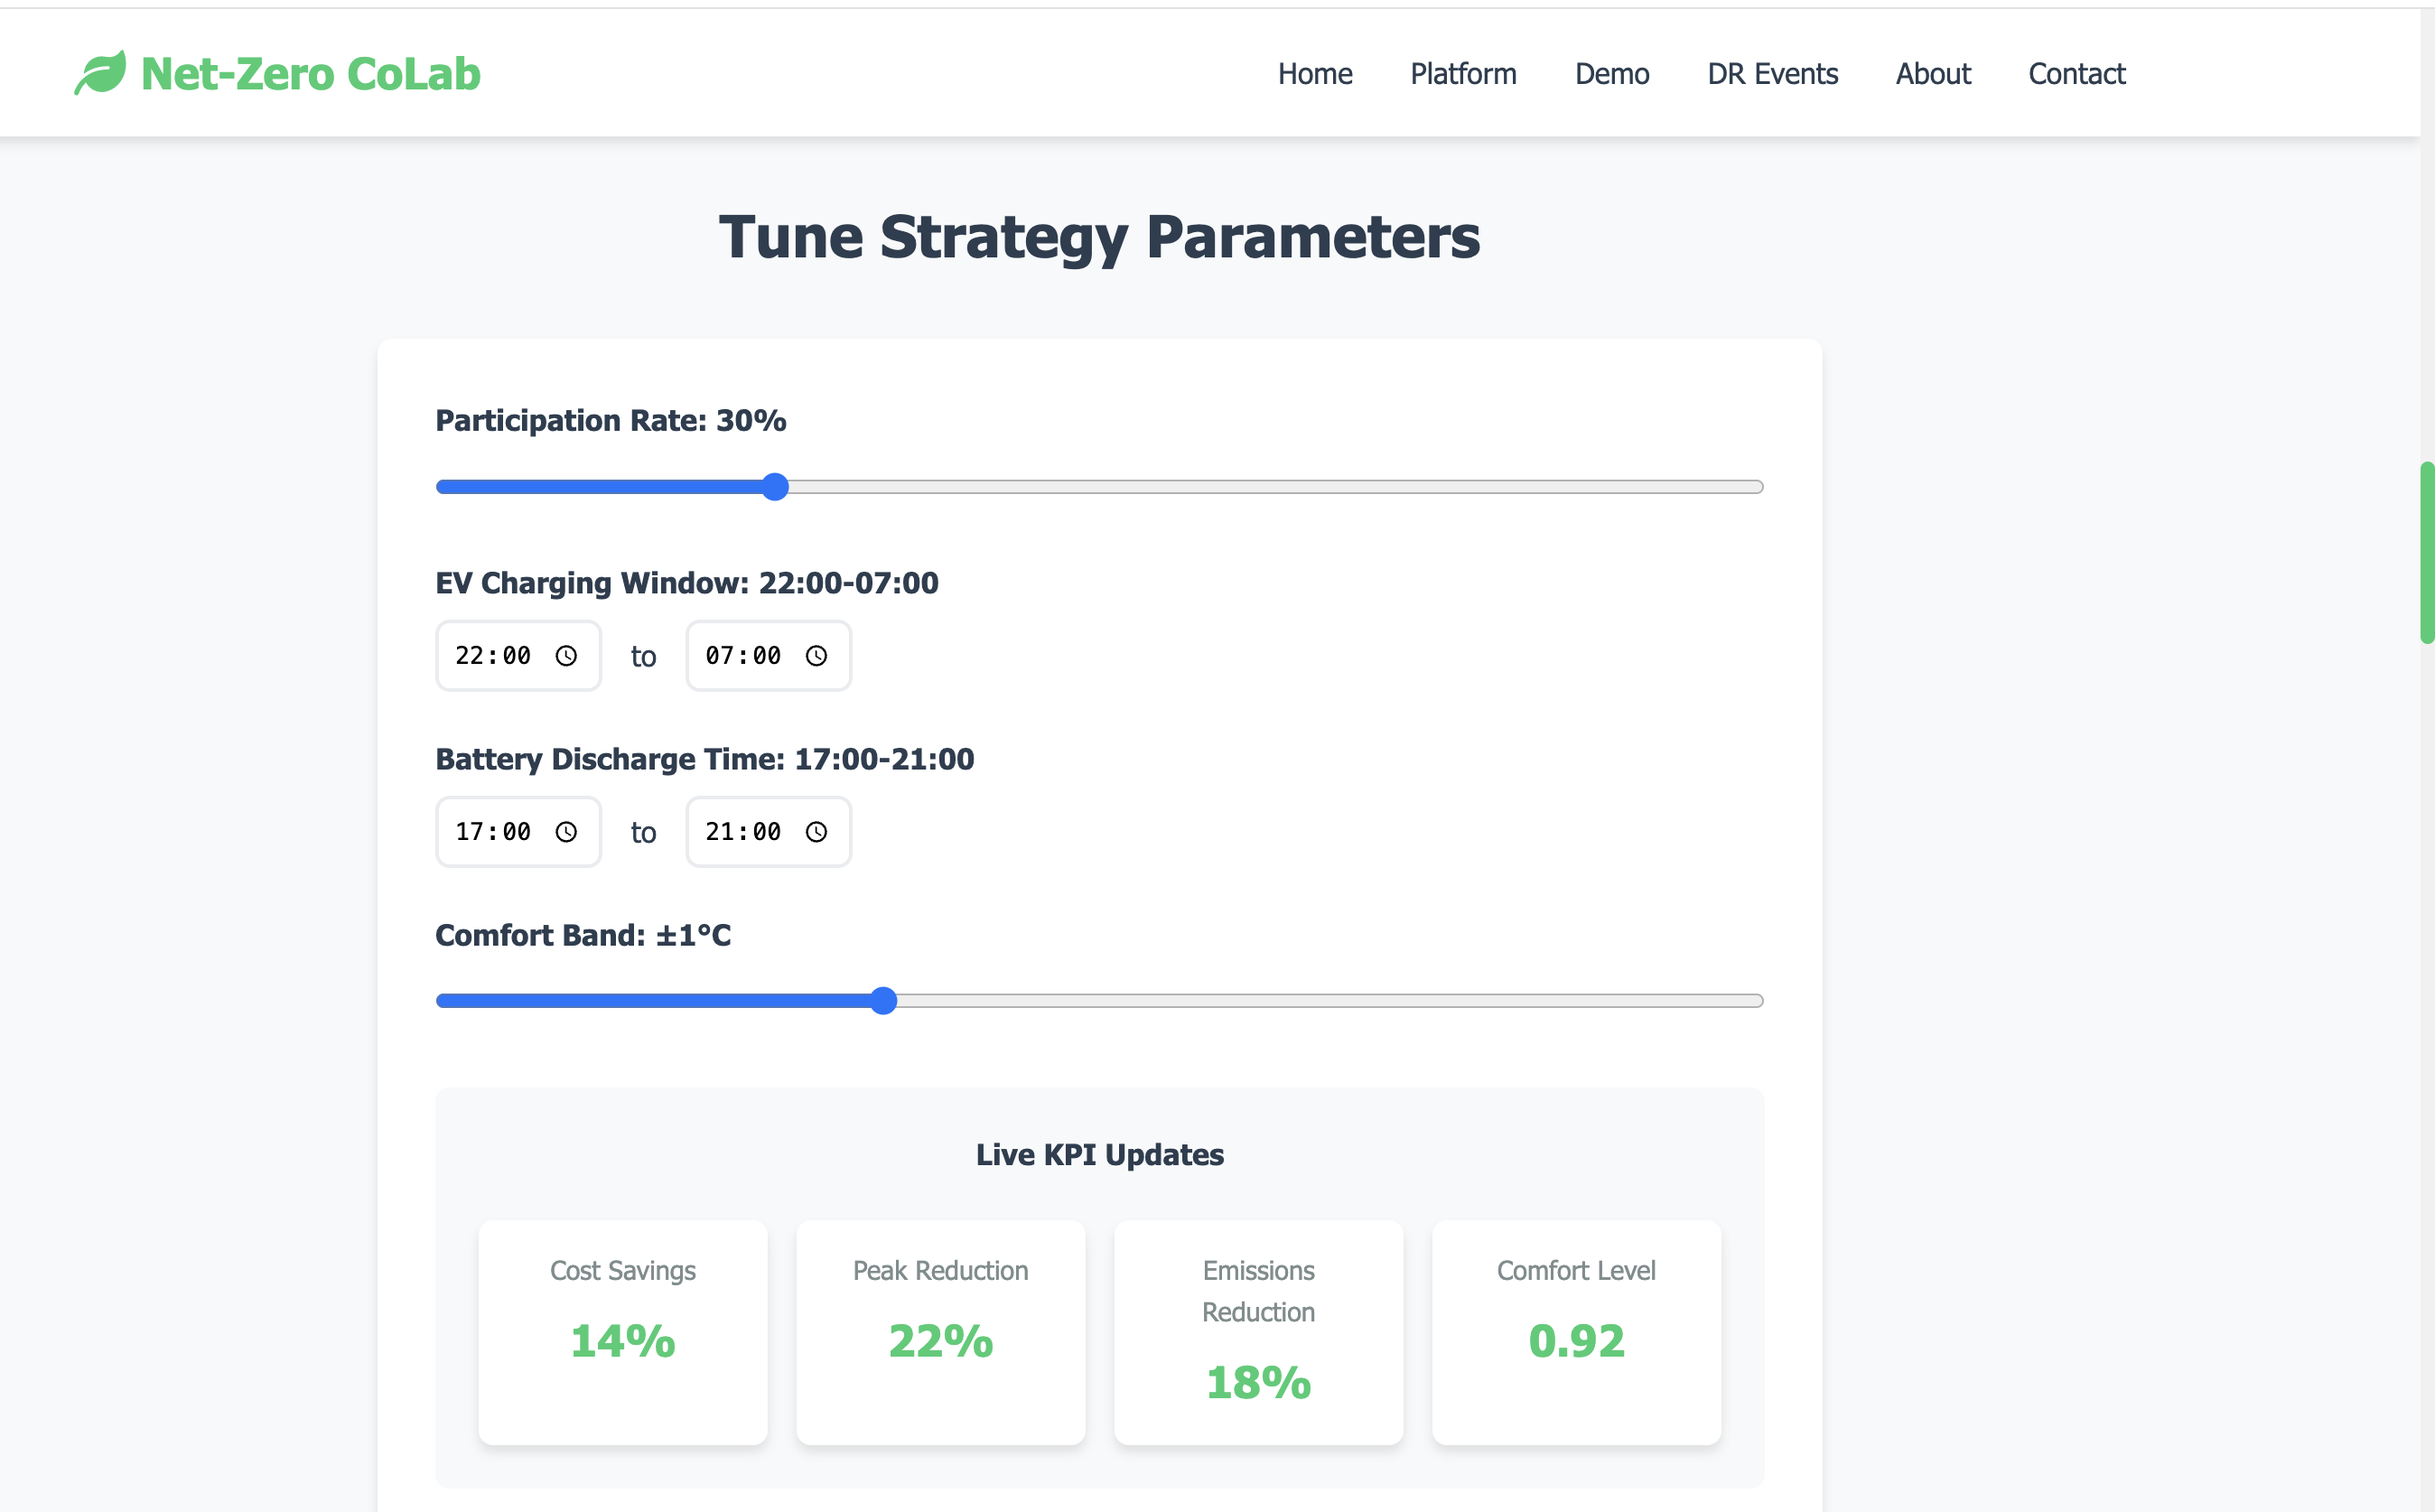
Tune Strategy Parameters
-
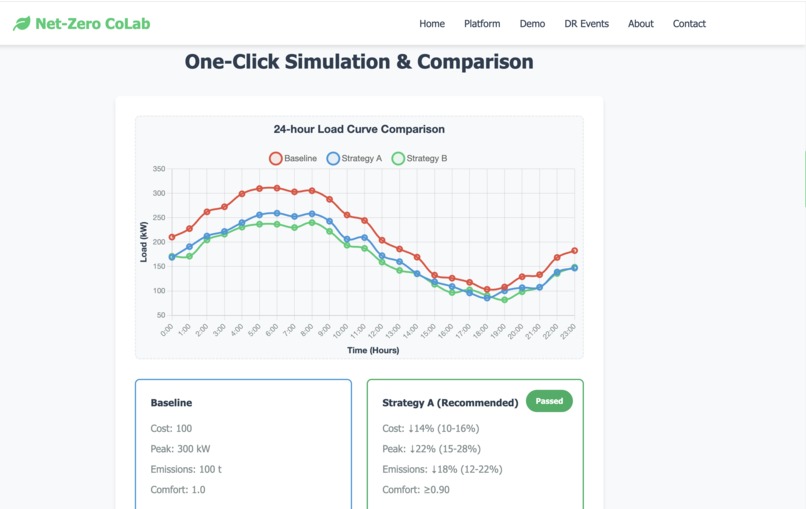
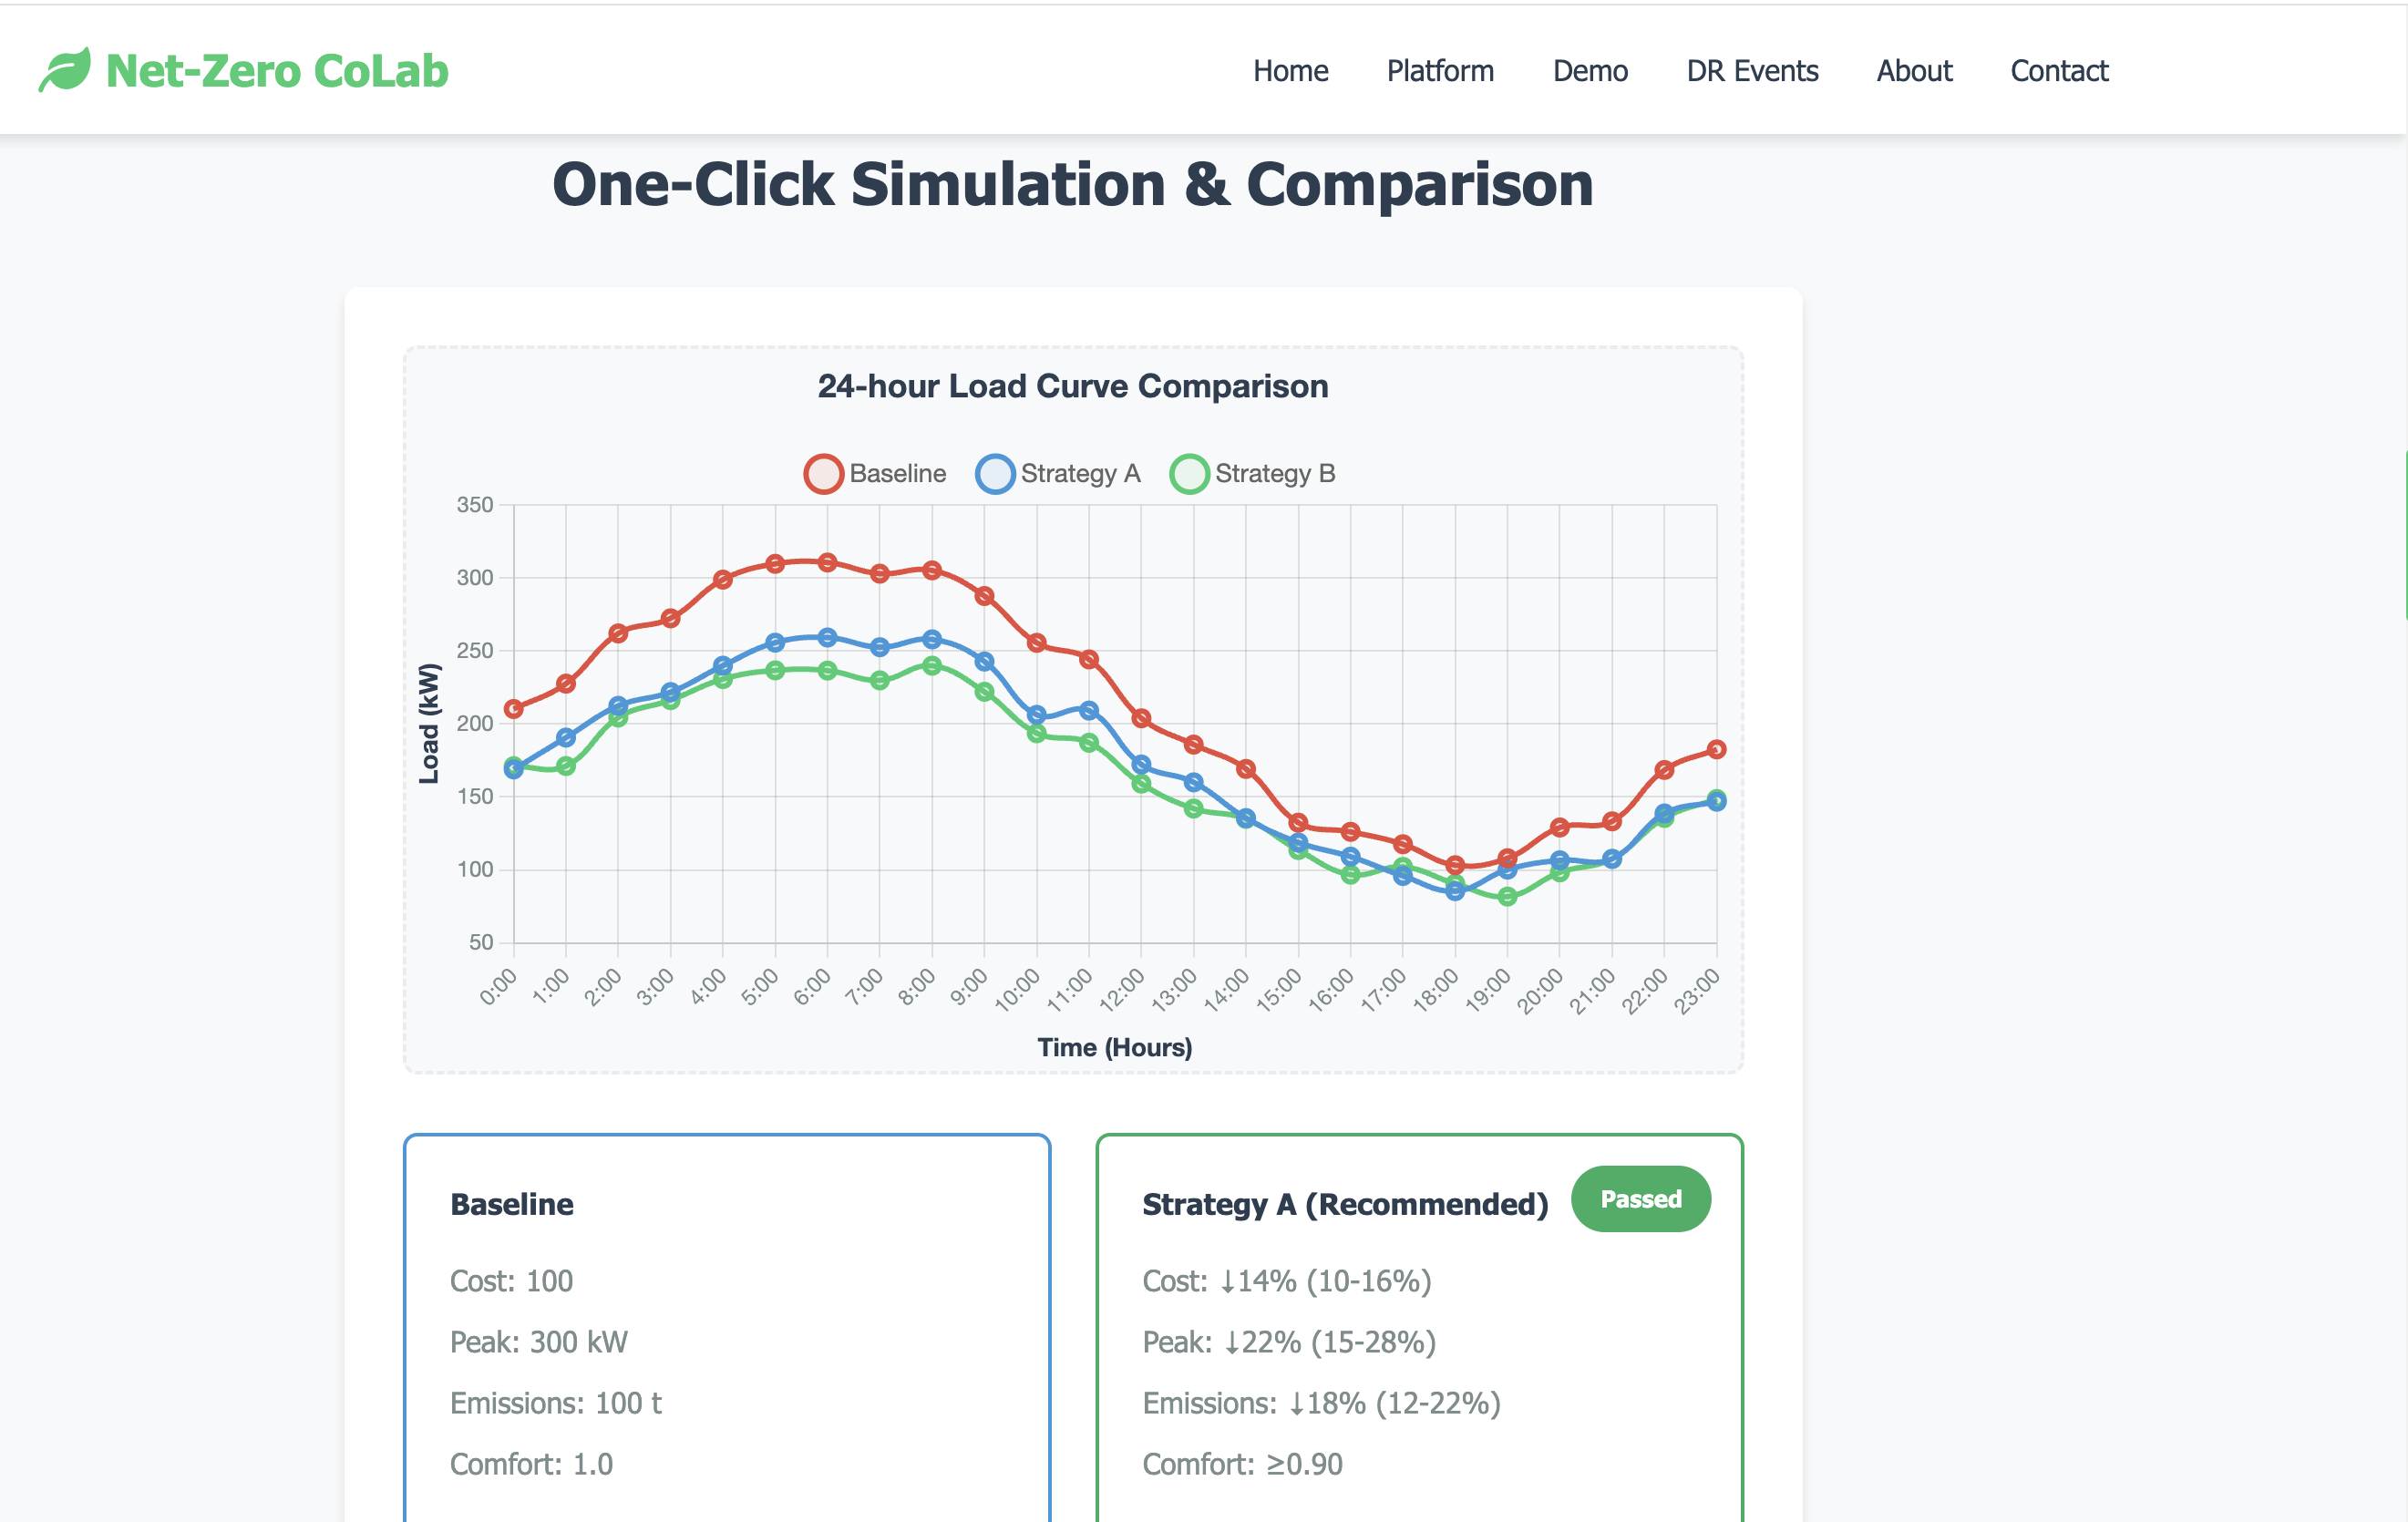
One-Click Simulation & Comparison
-
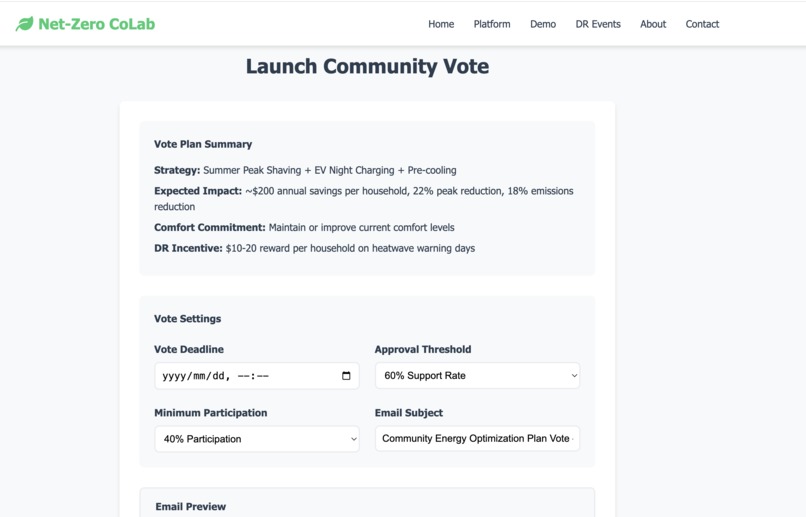
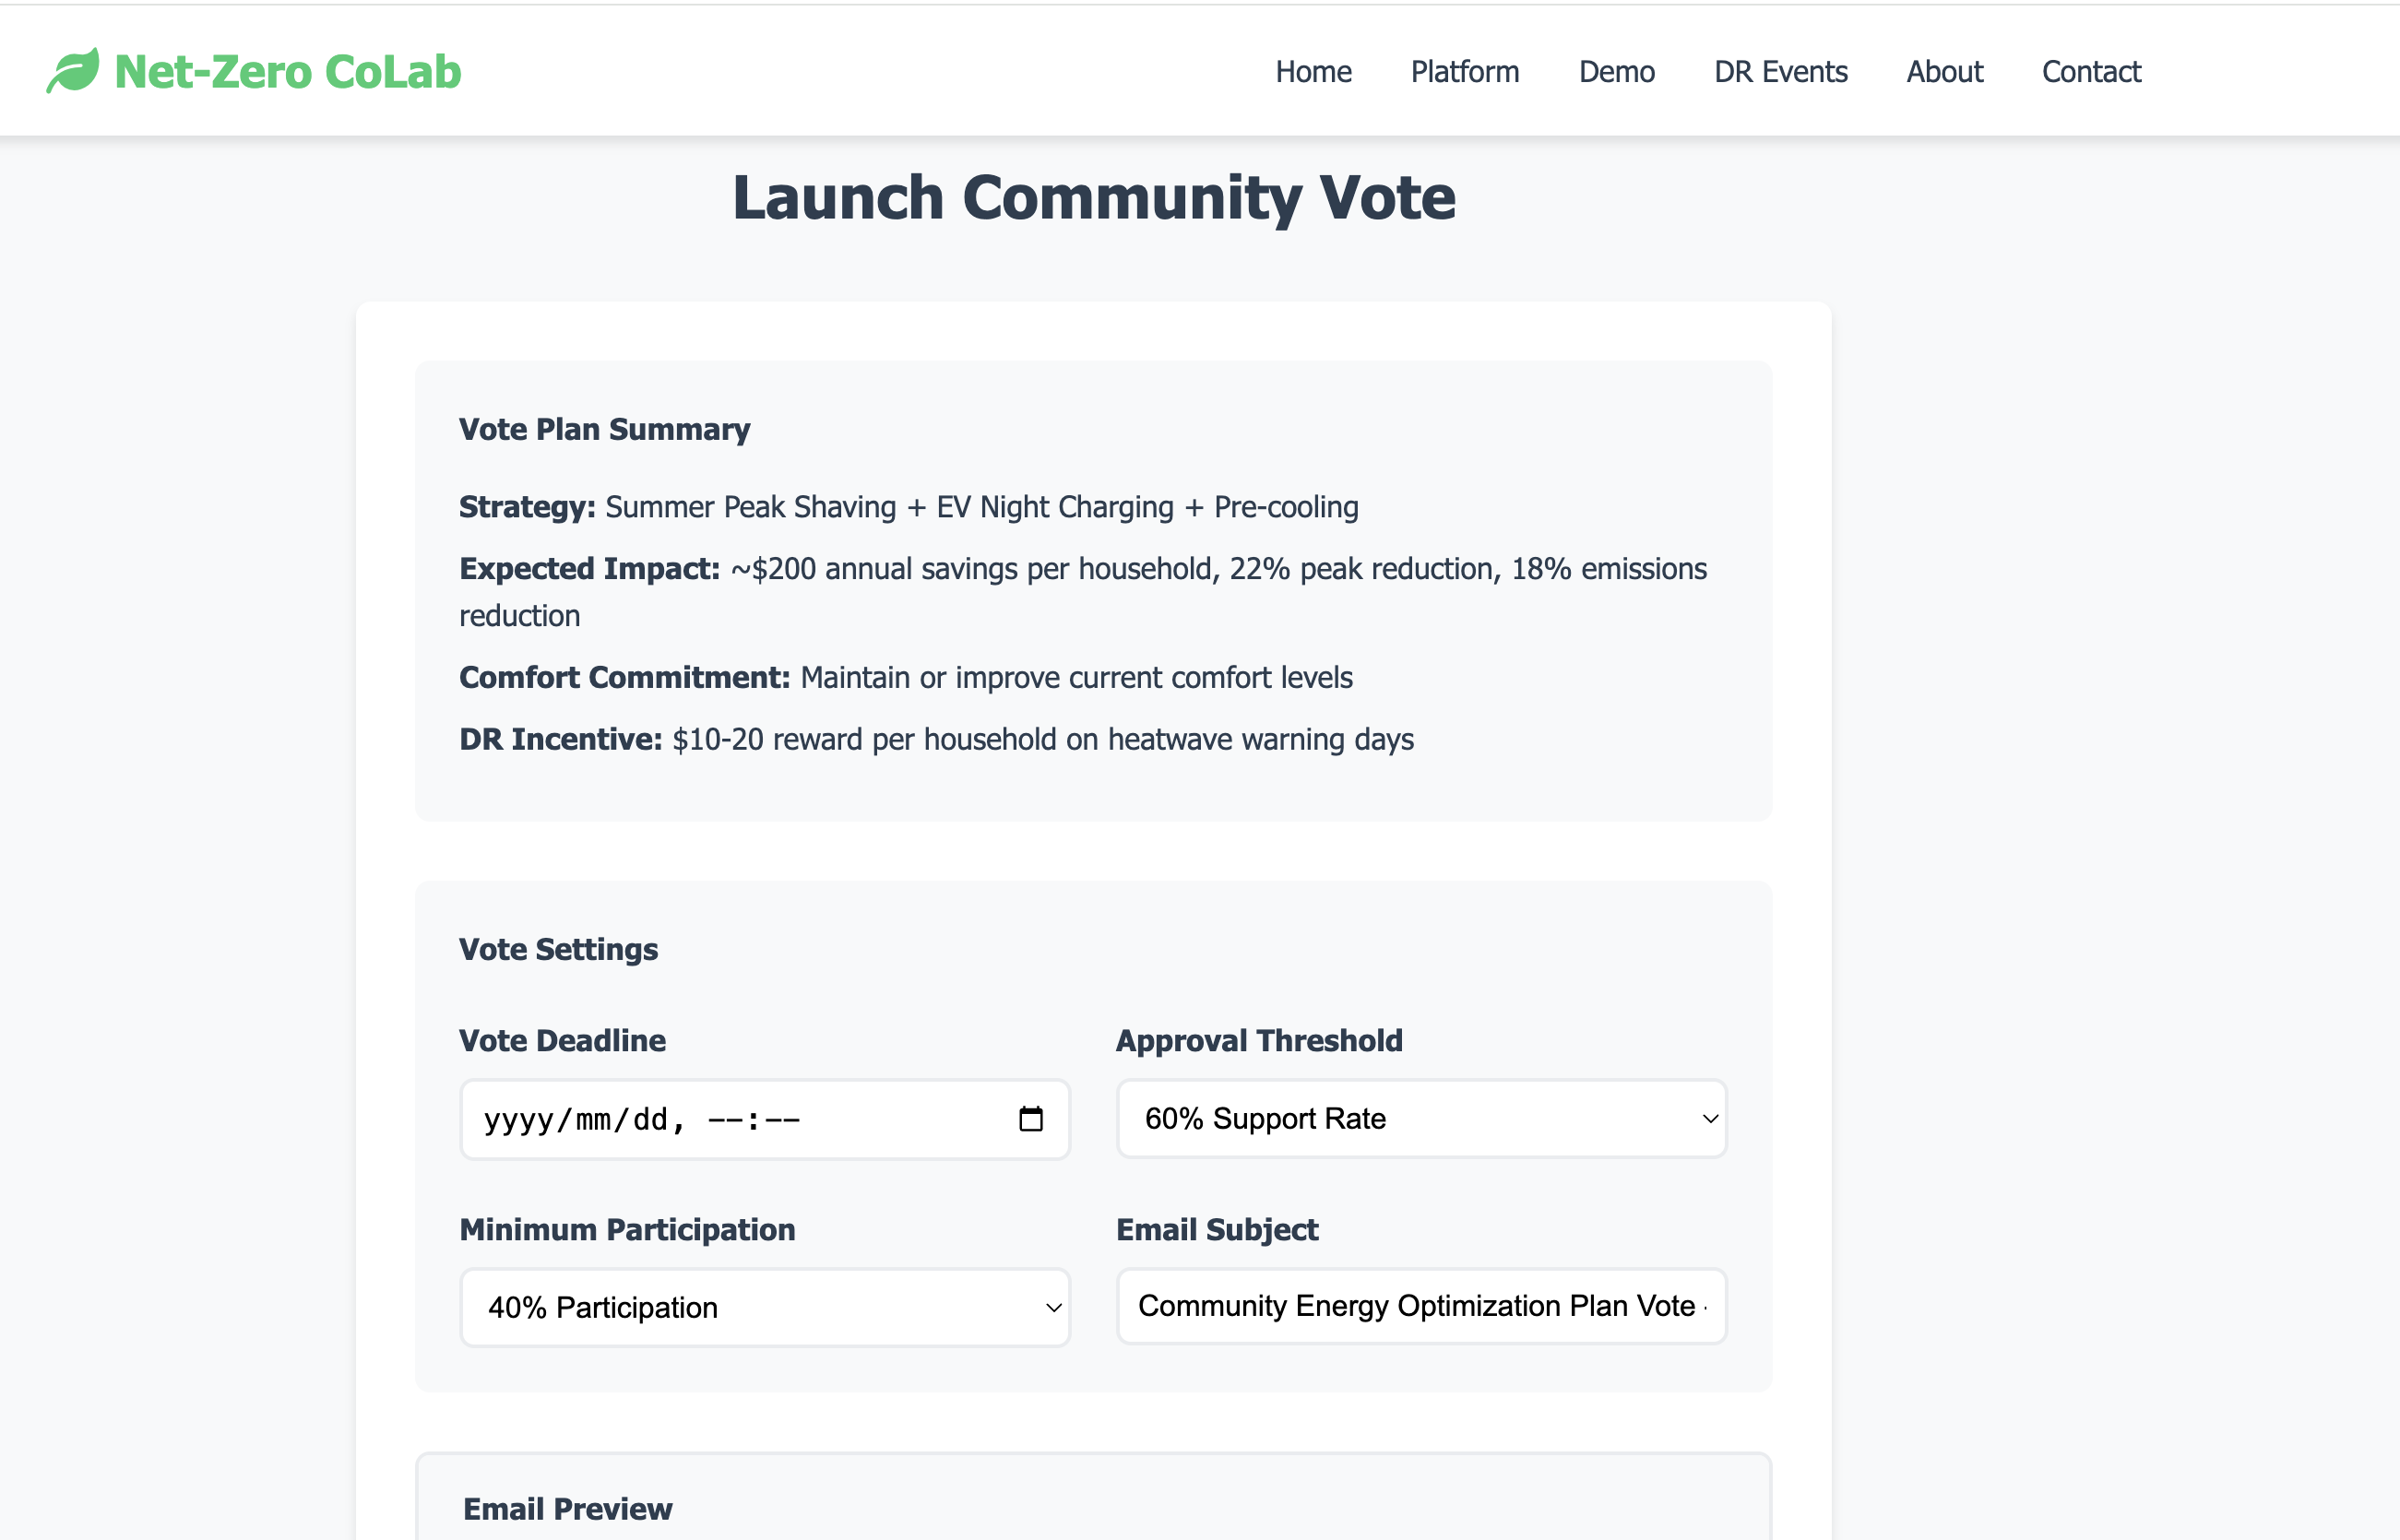
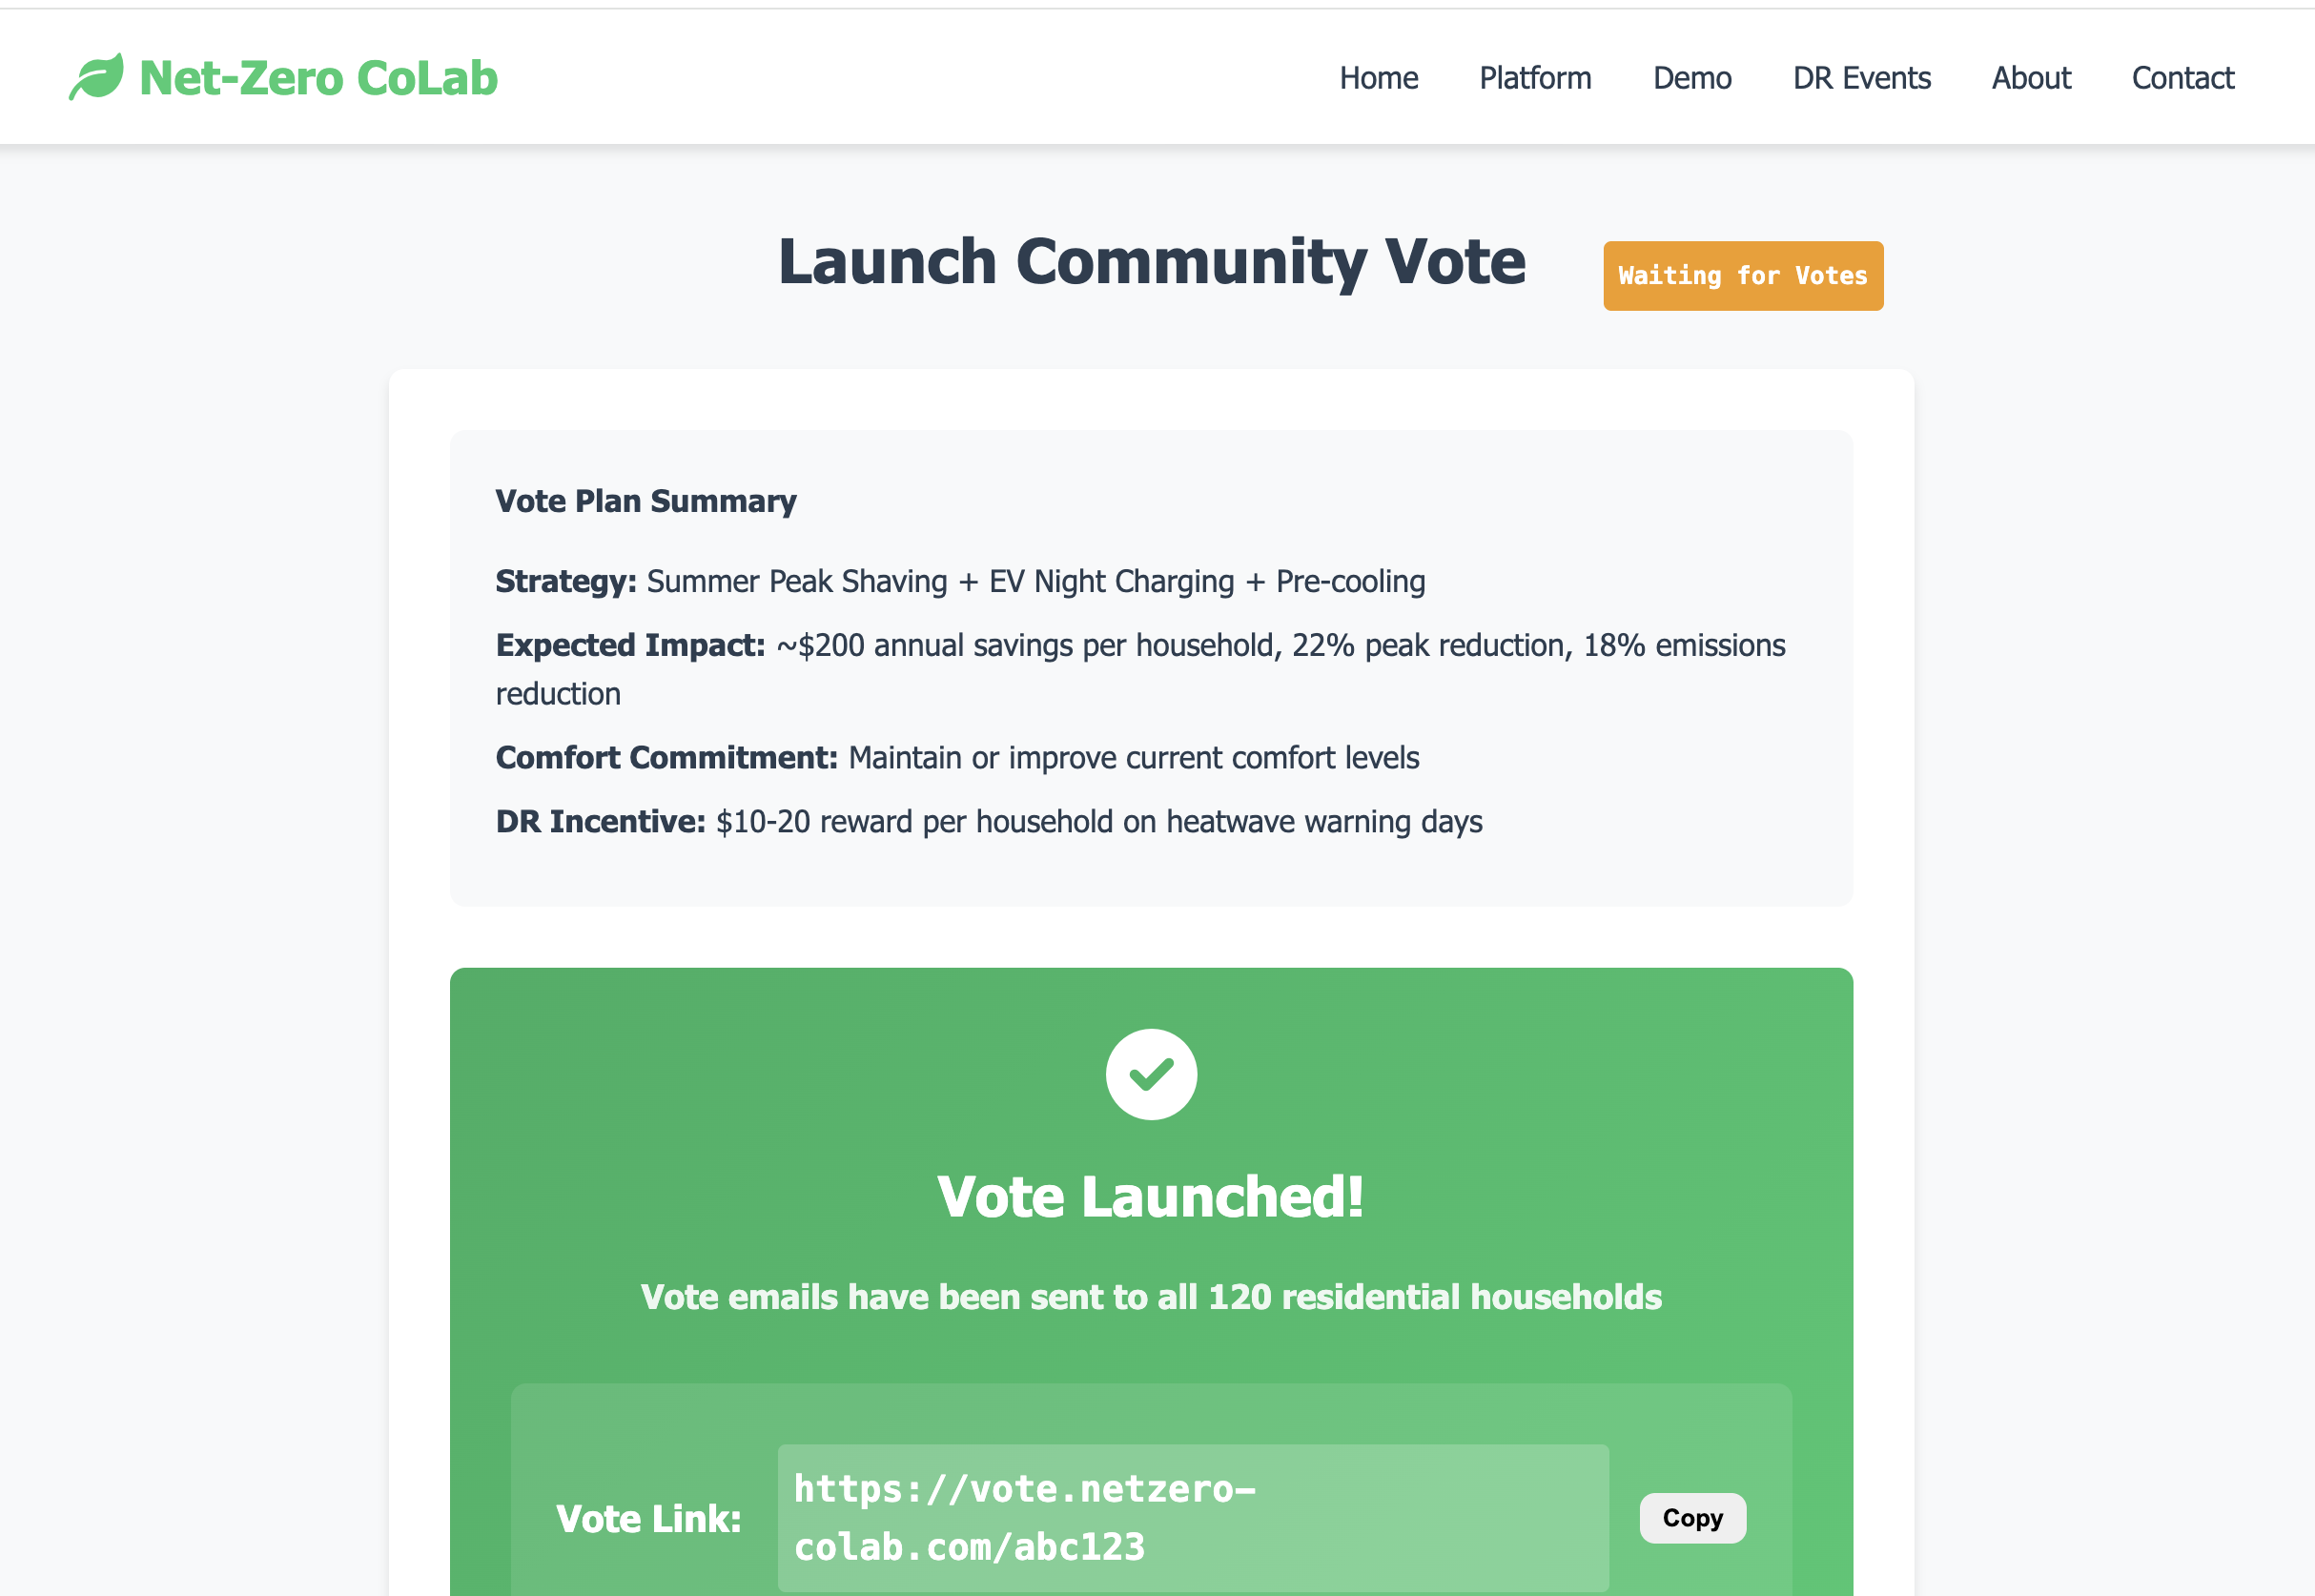
Launch Community Vote
-

Launch Community Vote
-
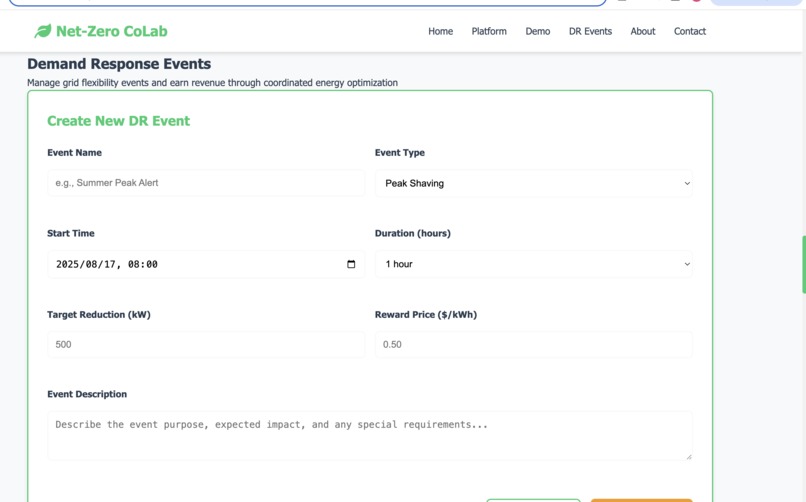
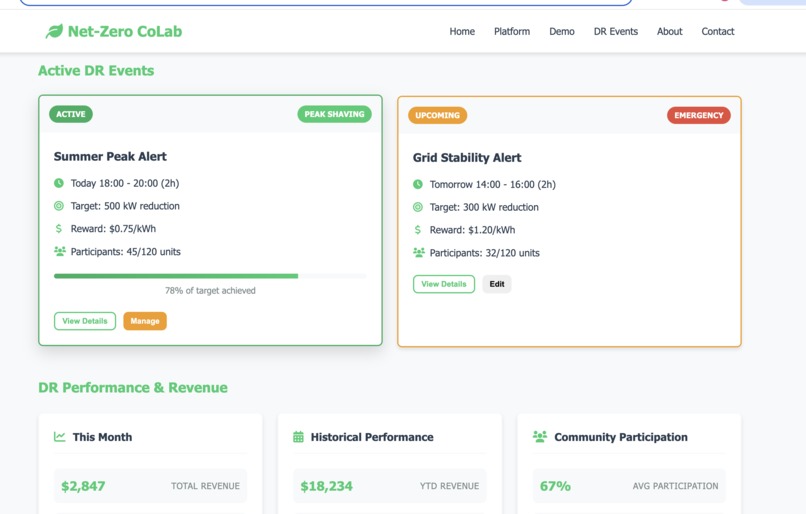
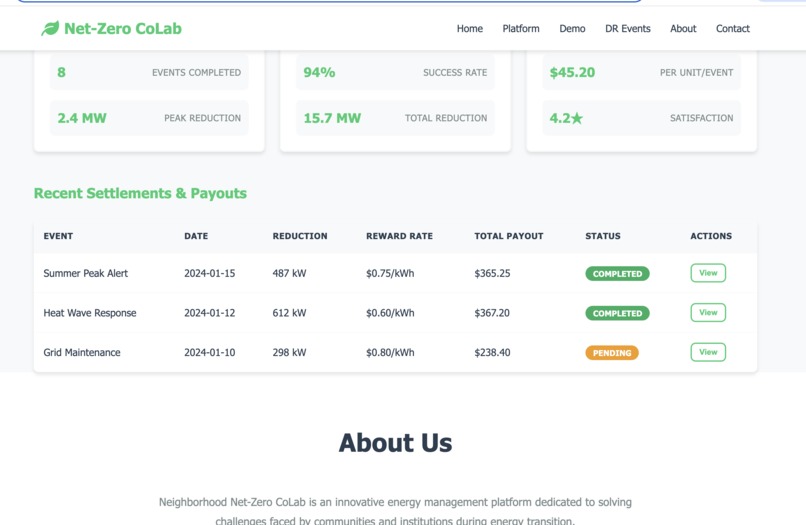
Demand Response Events
-
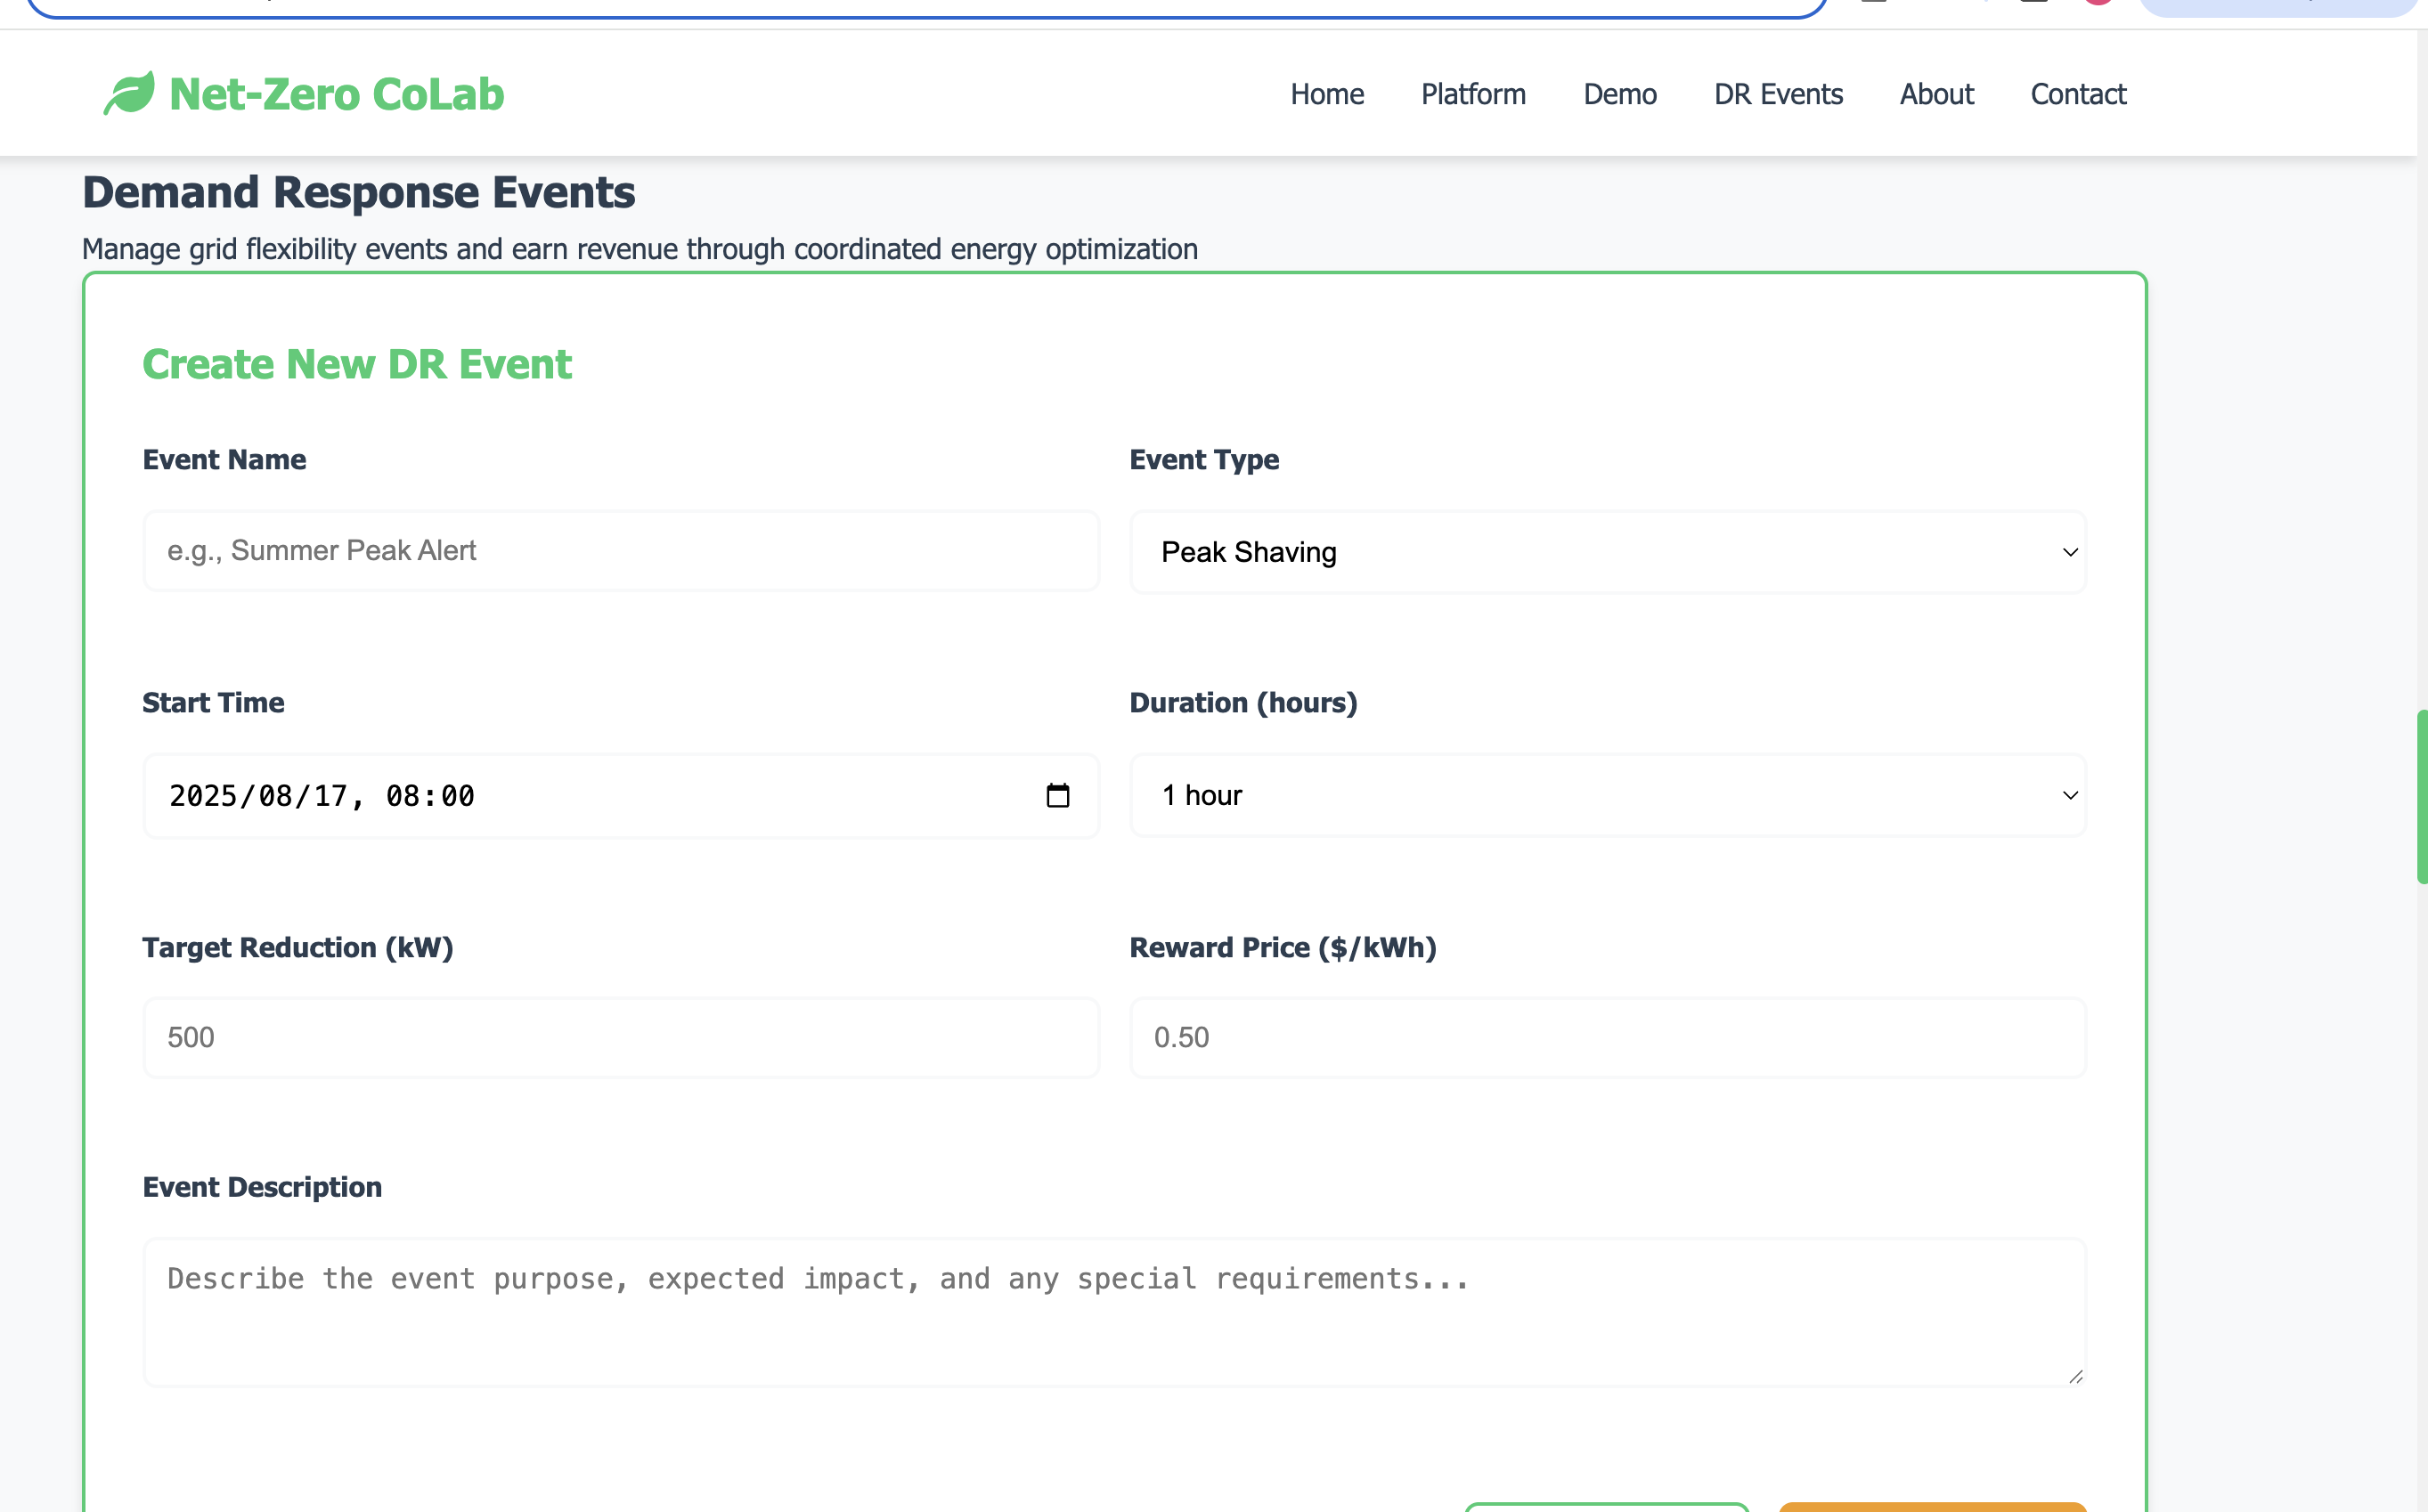
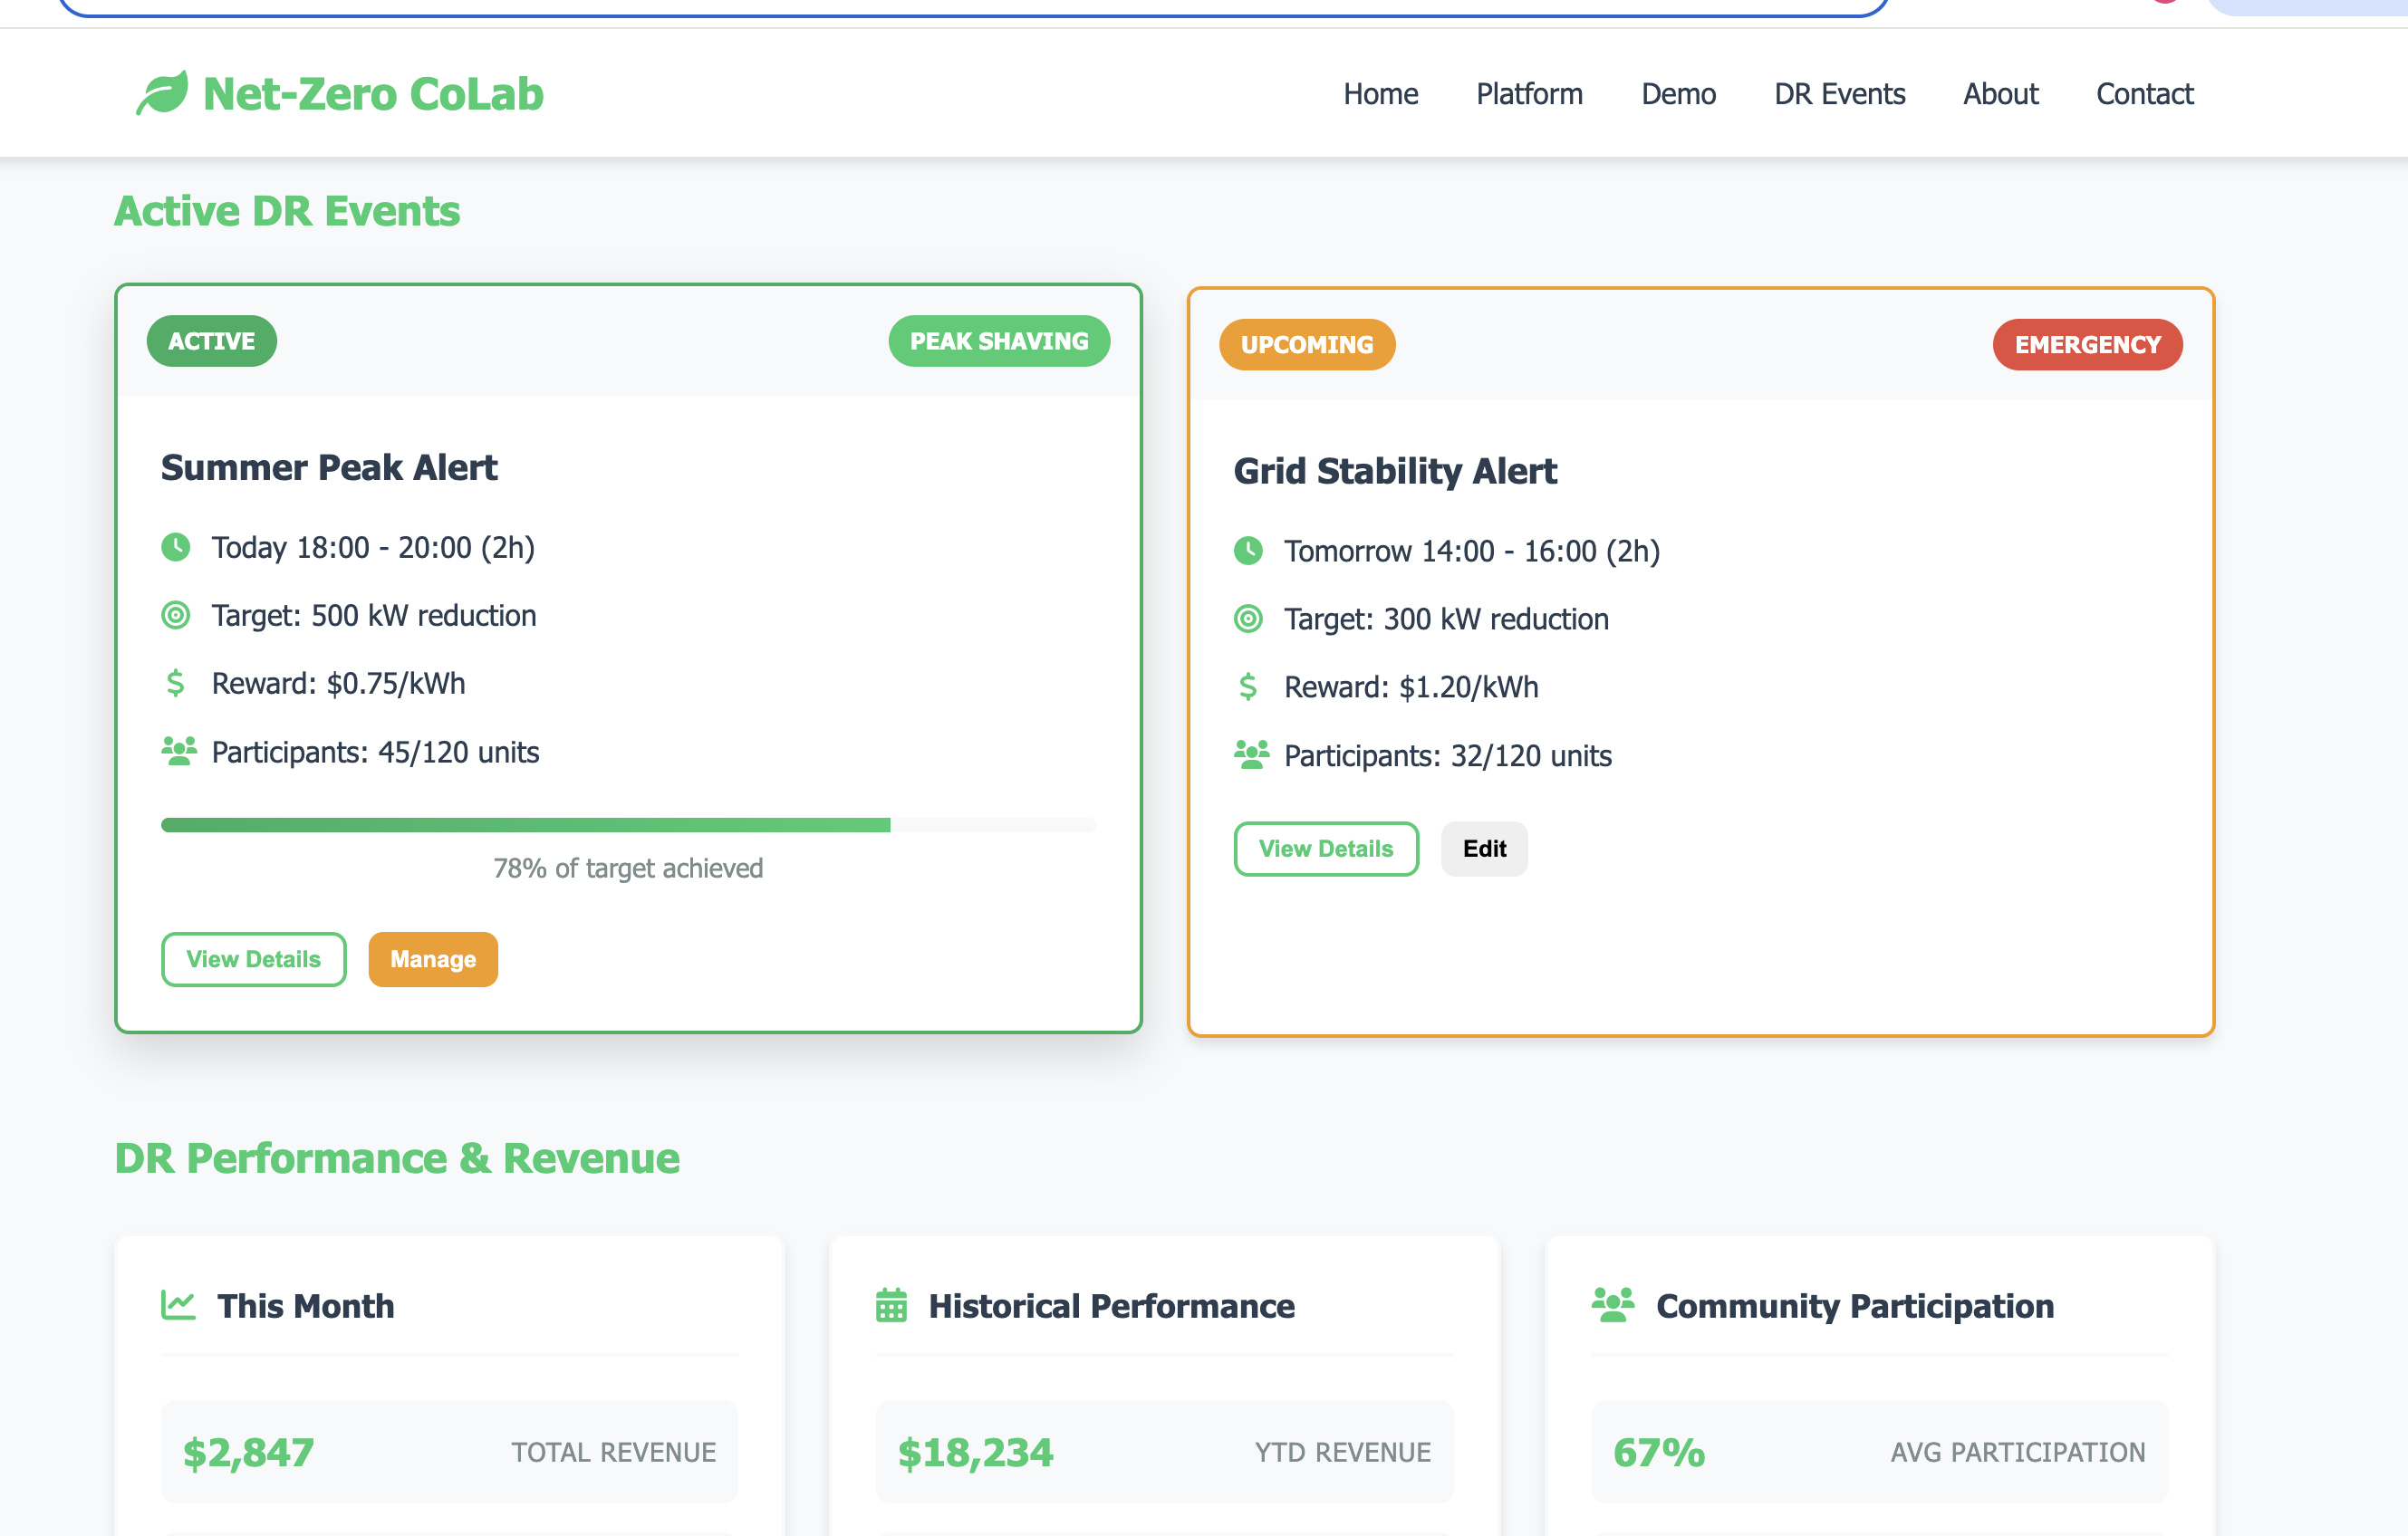
Demand Response Events
-
Demand Response Events
Inspiration
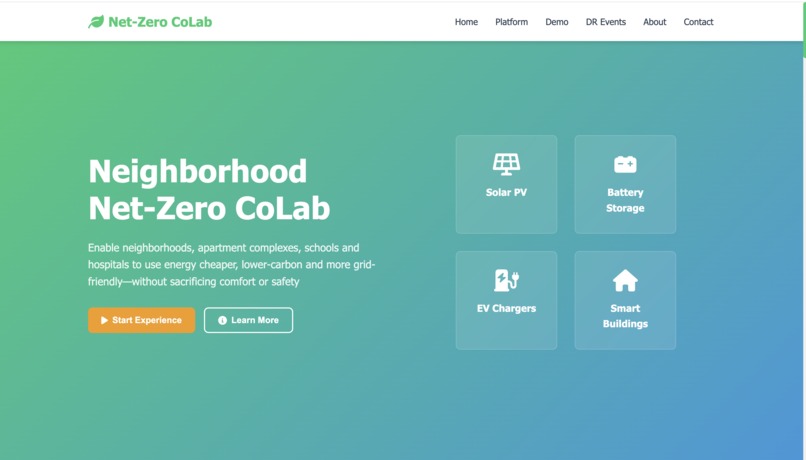
Communities want cheaper, cleaner, more reliable energy—but decisions are slow and messy: “Which tariff?”, “When should EVs charge?”, “Will people complain about comfort?”, “Who pays/gets paid on DR days?” We built Neighborhood Net-Zero CoLab to turn that confusion into a clear, shared plan the community can understand, test, vote on, and run tomorrow.
What it does
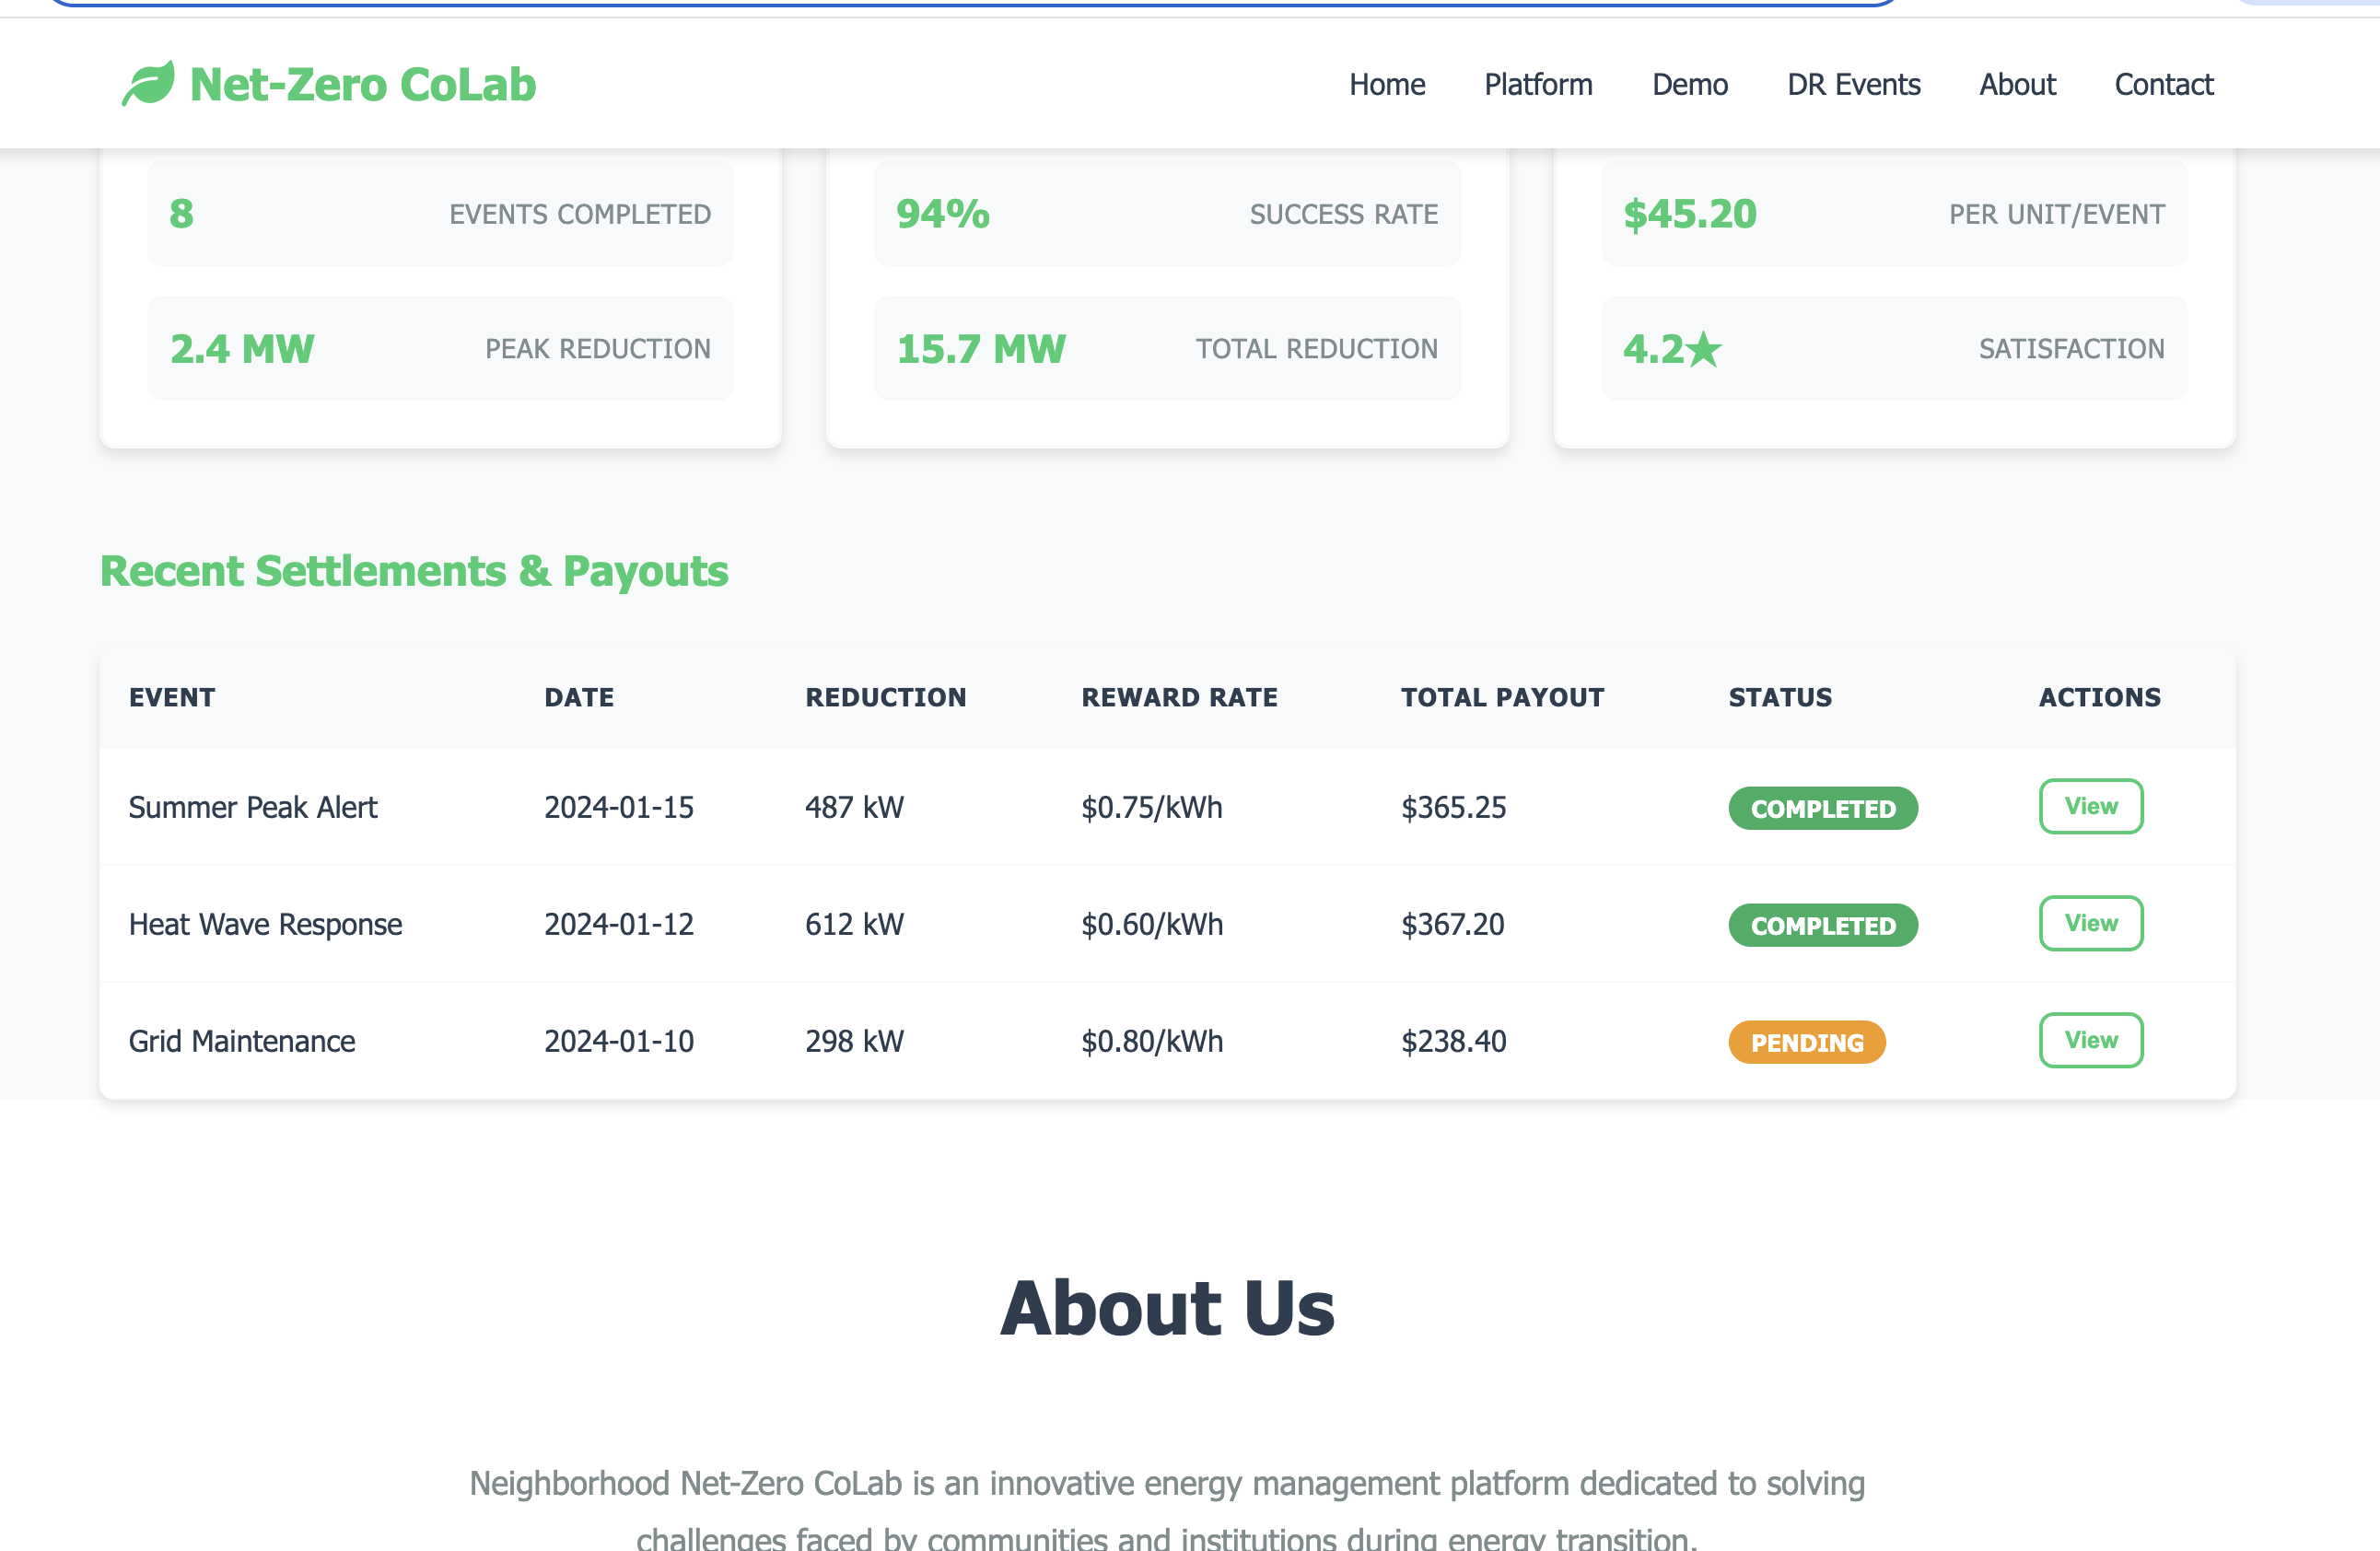
Builds a quick community profile (households, EV share, PV/battery, tariff). Matches a playbook card (e.g., “Summer peak-shave + EV night charging + pre-cooling”) with a match score. Lets you tune dials (participation, charging window, battery rules, comfort band) and see live KPIs. Runs a one-click simulation & comparison (Baseline vs Plan A/B) with P10/P50/P90 bands and an explicit comfort guardrail (≥ 0.90). Publishes a community vote page (thresholds, participation minimums) and then generates a “Tomorrow Plan” (CSV/ICS/JSON). Provides a DR Events page to set an event (time, target, price), auto-tweak the schedule, and show settlement math.
How we built it
Frontend only (hackathon prototype): HTML/CSS/JS, Chart.js for curves, localStorage for draft saves. Strategy match = simple feature distance on normalized site attributes (EV share, PV/battery, size, tariff). Simulation = scripted 24-hour curves with Monte Carlo style bands (P10/P50/P90) and rule checks: Objective: reduce cost/peak/emissions while holding comfort ≥ 0.90. Constraints: energy balance, battery power/SOC limits, EV “full by 07:00”. DR: event form → plan overlay (pre-charge, delay some EVs, shave peak) → settlement formula (baseline − actual) × price.
Challenges we ran into
Making the math explainable to non-engineers (hence P10/P50/P90 bands and “comfort first” badges). Keeping the prototype fully client-side while still showing realistic flows (vote, DR, payouts). Designing guardrails so “better savings” plans don’t quietly break comfort or EV completion.
Accomplishments that we're proud of
A full end-to-end flow in one session: profile → match → tune → simulate → vote → plan → DR. Clear, human-readable outcomes: “cost ↓14% (10–16%), peak ↓22% (15–28%), emissions ↓18% (12–22%), comfort ≥ 0.90.” A playbook card format that’s reusable across similar sites and easy to copy, edit, and re-deploy.
What we learned
Communities decide faster when they can see side-by-side curves and simple thresholds. Comfort and trust are the real adoption levers; transparency beats black-box optimization.
What's next for Neighborhood Net-Zero Colab
Live data integration (utility meters, OCPP chargers, BMS/HVAC) and automated dispatch. Playbook library expansion with evidence grades (e.g., “reproduced 3× → Silver”). SaaS rollout (per-site monthly) plus DR revenue-share with retailers/aggregators. Multi-site ops: portfolio view, alerts, and continuous M&V with verified payouts.


Log in or sign up for Devpost to join the conversation.