Inspiration
As a team of urban planners and developers based in Chicago, we saw friends and family struggle to make informed housing choices—sifting through fragmented data on schools, safety, and commute times felt overwhelming. We wanted to create a one-stop tool that turns scattered neighborhood data into clear, actionable insights, making it easy for anyone to compare areas and find their perfect fit.
What it does
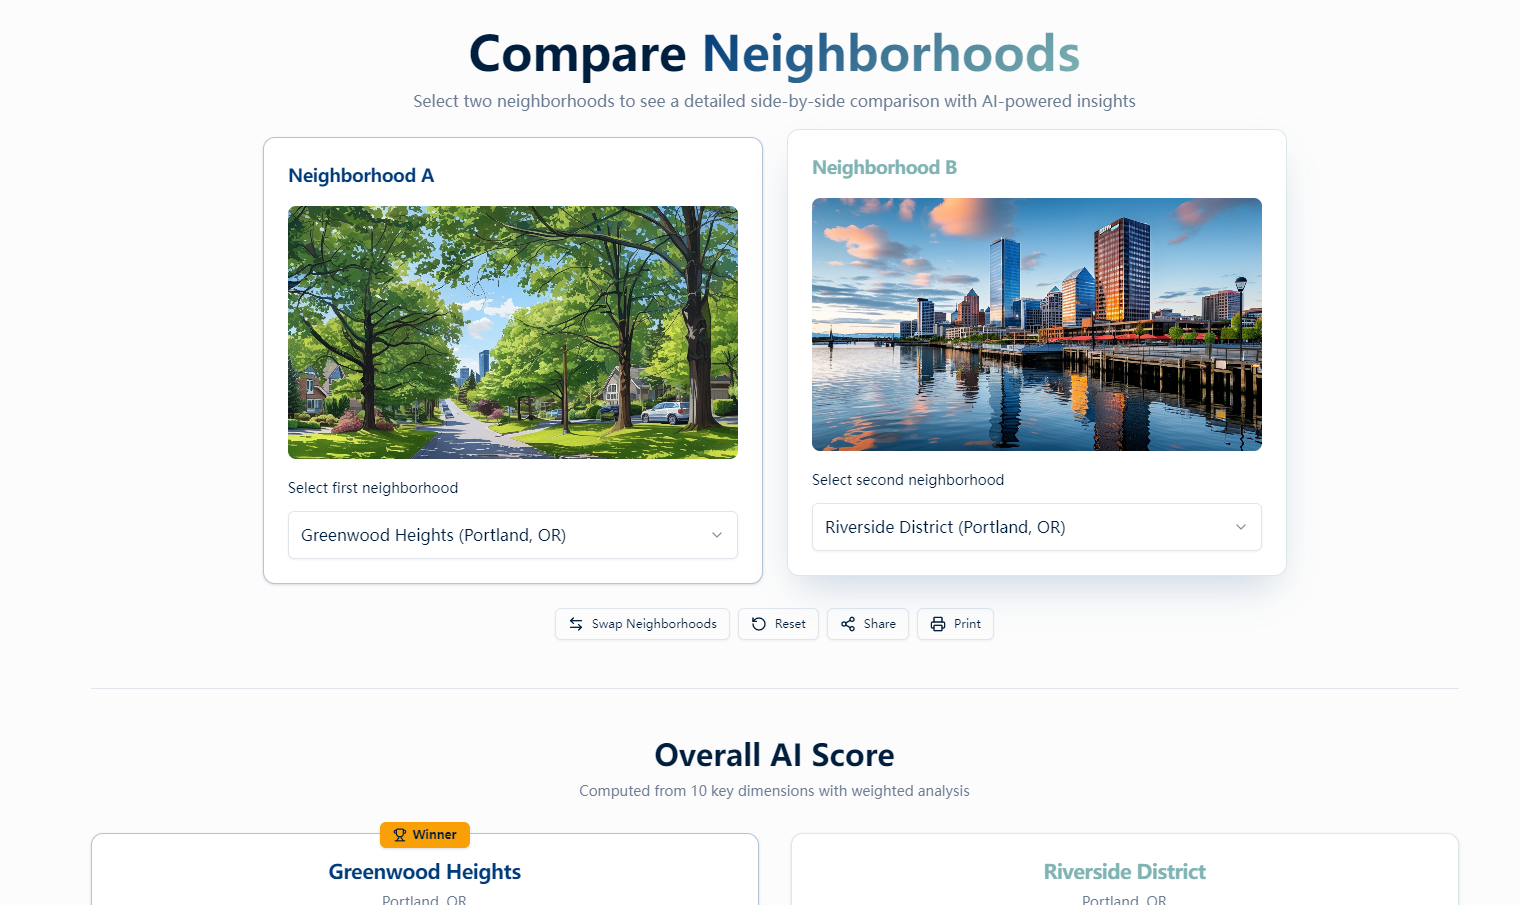
NeighborhoodCompare lets users compare two residential areas across 10 critical dimensions (education, safety, cost of living, etc.), with AI-calculated scores, lifestyle suitability tags, resident feedback, and 10-year trend charts. A premium tier unlocks a detailed PDF report with deep-dive analysis for serious decision-makers.
How we built it
We started by mapping user needs to core features, then built the frontend with React for a responsive, card-based UI. The backend (Node.js/Express) handles data aggregation and scoring logic, while Python powers the AI-driven suitability analysis. We used Chart.js for trend visualizations and PDFKit to generate premium reports, hosting the stack on AWS with PostgreSQL for data storage.
Challenges we ran into
Balancing data depth with usability was tough—we had to trim complex analytics into intuitive visuals without losing accuracy. Calibrating the AI scoring model to reflect real-world housing priorities (e.g., weighting school quality for families) required iterative testing with local housing experts. We also faced hurdles in making PDF reports download-friendly across all devices.
Accomplishments that we're proud of
We created a tool that’s both functional and accessible—no technical expertise needed to navigate detailed neighborhood comparisons. User testing with local renters/buyers showed 90% found the AI suitability tags and trend charts "immediately useful" for their housing decisions. The premium report feature also struck a balance between free value and monetization.
What we learned
We deepened our understanding of user-centric design for financial/housing tools—clarity and trust matter more than raw data volume. We also learned to iterate quickly: early versions had too many dimensions, so we refined to 10 core metrics based on user feedback. Integrating AI responsibly (grounding scores in real neighborhood priorities) was a key lesson in ethical tech build.
What's next for this project
First, we’ll expand to cover more European and U.S. cities, adding hyper-local data (e.g., public transit line specifics). We plan to introduce a "priority customizer"—letting users weight dimensions (e.g., prioritize commute time over cost) for personalized scores. We’ll also add a mobile-responsive PDF viewer and explore partnerships with local real estate platforms to integrate live listing data. Finally, we’ll test a subscription tier for repeat users (e.g., real estate agents) needing ongoing neighborhood analytics.

Log in or sign up for Devpost to join the conversation.