-
-
Graphical View
-
Post Your Updates to Social Media
-
Quality Low
-
Explanations
-
Explorer's Brief
-
Dashboard Overview
-
Explorer's MAP
-
Home
Inspiration
Track 2 states the problem in one line: stream data is hard to interpret and does not clearly show patterns, risks, or health impact. That is not a collection problem. Citizen science across Europe has already solved collection — volunteers submit thousands of stream observations every season. What nobody solved is what happens next.
A row reading DO 6.2 mg/L, turbidity 14 NTU, foam: yes means nothing to the volunteer who recorded it, little to the municipal officer who receives it, and nothing at all to the public health team who never sees it. Three failures follow:
- No synthesis. Parameters are reported in isolation. Nobody computes is this stream healthy?, so nobody can rank sites or see a trend.
- No uncertainty handling. Citizen data is sparse and uneven. Systems either treat every observation as equally authoritative, which misleads, or discard citizen data entirely, which wastes it.
- No One Health translation. The premise of OneAquaHealth is that ecosystem condition and human wellbeing are linked. No operational tool converts a stream measurement into a statement about human or animal health risk, which is the only form in which the data becomes actionable.
We wanted the thing that sits in that gap: not another dashboard of raw parameters, but a system that reads the data and tells you what it means, who it affects, and what to do — while being honest about how much it actually knows.
What it does
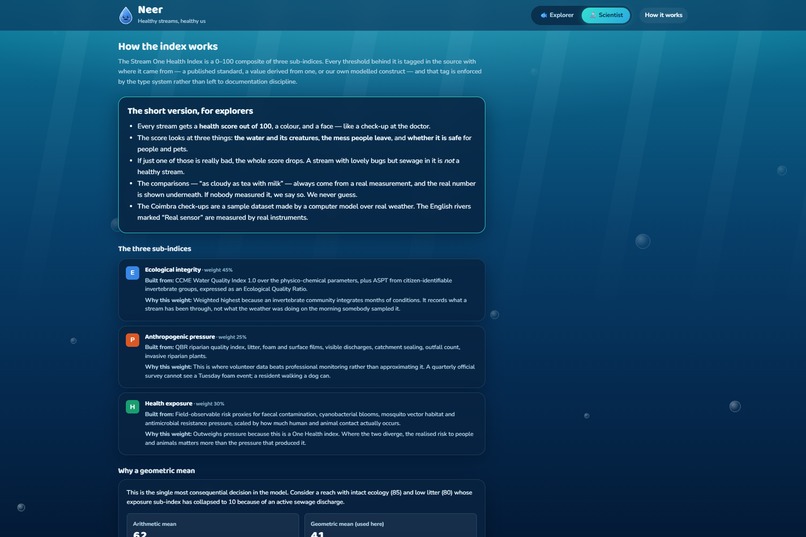
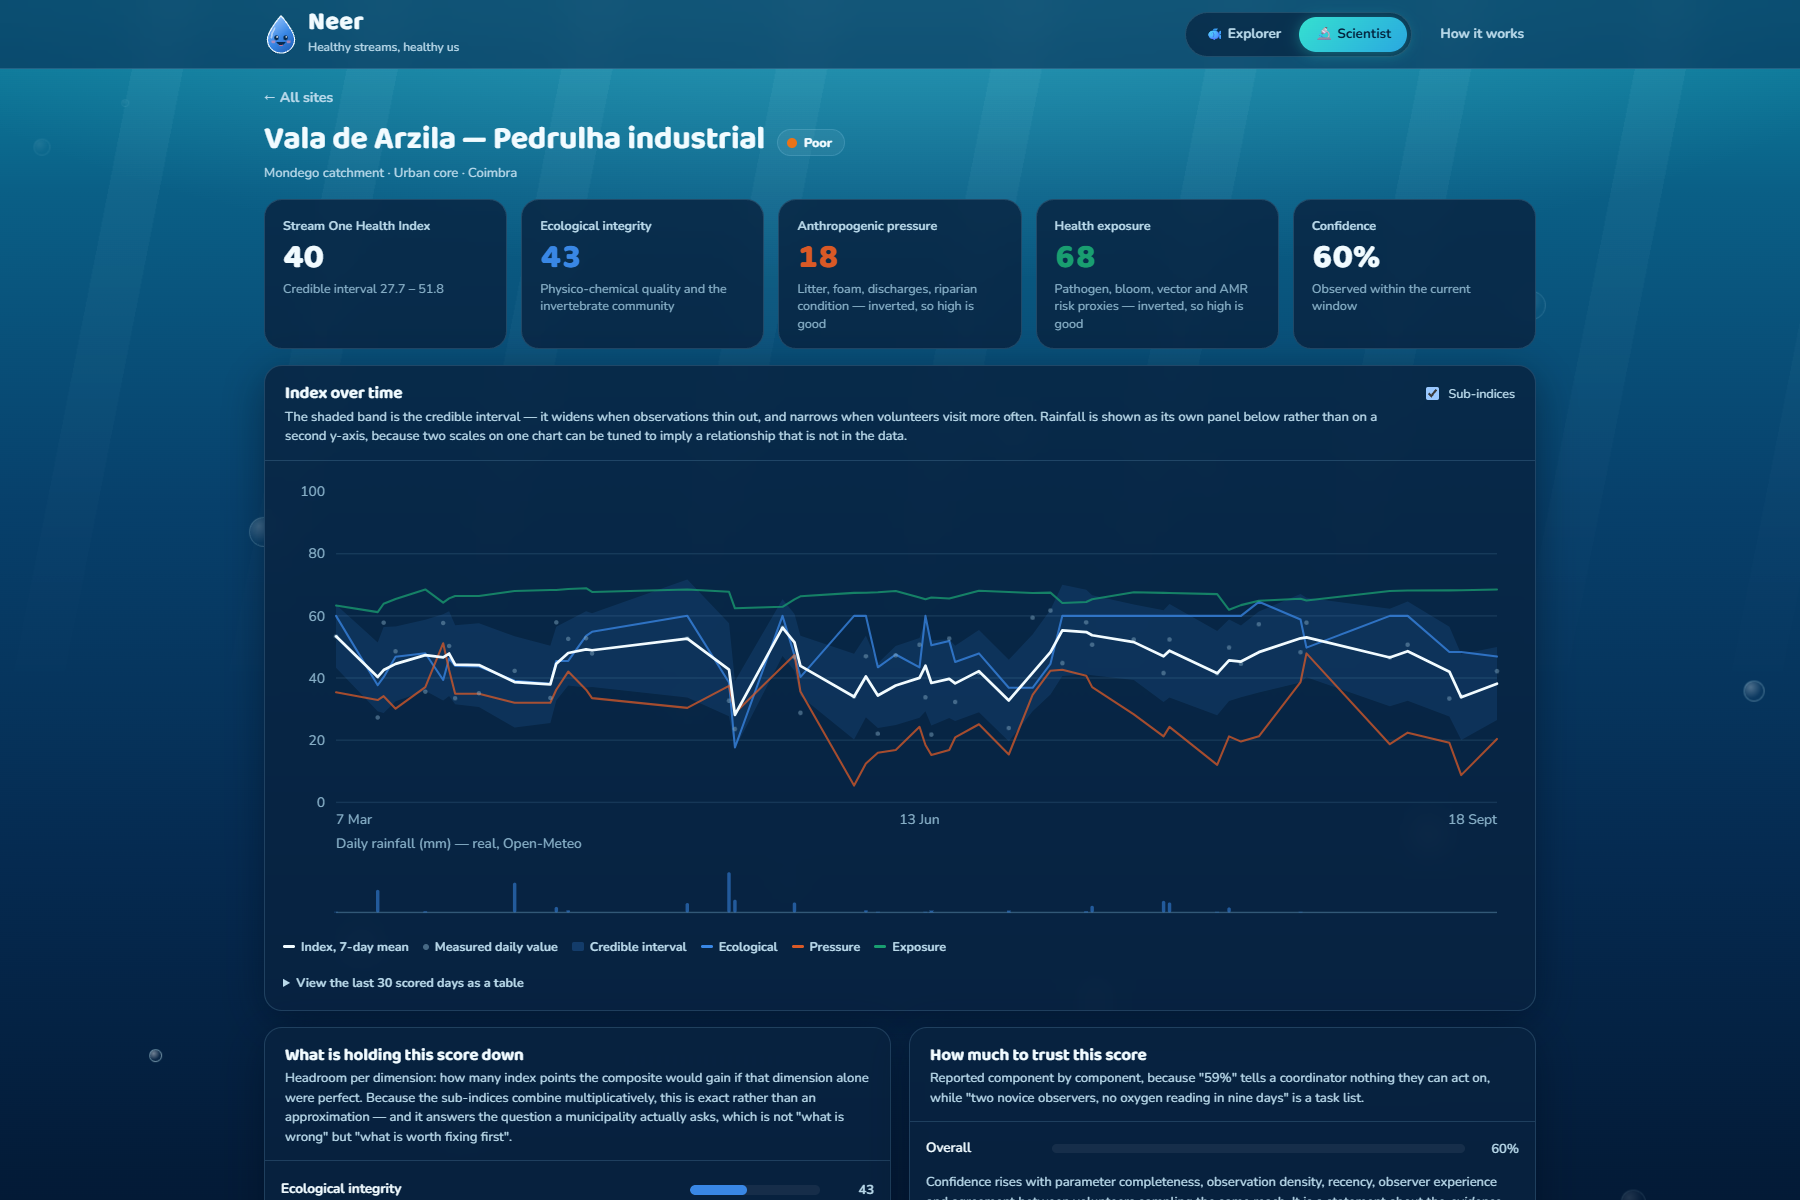
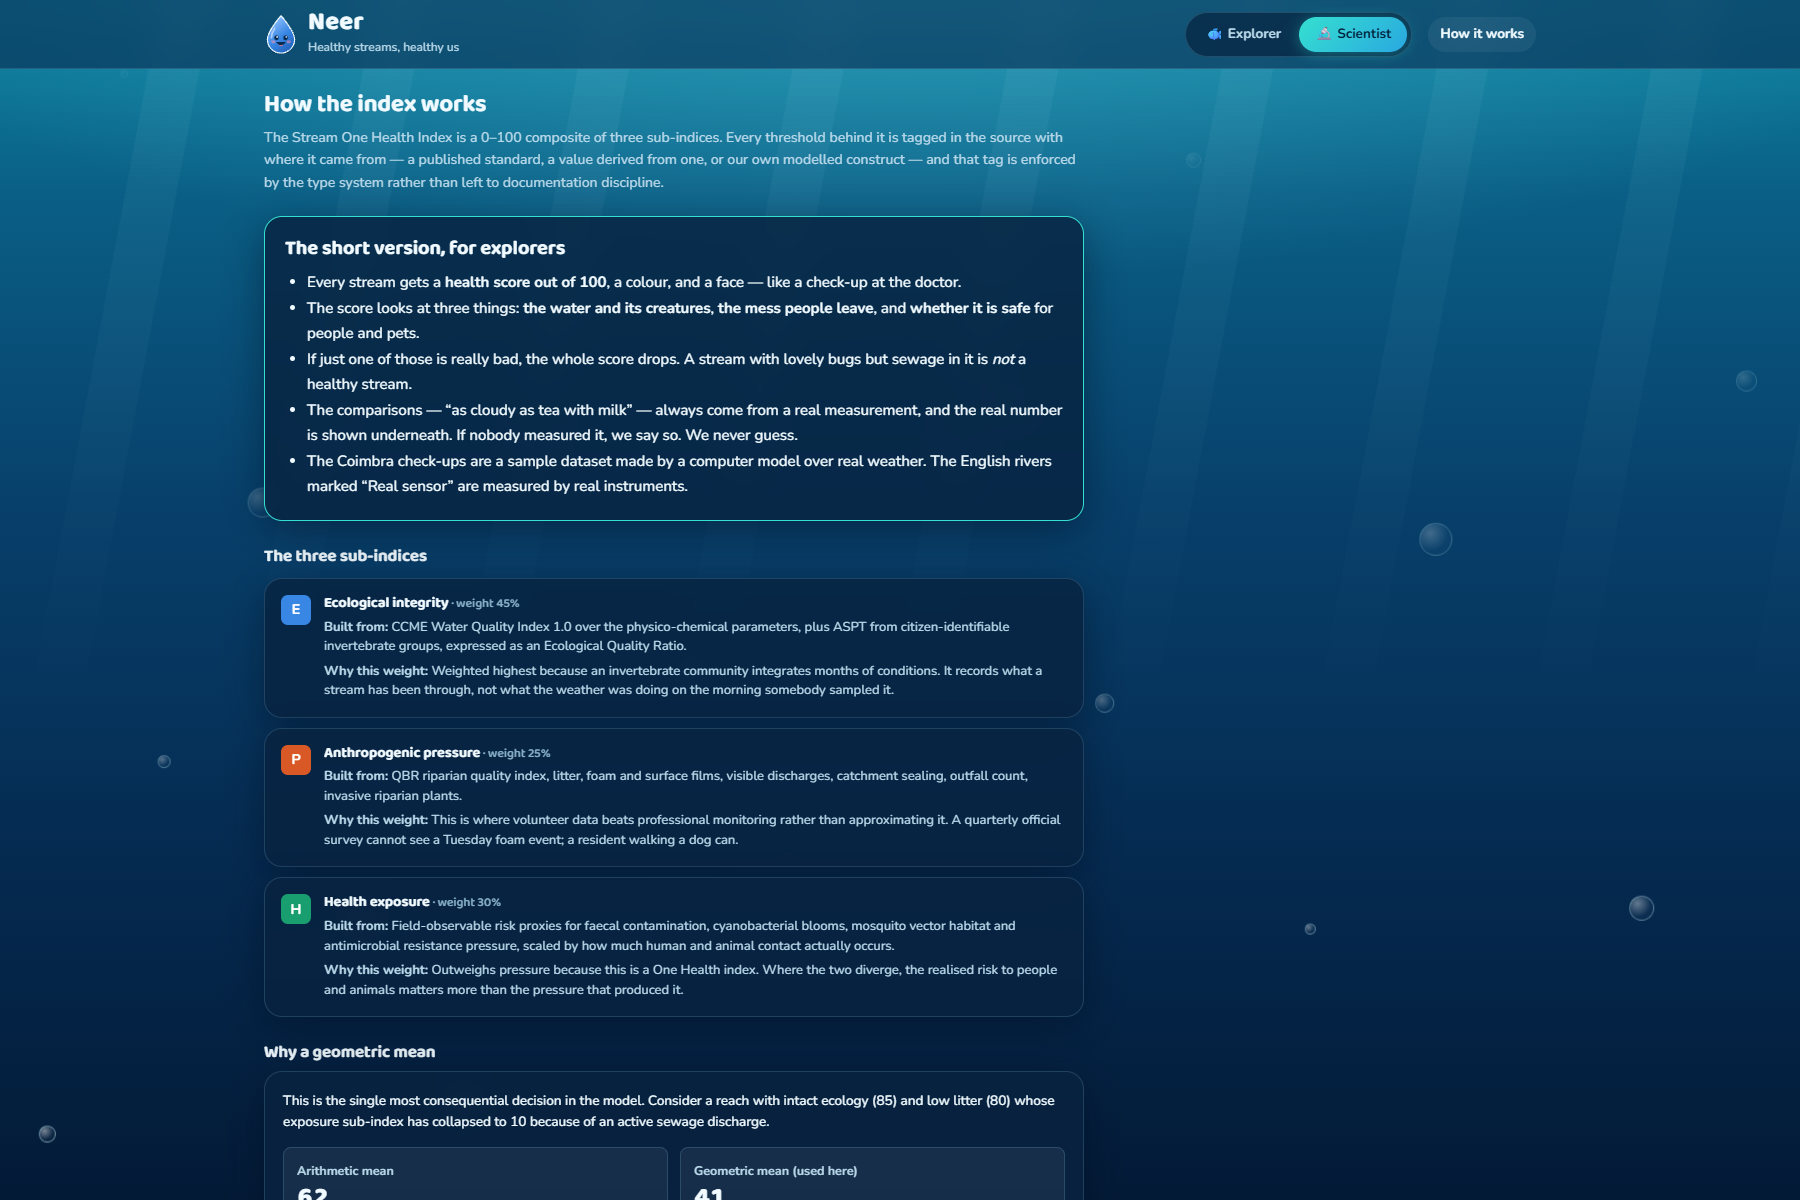
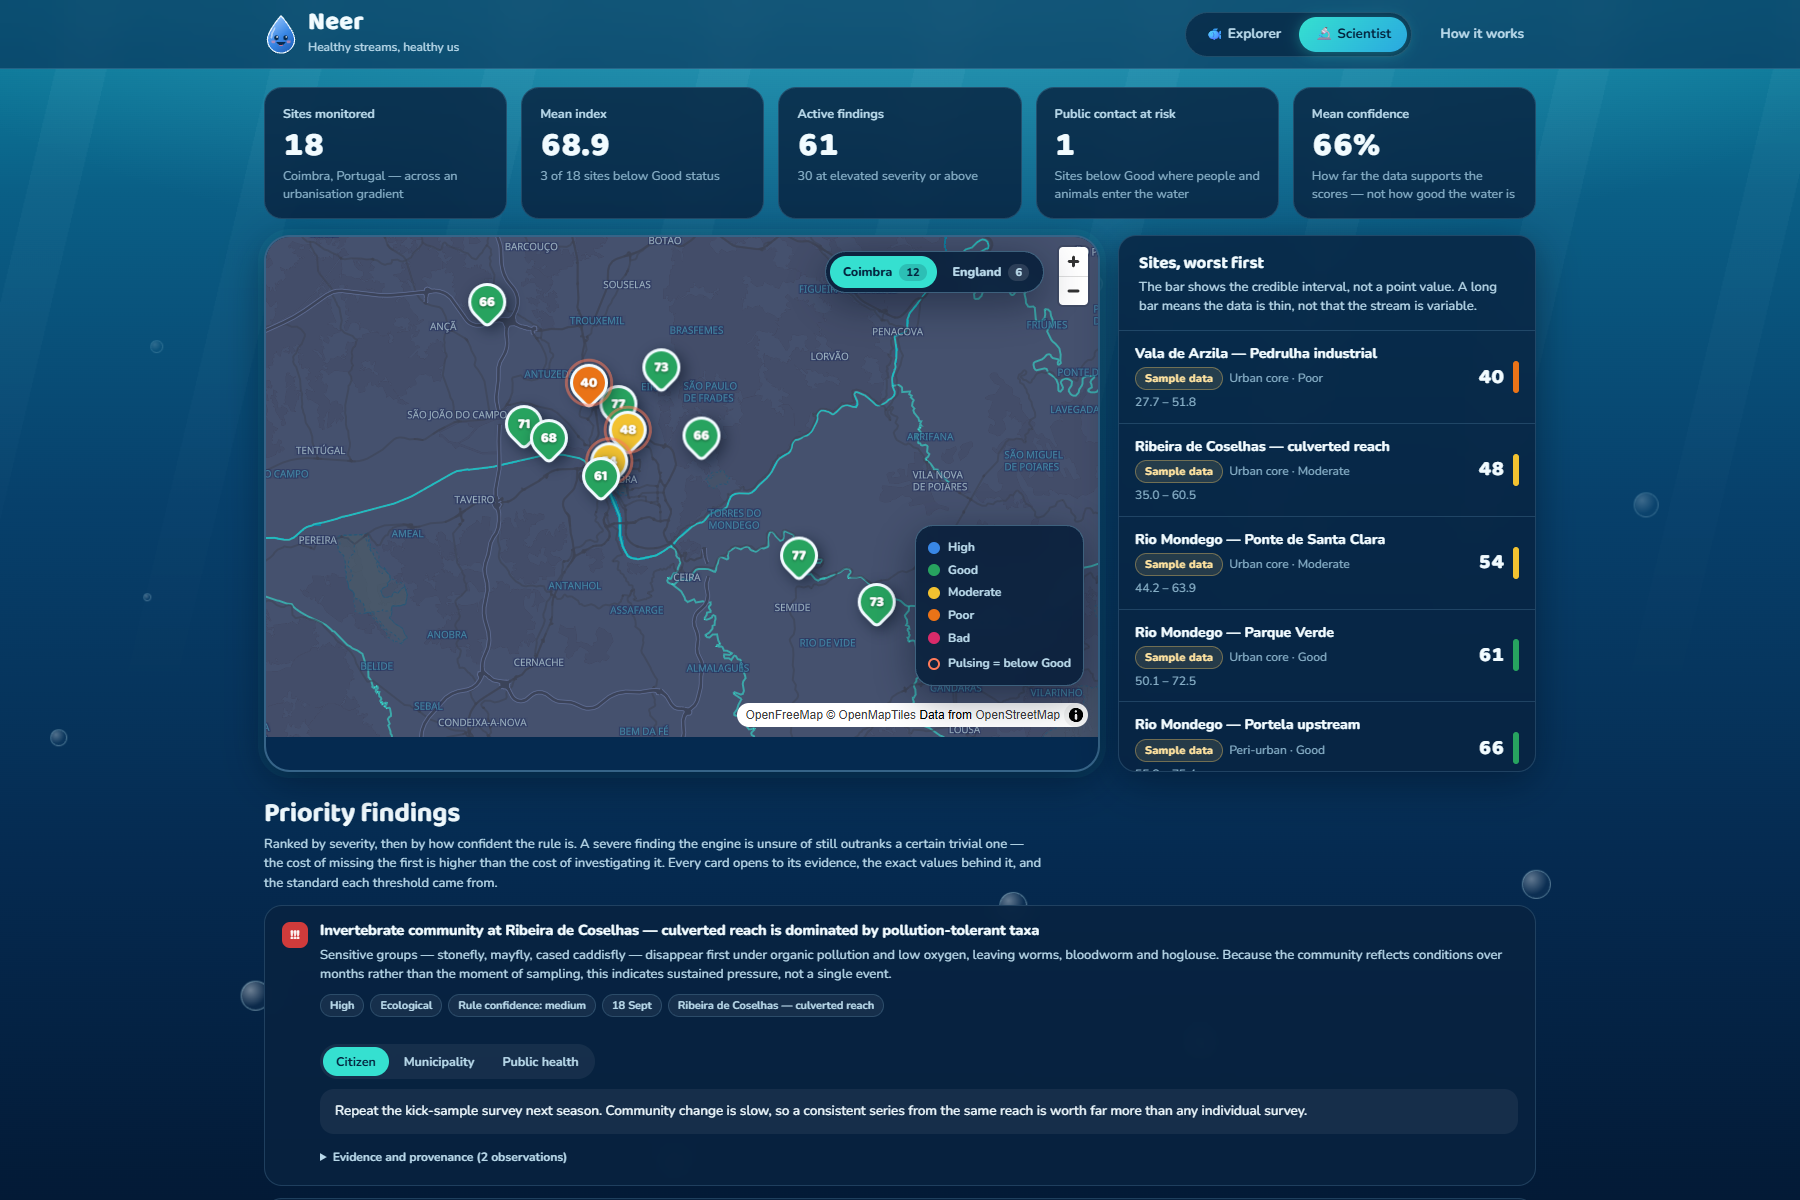
Neer computes a Stream One Health Index: a 0–100 composite built from three sub-indices.
- E — Ecological integrity (45%). CCME Water Quality Index 1.0 over the physico-chemical parameters, plus ASPT from citizen-identifiable invertebrate groups, expressed as an Ecological Quality Ratio against UKTAG WHPT class boundaries.
- H — Health exposure (30%). Field-observable proxies for faecal contamination, cyanobacterial blooms, mosquito vector habitat and antimicrobial resistance pressure, scaled by how much human and animal contact actually occurs at that reach.
- P — Anthropogenic pressure (25%). QBR riparian quality, litter, foam, surface films, visible discharges, catchment sealing and outfall count.
They aggregate as a weighted geometric mean, not an arithmetic one:
$$\mathrm{SOHI} = E^{0.45} \cdot H^{0.30} \cdot P^{0.25}$$
That choice is the whole argument. With an arithmetic mean, two healthy sub-indices mask one catastrophic one, which is the standard critique of additive environmental indices. Geometric aggregation makes a collapsed sub-index dominate the result, echoing the Water Framework Directive's "one out, all out" philosophy without being as brittle. A stream with lovely invertebrates and sewage in it is not a healthy stream, and the number has to say so.
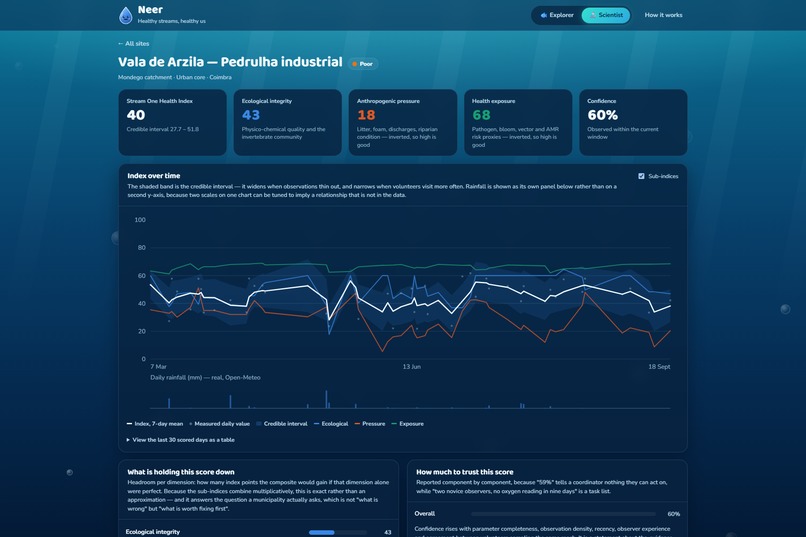
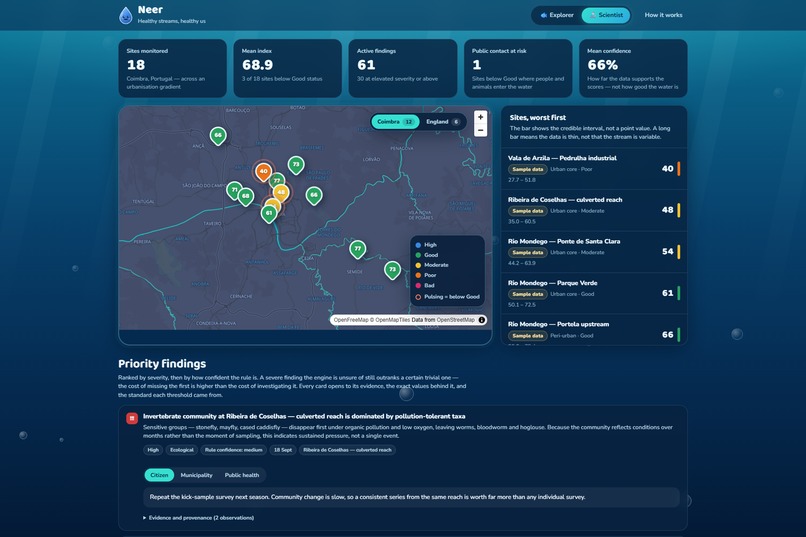
Every score carries a confidence band. Observation density, recency, parameter completeness and observer reliability drive a credible interval that widens when the data thins. We do not discard weak citizen data; we quantify how much to trust it and draw that on screen. Drop the sampling rate at one site and watch its band visibly widen — that is a live property, not decoration.
A deterministic rule engine turns scores into findings. Nine rules, each a pure function of its inputs, produce structured results like:
DO down 32% over 14 days · three consecutive days above 28 °C · 40 mm rain 48 h prior · combined-sewer catchment → elevated pathogen exposure risk, confidence medium, nearest recreational access 1.2 km downstream
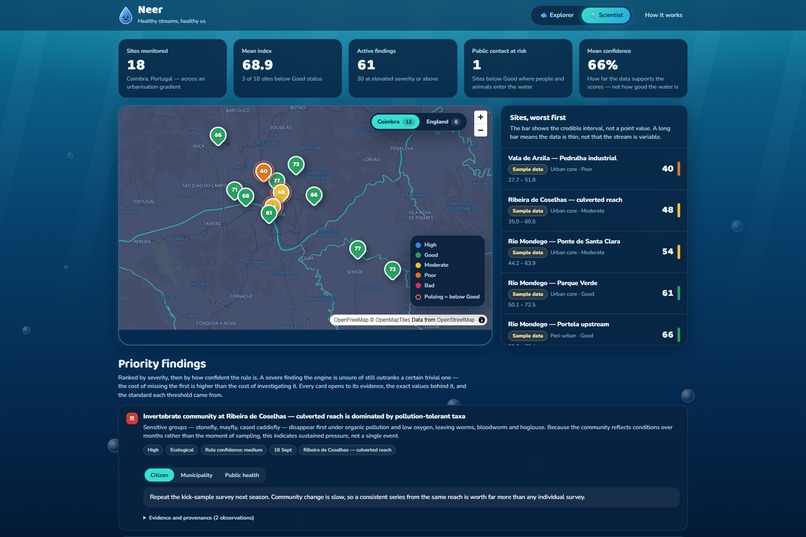
Each finding renders for three audiences. The citizen is told to keep children and dogs out of the water for 48 hours. The municipality is told to inspect sewer overflow structures within 48 hours. The public health officer is given the Bathing Water Directive limits and an explicit statement that Neer cannot measure them, so confirmatory sampling is required.
No language model decides what is true. Only the final phrasing is templated. The reasoning is never delegated, because a fabricated pathogen warning on a public waterway either triggers an unwarranted closure or manufactures false reassurance about a hazard nobody tested for. Neither is recoverable from a system whose reasoning cannot be audited.
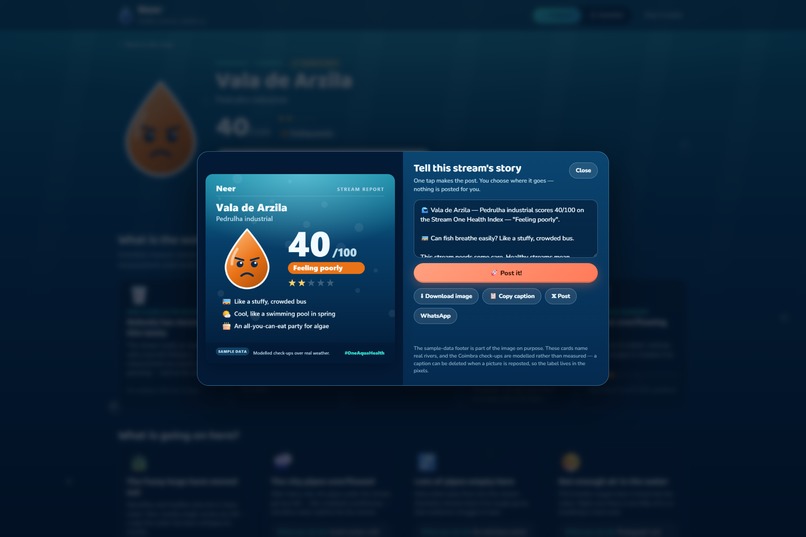
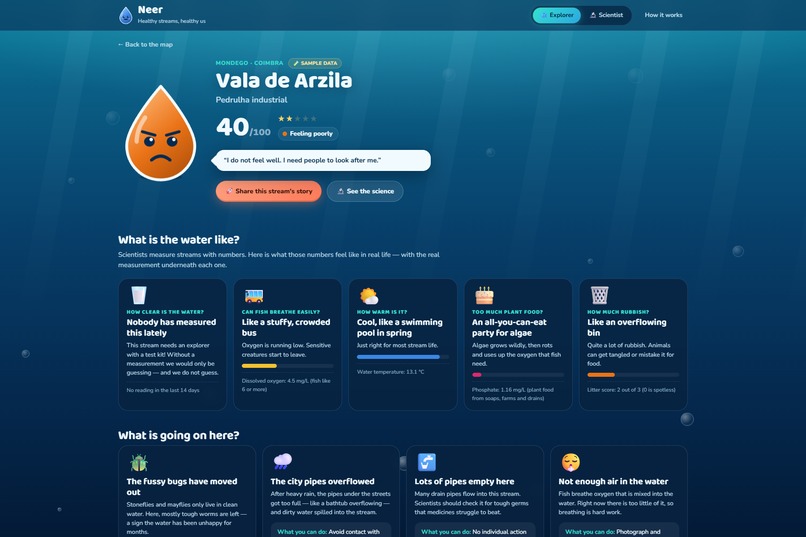
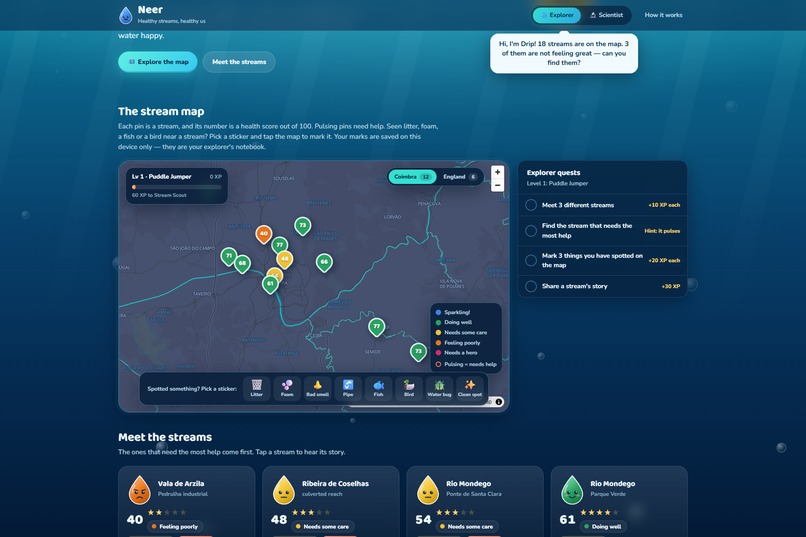
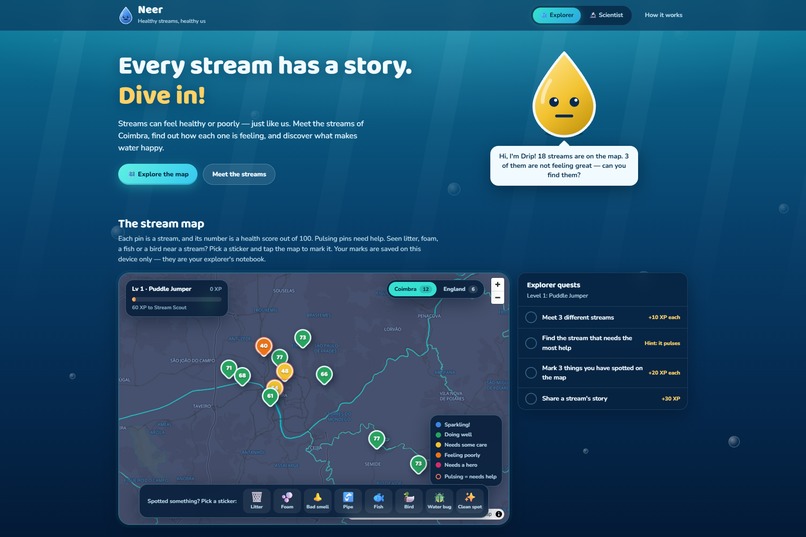
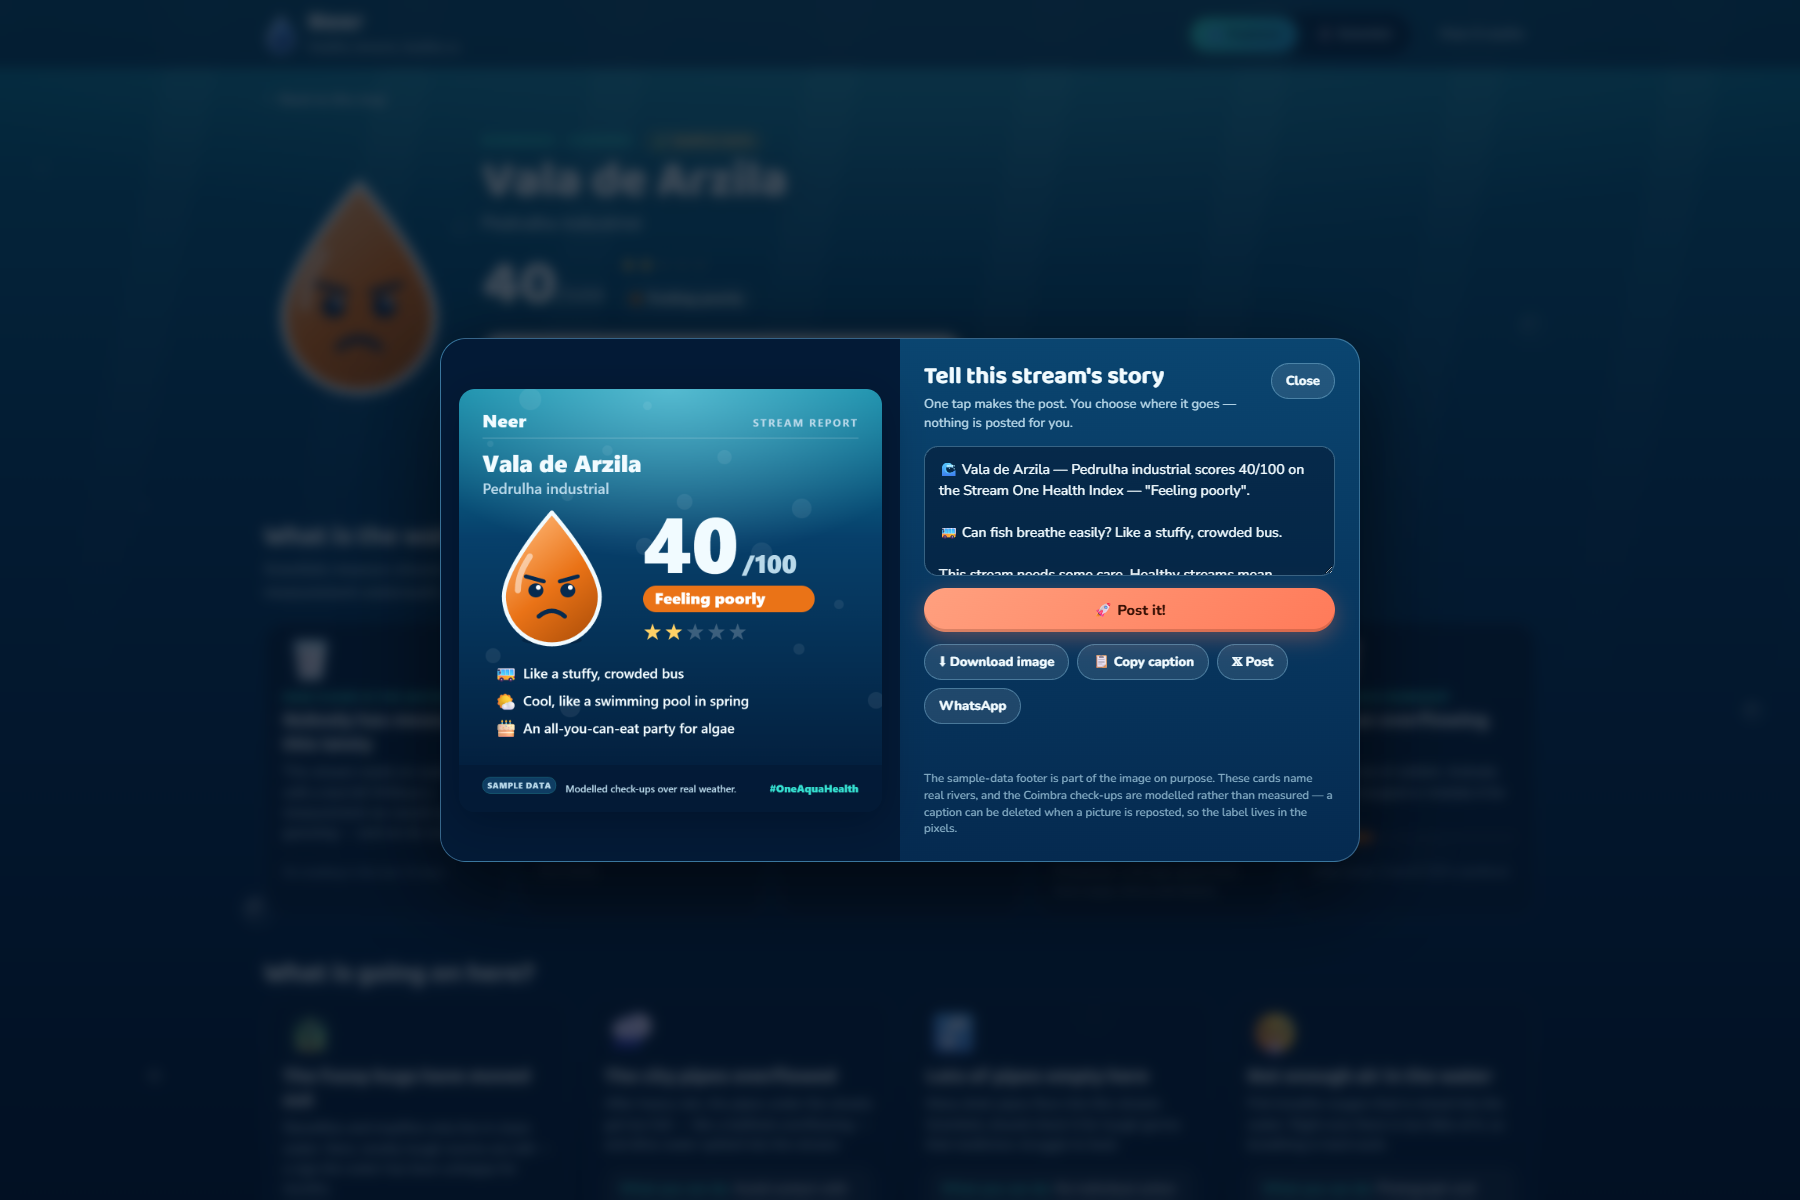
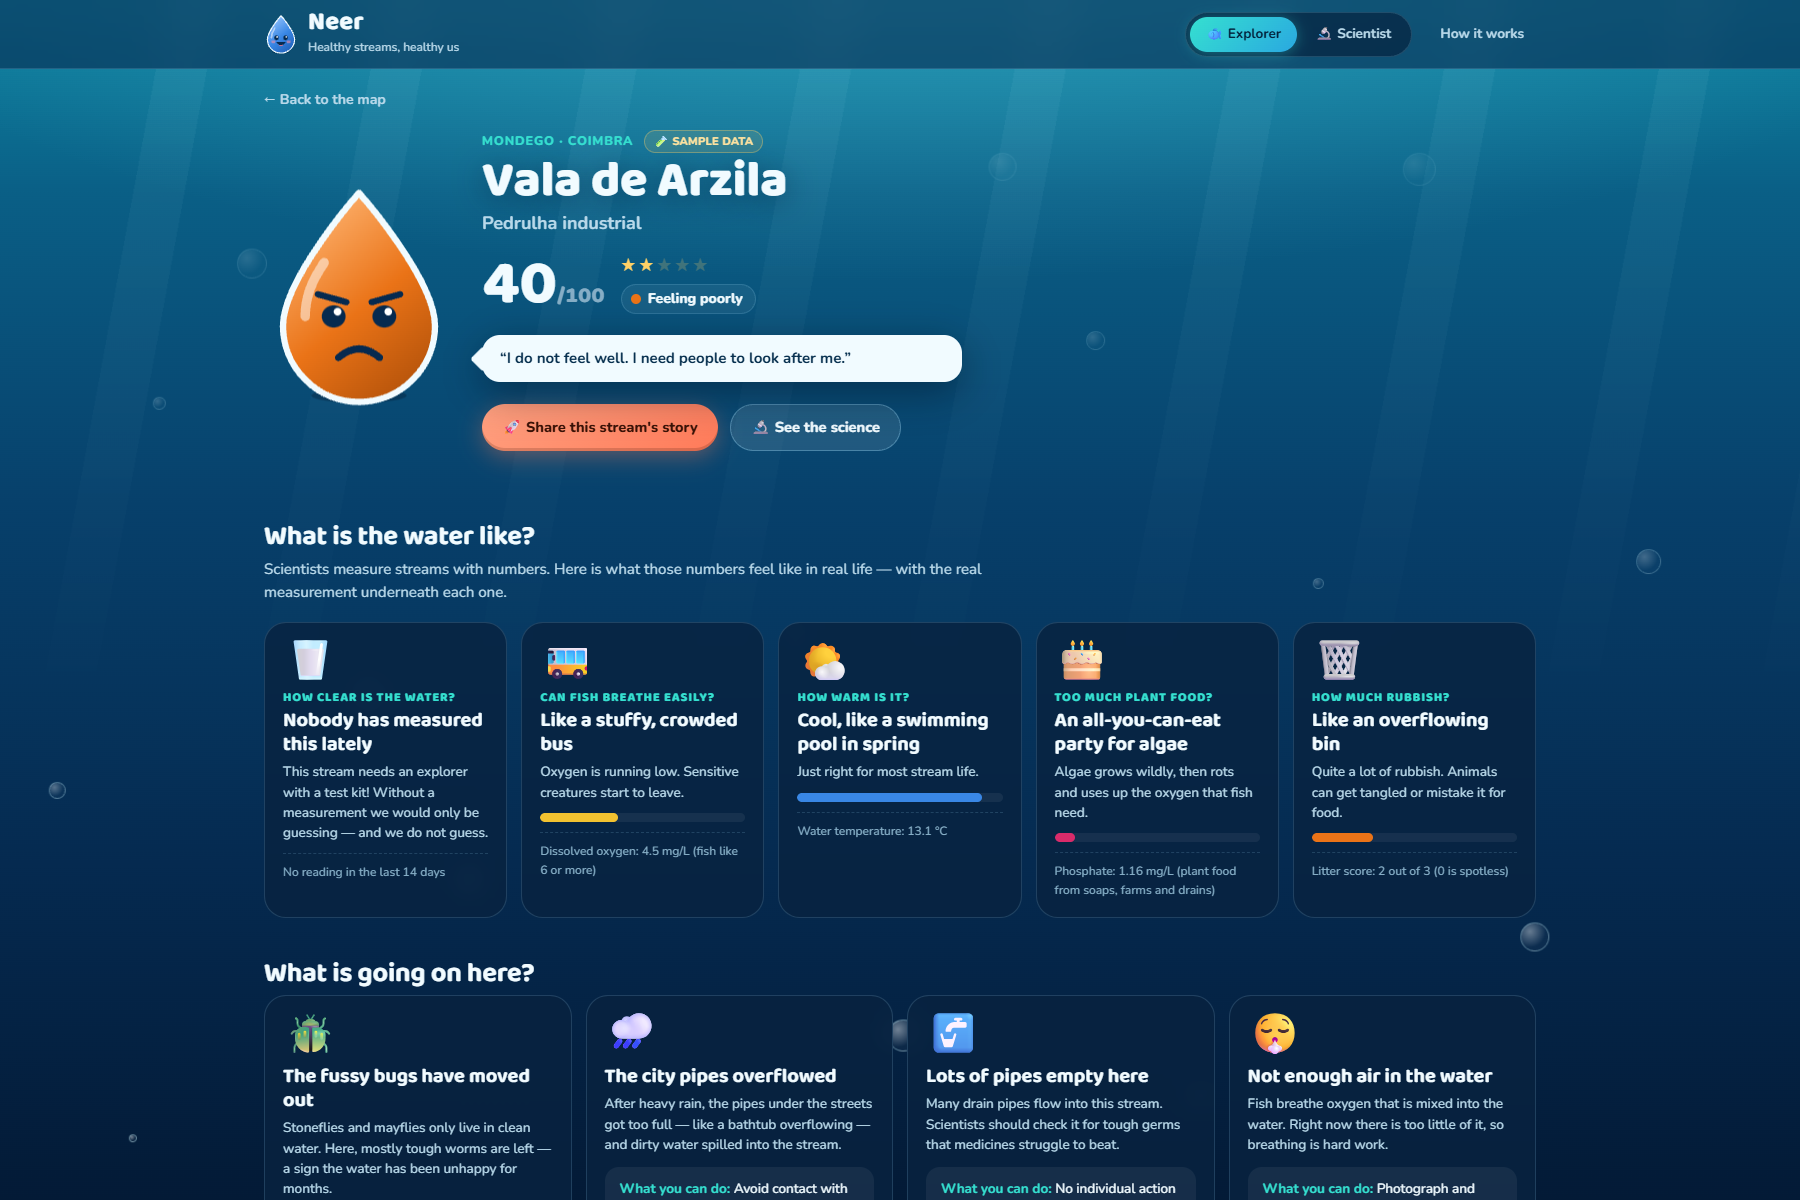
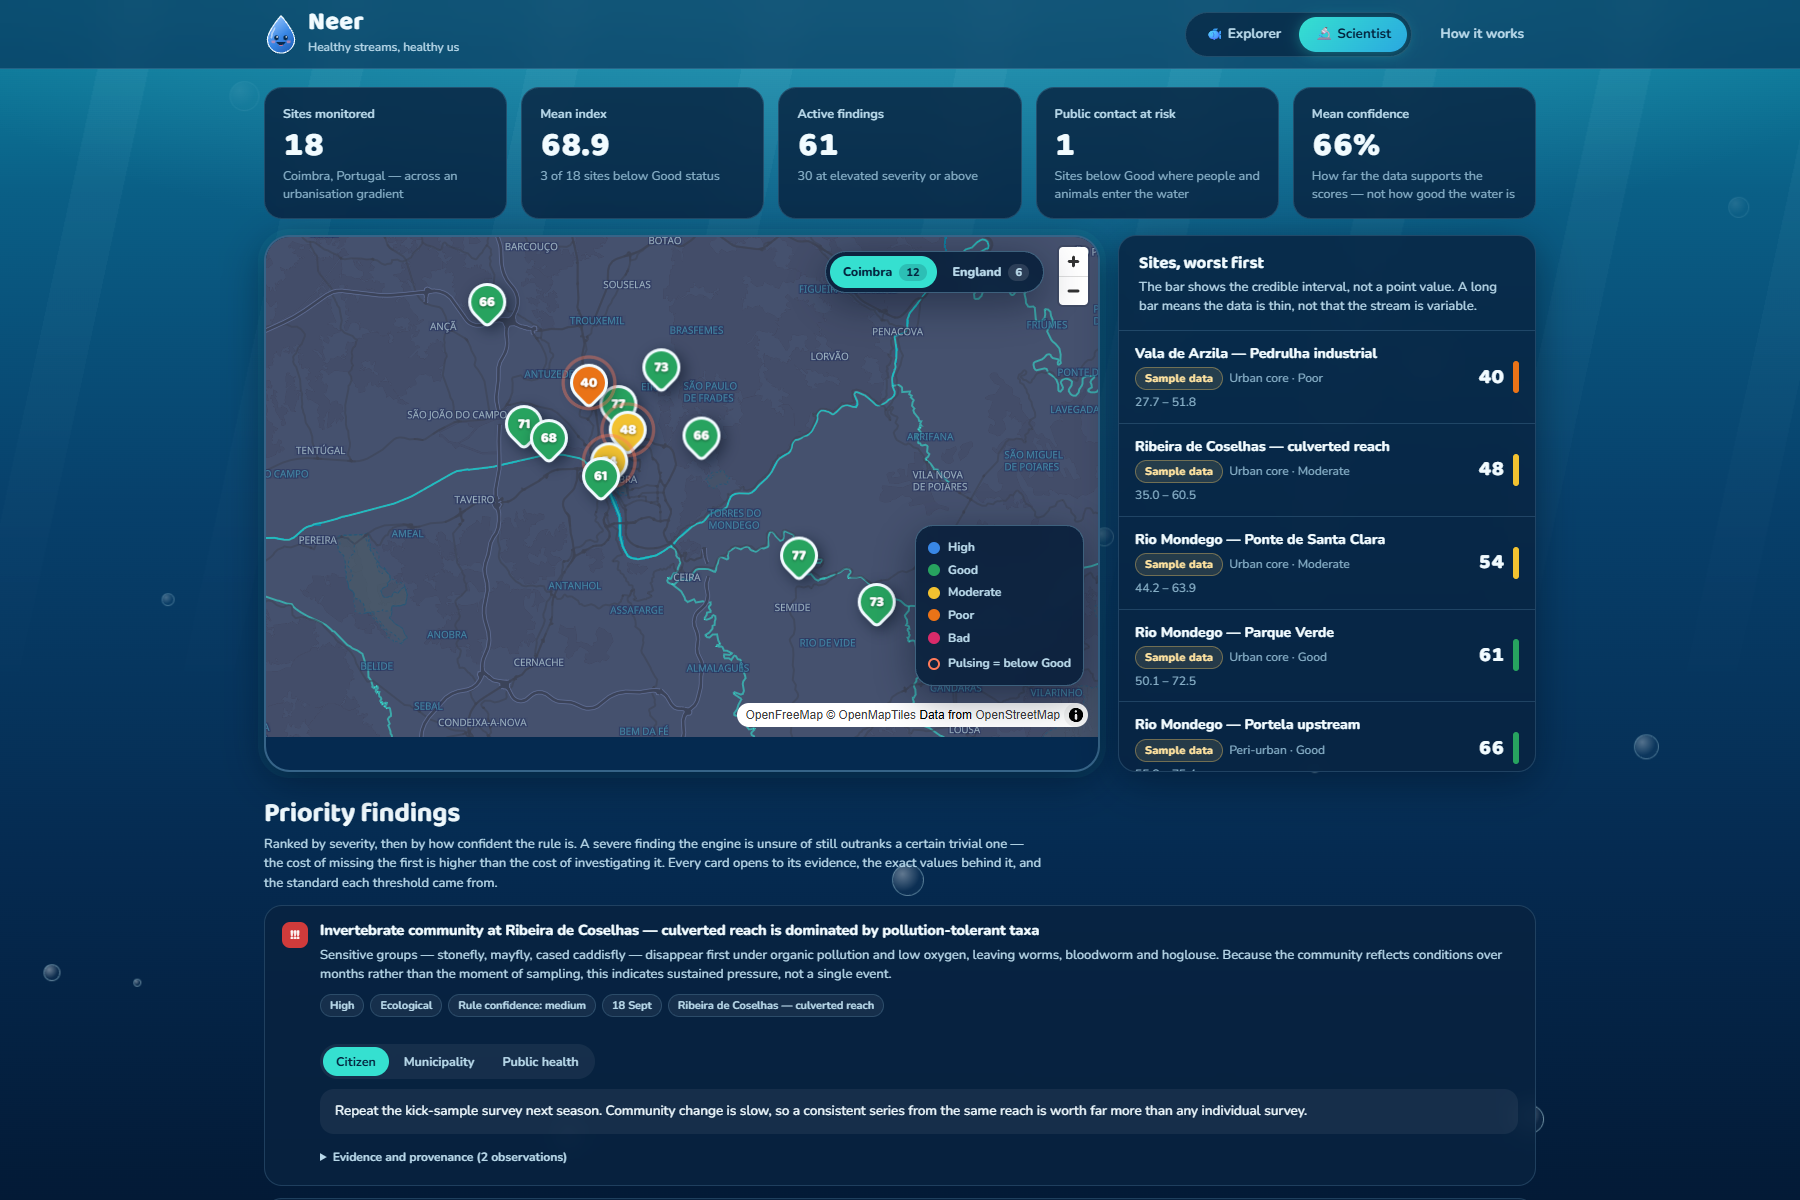
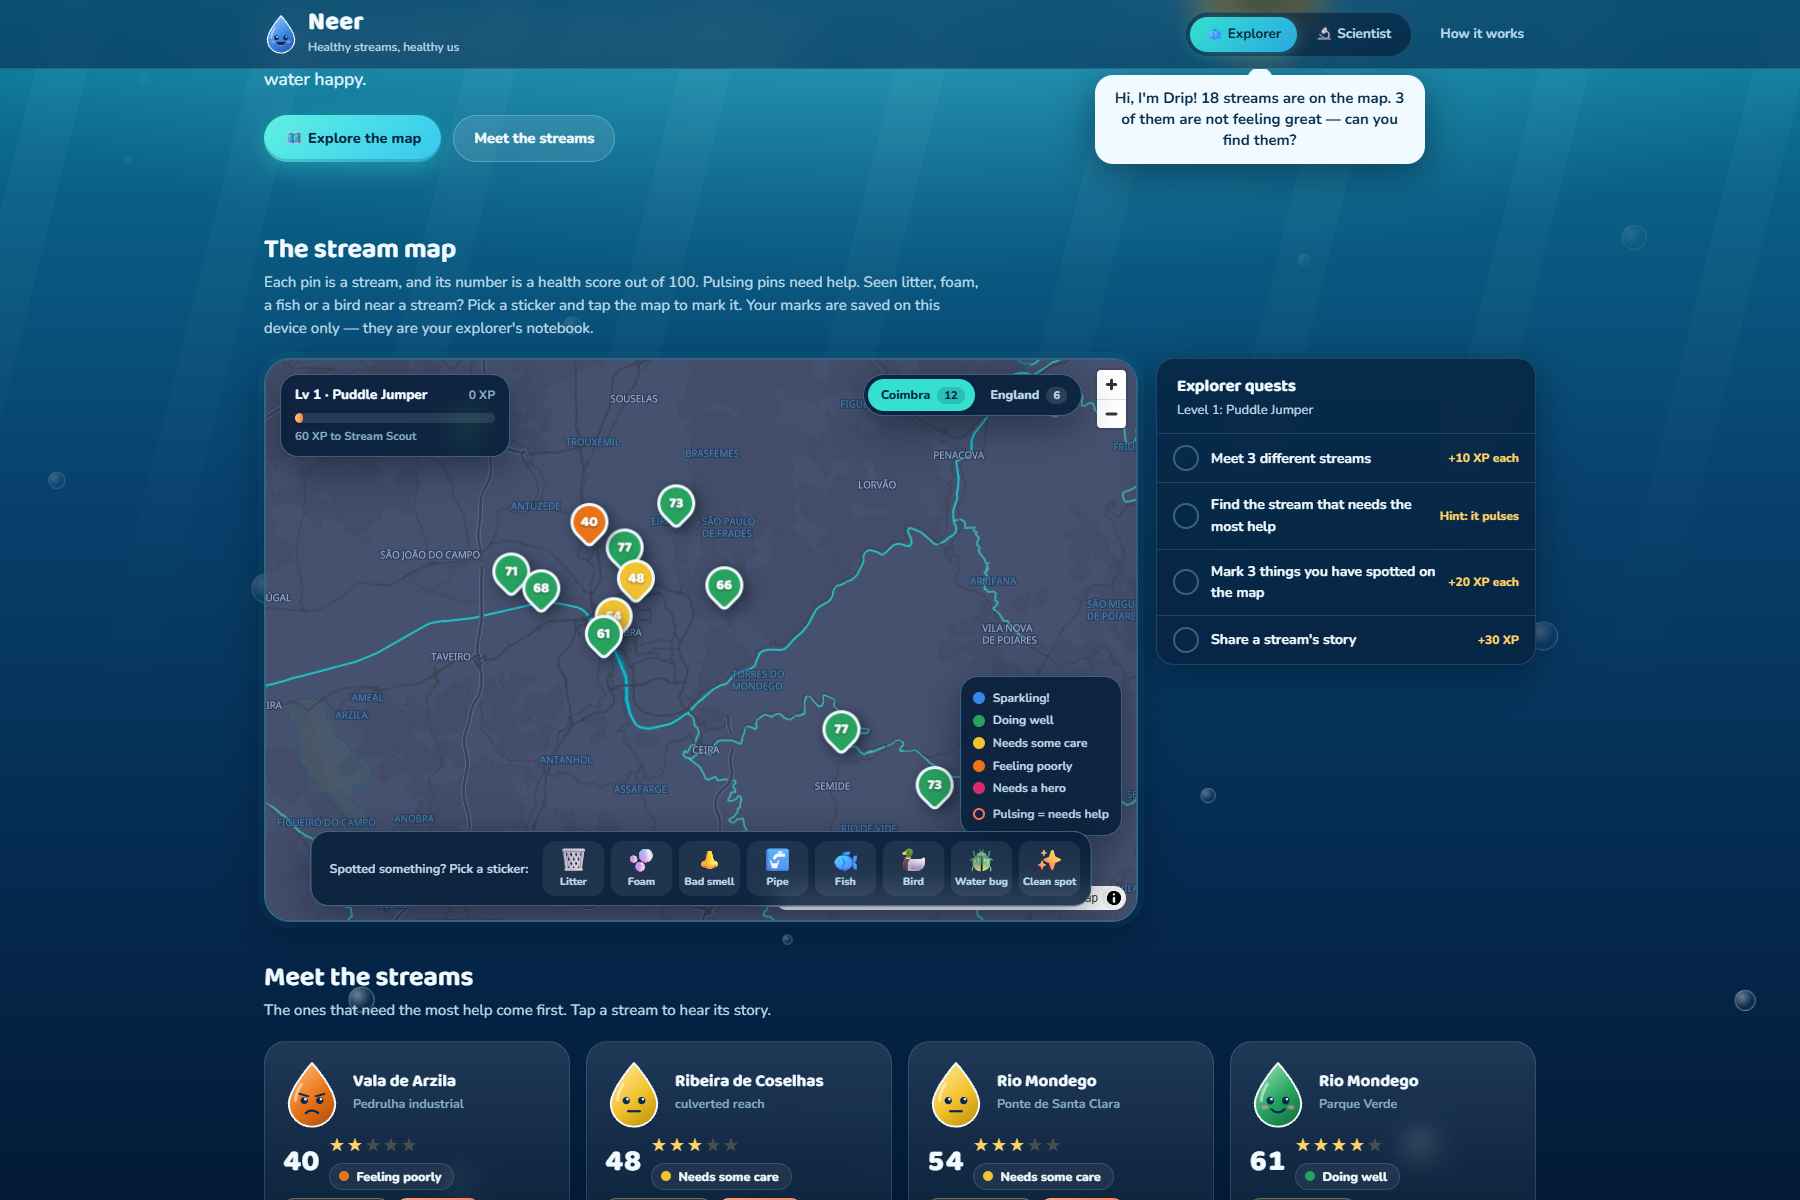
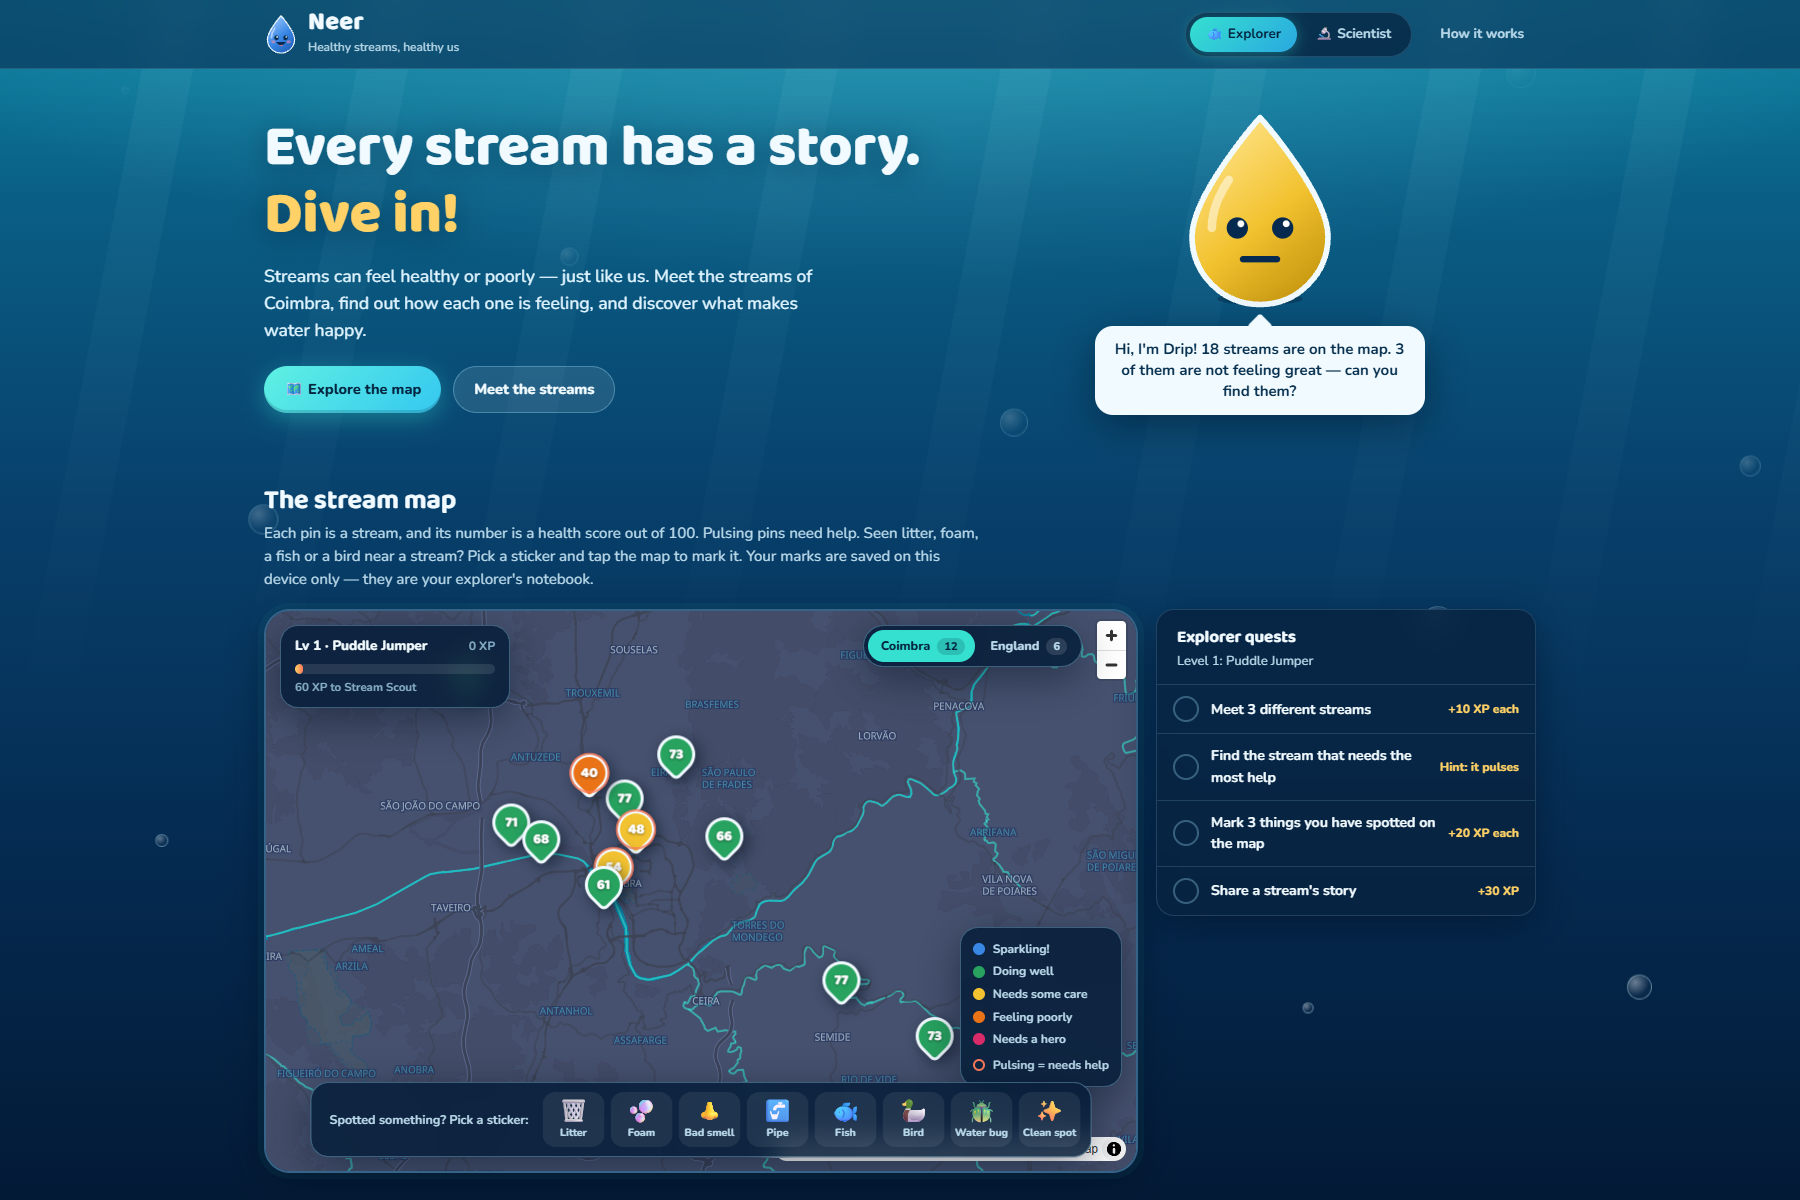
Two front doors onto the same data: an Explorer mode for children and classrooms, where measurements become real-life comparisons and a share card can be made in one tap, and a Scientist mode with the trend ribbons, sub-index decomposition and provenance chips. Same stream, same score, told differently. Never scored differently.
How we built it
A pnpm and Turborepo monorepo, deliberately layered so the science is separable from the infrastructure.
packages/scoring is pure. No database, no HTTP, no clock. Every index, boundary and confidence calculation is a pure function, which is what makes it unit-testable at its edges and independently reviewable. 98 tests cover the whole engine, including boundary behaviour, missing-data paths and confidence degradation.
ClickHouse is used as ClickHouse, not as Postgres with a different name. AggregatingMergeTree materialised views with -State and -Merge combinators for daily rollups. An ASOF JOIN to attach every observation to its nearest-in-time weather reading, which is the single most apt feature for this domain. Window functions for rolling trends, argMax for latest-per-site, LowCardinality enums, PARTITION BY toYYYYMM. Ten migrations, every statement idempotent.
NestJS serves it with a read-only ClickHouse client, Zod validation and a Server-Sent Events channel. React 19 + Vite on the front, with MapLibre on a keyless OpenFreeMap basemap and hand-rolled SVG charts so the visual system stays consistent.
Real data wherever it exists, labelled wherever it does not. Weather and hydrology come from Open-Meteo. Six Environment Agency water-quality sondes on English rivers are discovered at runtime, not hard-coded, because sondes get deployed for a campaign and then moved — asking which measures have reported in the last 36 hours finds the ones actually reporting now. Their readings are real, official and stored unchecked exactly as the EA flags them. The Coimbra observations are a documented physical model over real weather, and every one of those sites says so on its pin, its card and its share image.
It is genuinely live. An observation posted to the API is validated, stored, re-scored and on every open dashboard in 3.2 seconds, measured. Batch and incremental scoring are the same function, so a live number can never disagree with a batch one. A CSV importer reads the OneAquaHealth field vocabulary — WTC, WDO_MG, WPH, WCON_US and the rest — with a dry run that reports every column it did and did not understand before writing anything.
A BigQuery and BQML tier ships as real, reviewable code behind a provider interface, with a local TypeScript forecaster as the default so the repo runs for anyone with zero credentials. One environment variable flips it.
Challenges we ran into
There is no public real-time feed for the streams we chose. The OneAquaHealth app data is not public and Portugal's SNIRH has no API. We could have faked it. Instead we built the live path for real and pointed it at data that genuinely is: real Environment Agency sensors, real weather every 15 minutes, and a simulated field crew posting through the identical endpoint a phone app would use. The pipeline is real even where one layer's observations are modelled, and the UI never lets you forget which is which.
ClickHouse punishes assumptions. FROM sites FINAL AS s is a syntax error; the alias must precede FINAL. A view cannot reference a column a later migration adds. An arrayJoin inside a materialised view silently inflated our rollups. Each of those cost real time and each is now guarded by a CI assertion, because every one of them had been wrong in this repository's history.
Making the map survive being alive. The map was created with the sites array as an effect dependency, and the live feed replaces that array on every re-score. Every 25 seconds the entire MapLibre instance was torn down and rebuilt: tiles reloaded, the reader's zoom lost, a switched region snapped back to the pilot city. Fixing it meant creating the map once and repainting pins in place, so the viewport only moves when a human asks it to.
Defensibility over invention. Every threshold is tagged in the source with where it came from — a published standard, a value derived from one, or our own modelled construct — and that tag is enforced by the type system rather than left to documentation discipline. The sub-index weights are explicitly labelled a judgement, not a standard, and are exposed as constants precisely so they can be argued with. No composite environmental index has objectively correct weights, and pretending otherwise would have been the easiest thing in the project to fake.
Accomplishments we're proud of
The uncertainty model is live, not cosmetic. The rule engine is auditable end to end: every statement traces back to a number and a citation. The whole system starts from a clean clone with docker compose up and no credentials at all, and CI proves it on every push by seeding from the real Open-Meteo API, running all ten migrations, scoring every site and asserting the pipeline invariants.
And the honesty scales down as well as up. A ten-year-old gets "as cloudy as tea with milk" — but that comparison always comes from a measured value, the real number is printed underneath, and if nobody measured it the card says so instead of guessing.
What we learned
More about water than we expected: CCME WQI aggregation, ASPT and the WHPT boundaries, QBR riparian scoring, and why the Water Framework Directive lets biology lead while chemistry only caps. Also that the hard part of an environmental index is not the arithmetic. It is deciding what you are allowed to claim, and then building the machinery that stops you claiming more than that.
What's next
Validating the index against paired citizen and professional sampling across a season, which is the one thing that moves it from internally consistent to externally correct. Anomaly detection, whose schema is in place. Site-specific reference conditions from RIVPACS/RICT rather than one constant. And ingesting real OneAquaHealth submissions, which the CSV importer is already built to read.
Built With
- bigquery
- bigquery-ml
- clickhouse
- css
- docker
- docker-compose
- github-actions
- google-cloud
- maplibre
- nestjs
- nginx
- node.js
- open-meteo
- pnpm
- react
- rest-api
- server-sent-events
- sql
- svg
- turborepo
- typescript
- vercel
- vite
- vitest
- zod

Log in or sign up for Devpost to join the conversation.