-
-

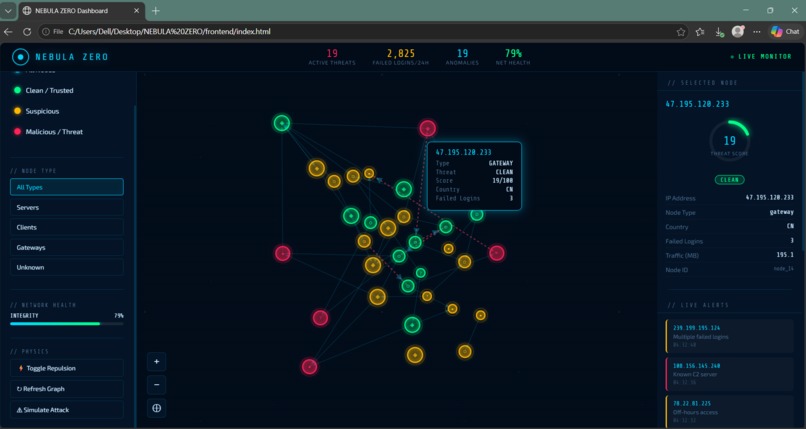
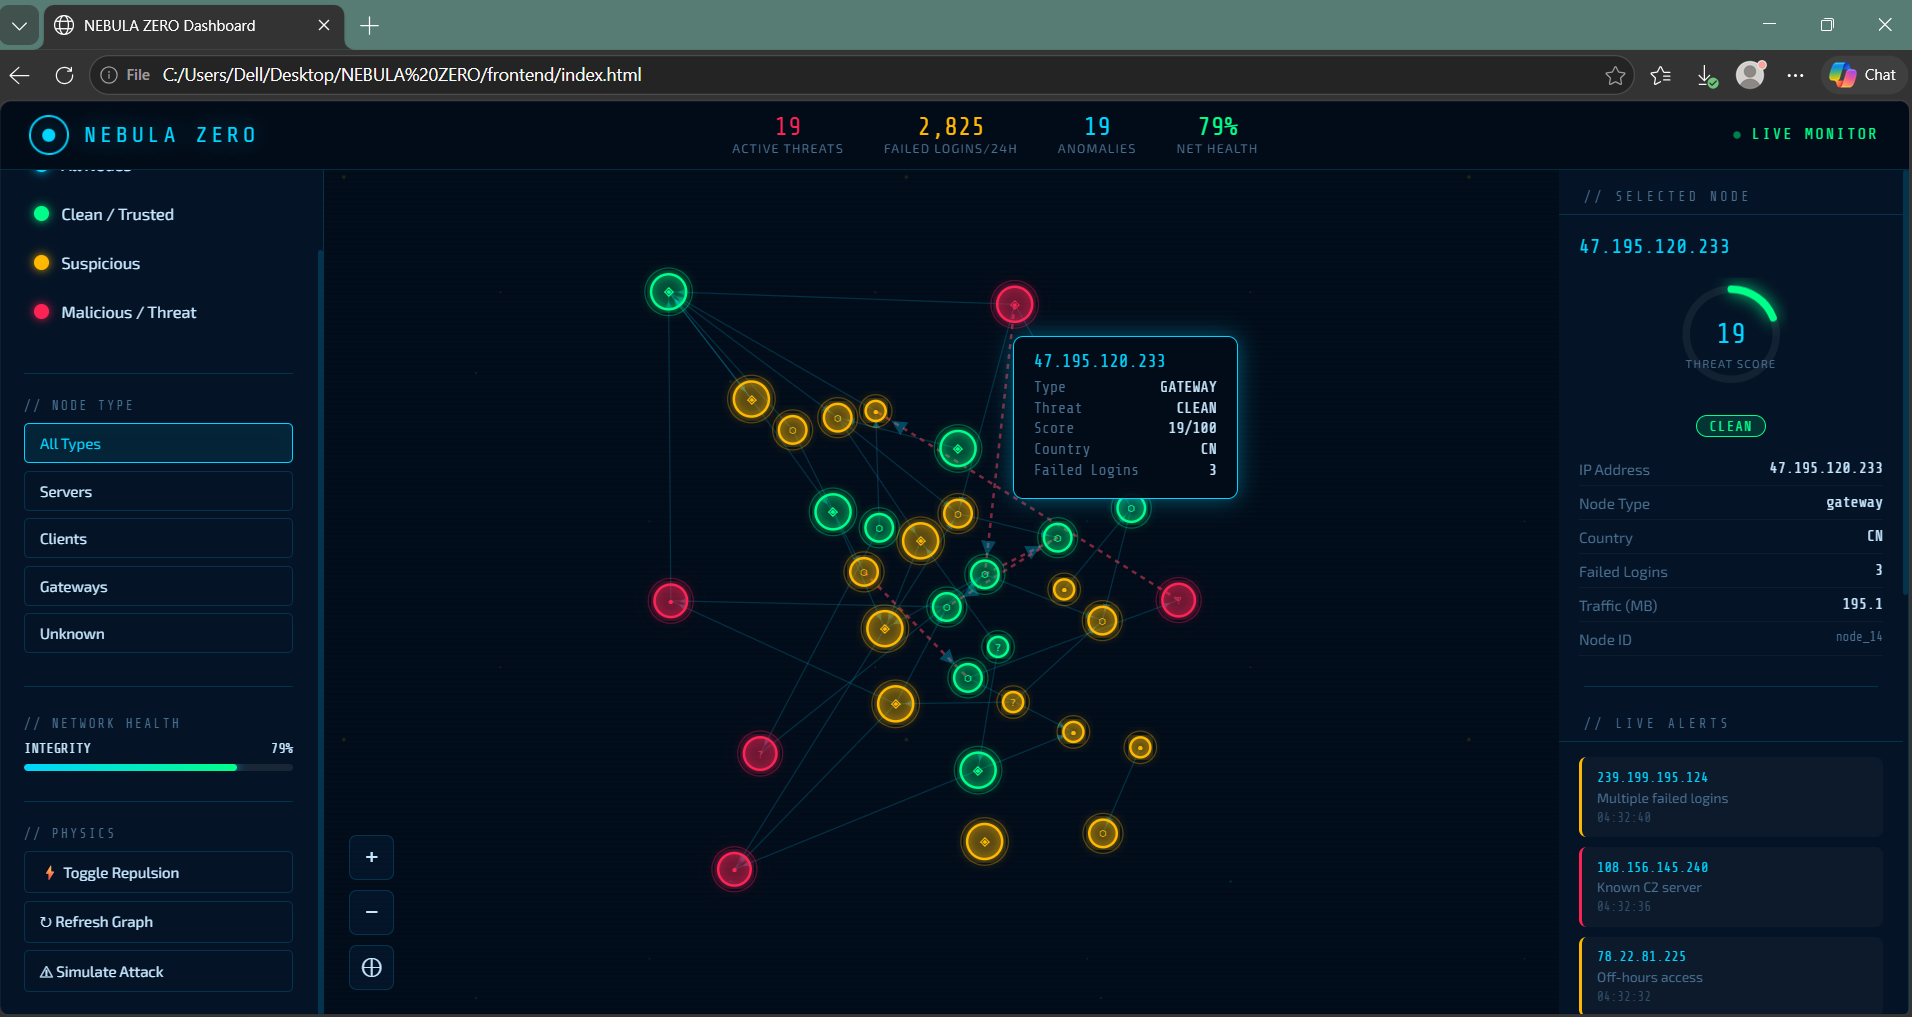
Main dashboard
-
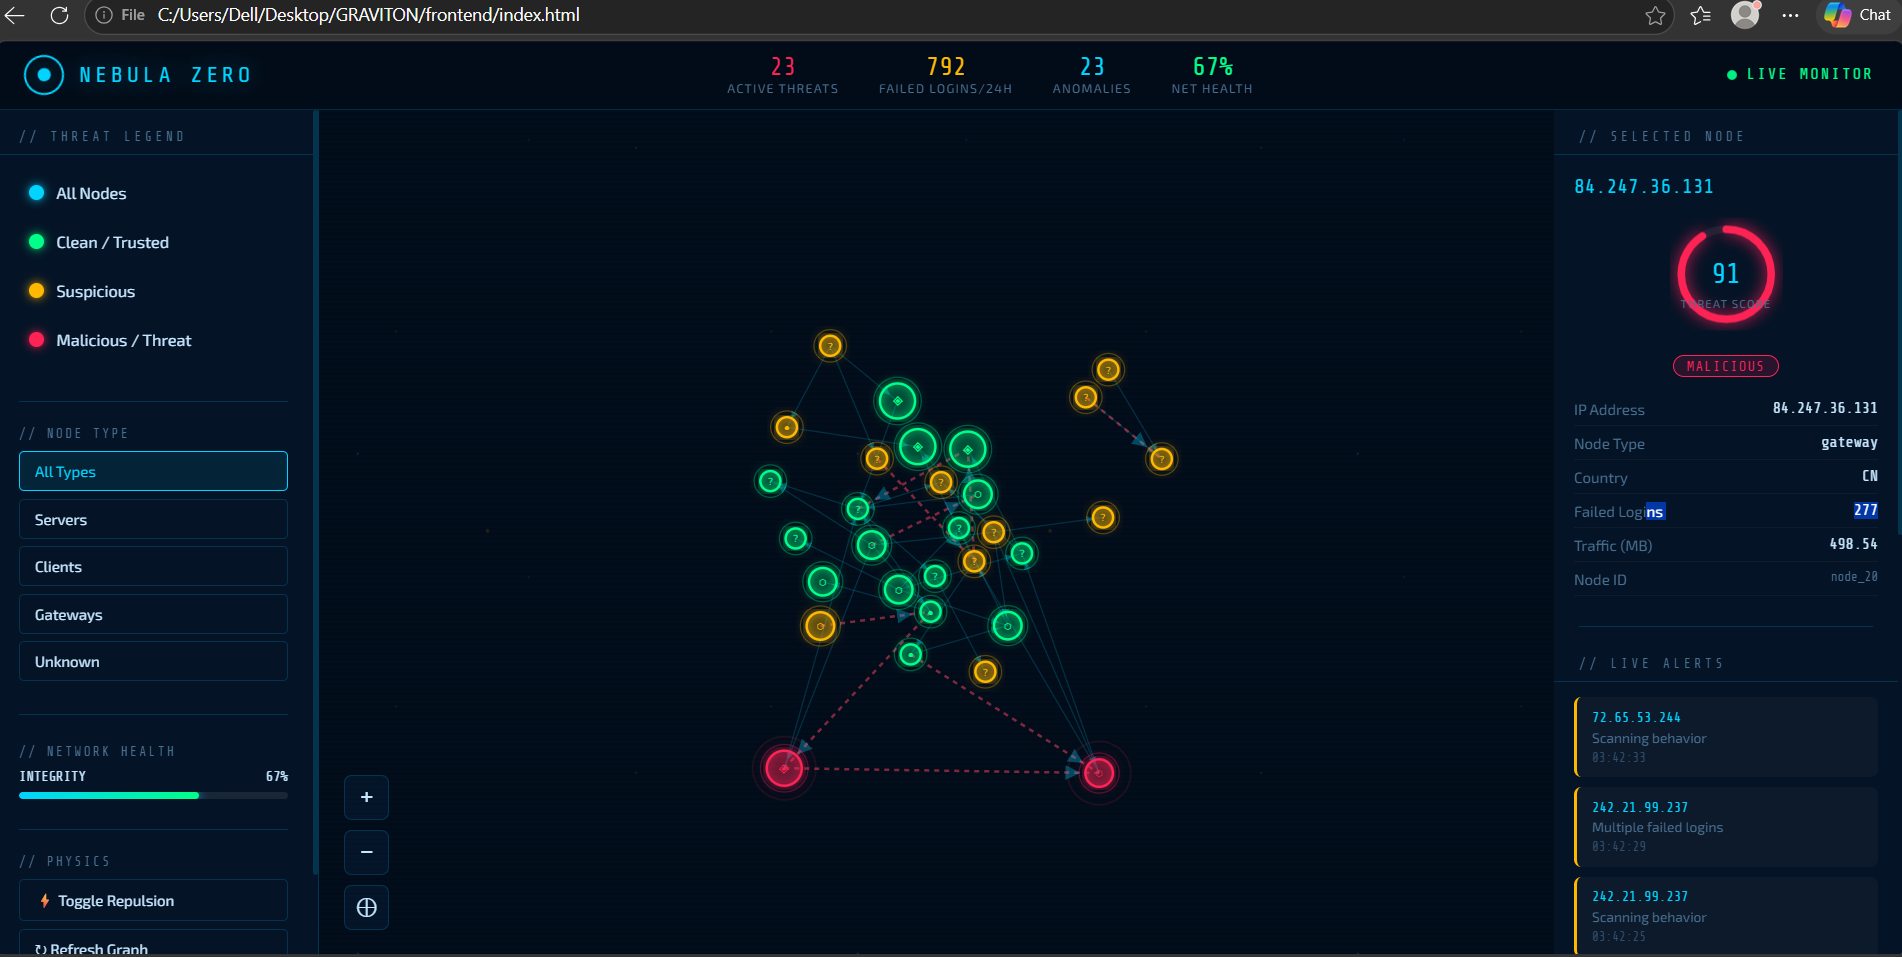
Malicious
-
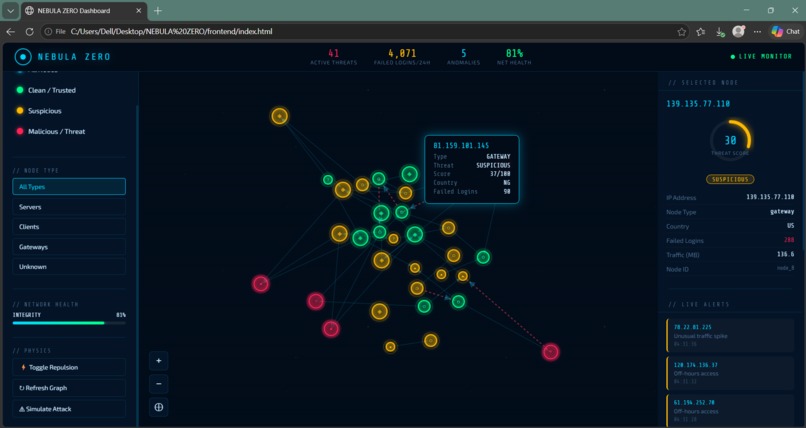
Suspicious

Inspiration
As an 18-year-old diving into cybersecurity, I always found traditional security dashboards boring — endless tables of numbers and log files that nobody actually wants to read. I kept asking myself: what if threats could be visualized like a universe? What if malicious nodes actually floated away from trusted zones like particles in zero gravity? That question became NEBULA ZERO. I was inspired by the idea that in a zero-trust security model, nothing should be trusted by default — and I wanted to make that concept visible, physical, and beautiful.
What it does
NEBULA ZERO is a threat intelligence dashboard where security data floats in a physics-based force-directed graph instead of static tables. Every device on a network is represented as a glowing node floating in space. Clean and trusted nodes cluster together at the center while suspicious and malicious nodes are physically repelled to the edges of the trust space. Malicious nodes pulse with red rings to grab attention instantly. Users can hover any node to see its IP address, threat score, country, and failed login count. There is a live alert feed showing real-time threat events, a simulate attack button that injects live threats into the graph, and filters to isolate specific node types. It connects to real threat intelligence APIs — AbuseIPDB and VirusTotal — to enrich IP data with actual security scores.
How we built it
NEBULA ZERO is built in three layers. The frontend is a pure HTML, CSS, and JavaScript dashboard powered by D3.js force simulation. Every node floats using real physics — charge, collision, gravity, and positional forces are all tuned so that a node's position in space tells you something meaningful about its threat level. Malicious nodes are pushed to the edges with glowing red pulse animations while clean nodes stay safely clustered at the center. The backend is a Python Flask API that serves network graph data, threat scores, and live statistics. It integrates with AbuseIPDB and VirusTotal APIs for real threat intelligence and falls back to rich mock data when keys are not available. The frontend is deployed on Netlify and the backend on Render so the dashboard is always live without running anything locally.
Challenges we ran into
The biggest challenge was making the physics feel meaningful — not just random bouncing nodes but a simulation where the position of a node actually communicates its threat level. Tuning the D3 force parameters so malicious nodes naturally drift to the edges while clean nodes cluster at the center took a lot of trial and error. Another challenge was connecting the Netlify frontend to the Render backend in production — figuring out CORS, environment variables, and dynamic port configuration was confusing at first. As an 18-year-old building this solo, learning Git, GitHub, and cloud deployment all inside one hackathon was also a steep but rewarding curve.
Accomplishments that we're proud of
I am proud that the physics simulation actually works as a security metaphor — when you look at the graph, you instantly understand which nodes are dangerous without reading a single number. I am proud that the entire frontend runs with zero frameworks, just raw D3.js and CSS. I am proud of deploying a full stack application with a live backend API for the first time ever. And I am proud that as an 18-year-old first-time hackathon participant, I built, deployed, and submitted a complete working product that looks and feels production-ready.
What we learned
Building NEBULA ZERO taught me more in one hackathon than many of tutorials. I learned how D3.js force simulations work and how to use physics to represent real security concepts. I learned how to build a REST API with Flask and connect it to a live frontend. I learned about real threat intelligence APIs and how security teams actually use them in production. I learned how to deploy a full stack app using Netlify and Render. Most importantly I learned that cybersecurity does not have to be intimidating — the right visualization can make complex data instantly understandable to anyone.
What's next for NEBULA ZERO
Real-time WebSocket streaming for live network traffic data Three.js 3D mode where the z-axis represents time and attack history Machine learning anomaly detection to automatically flag unusual behavior Geolocation map overlay showing attack origins across the world Attack path tracing with animated edge traversal to show how threats spread User authentication so security teams can save and share threat snapshots
Built With
- abuseipdb
- css3
- d3.js
- flask
- html
- javascript
- netlify
- python
- render
- virustotal


Log in or sign up for Devpost to join the conversation.