-

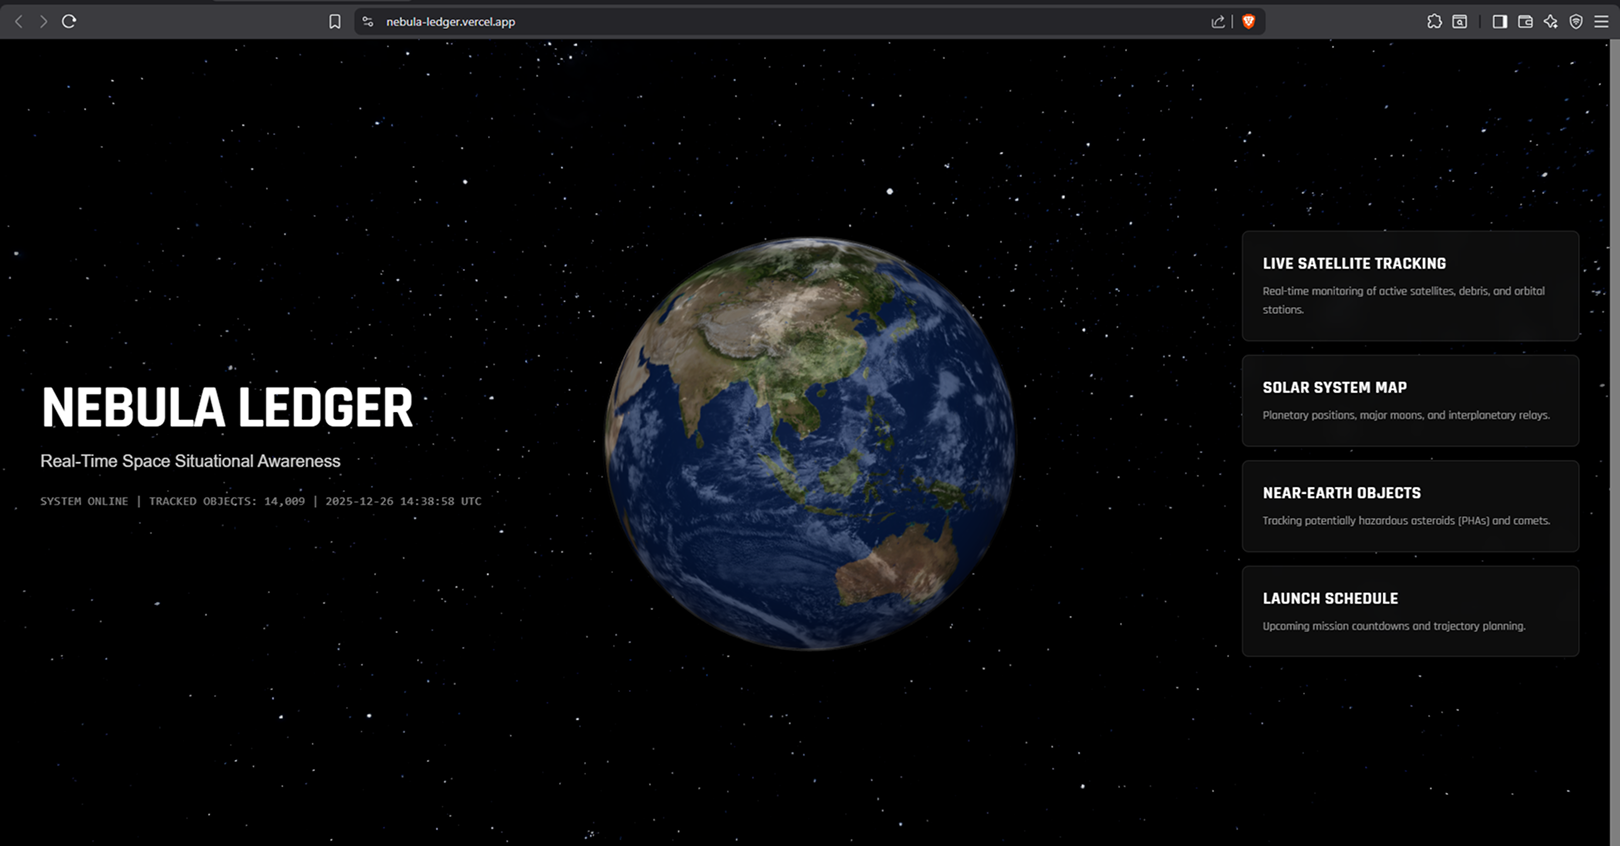
Landing Page
-

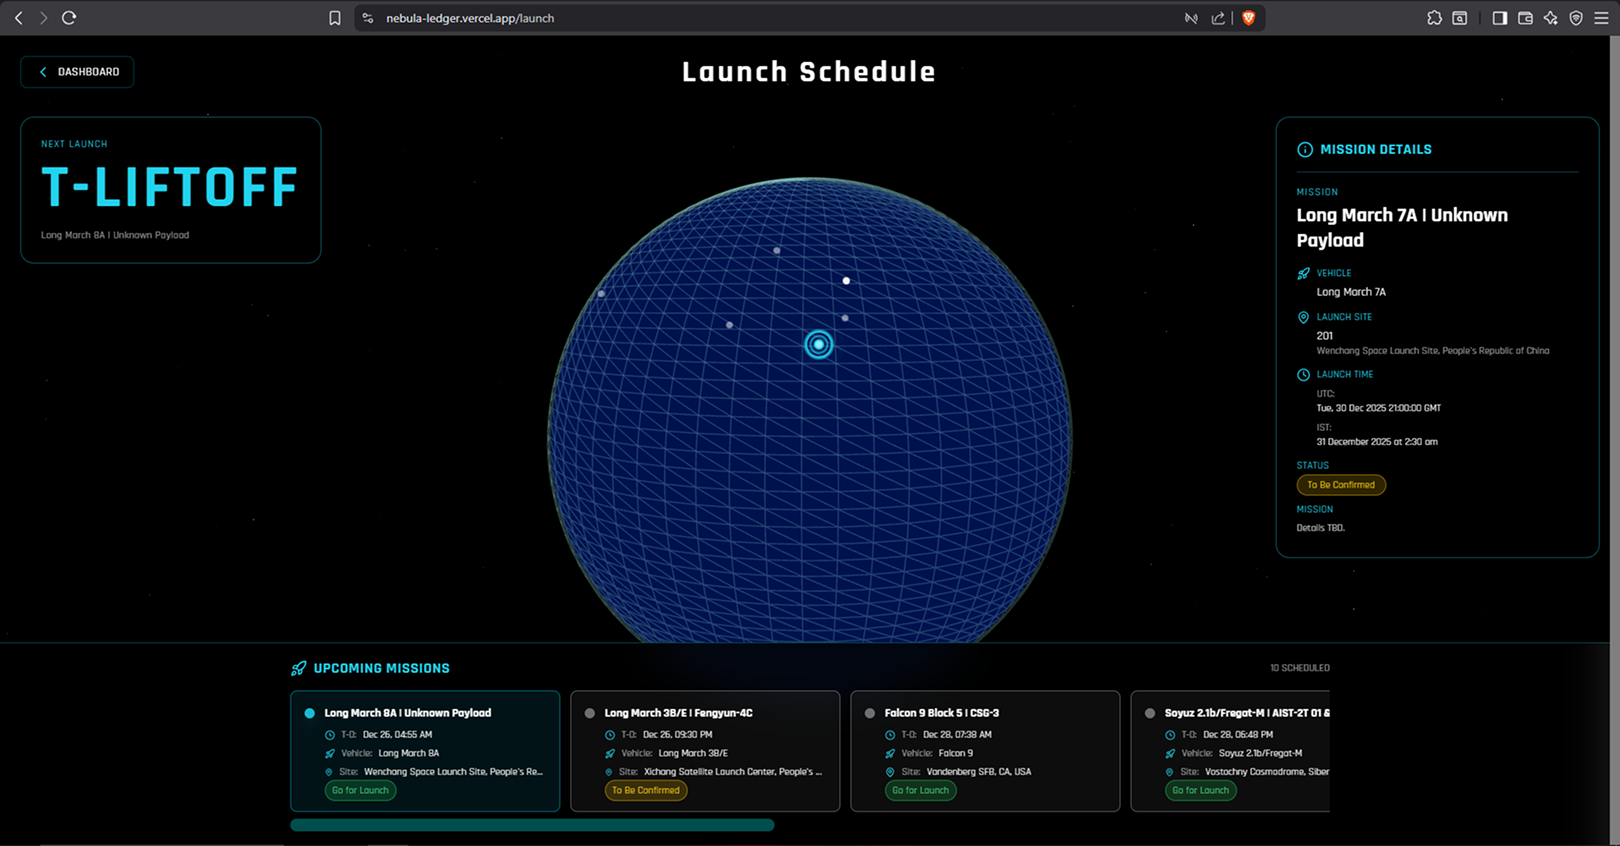
Launch Schedule
-
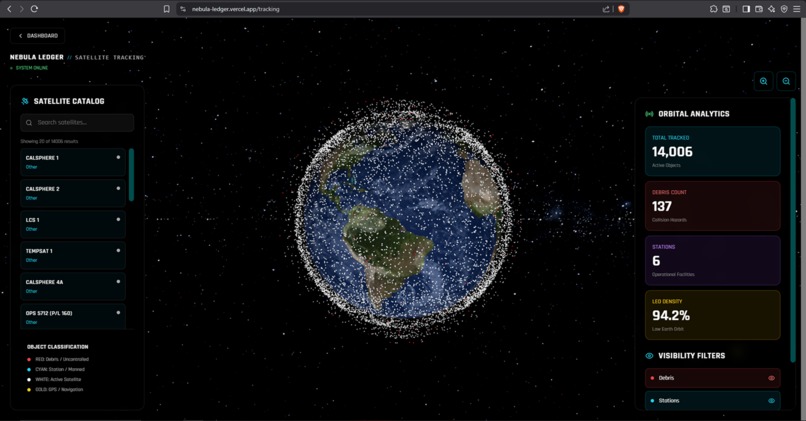
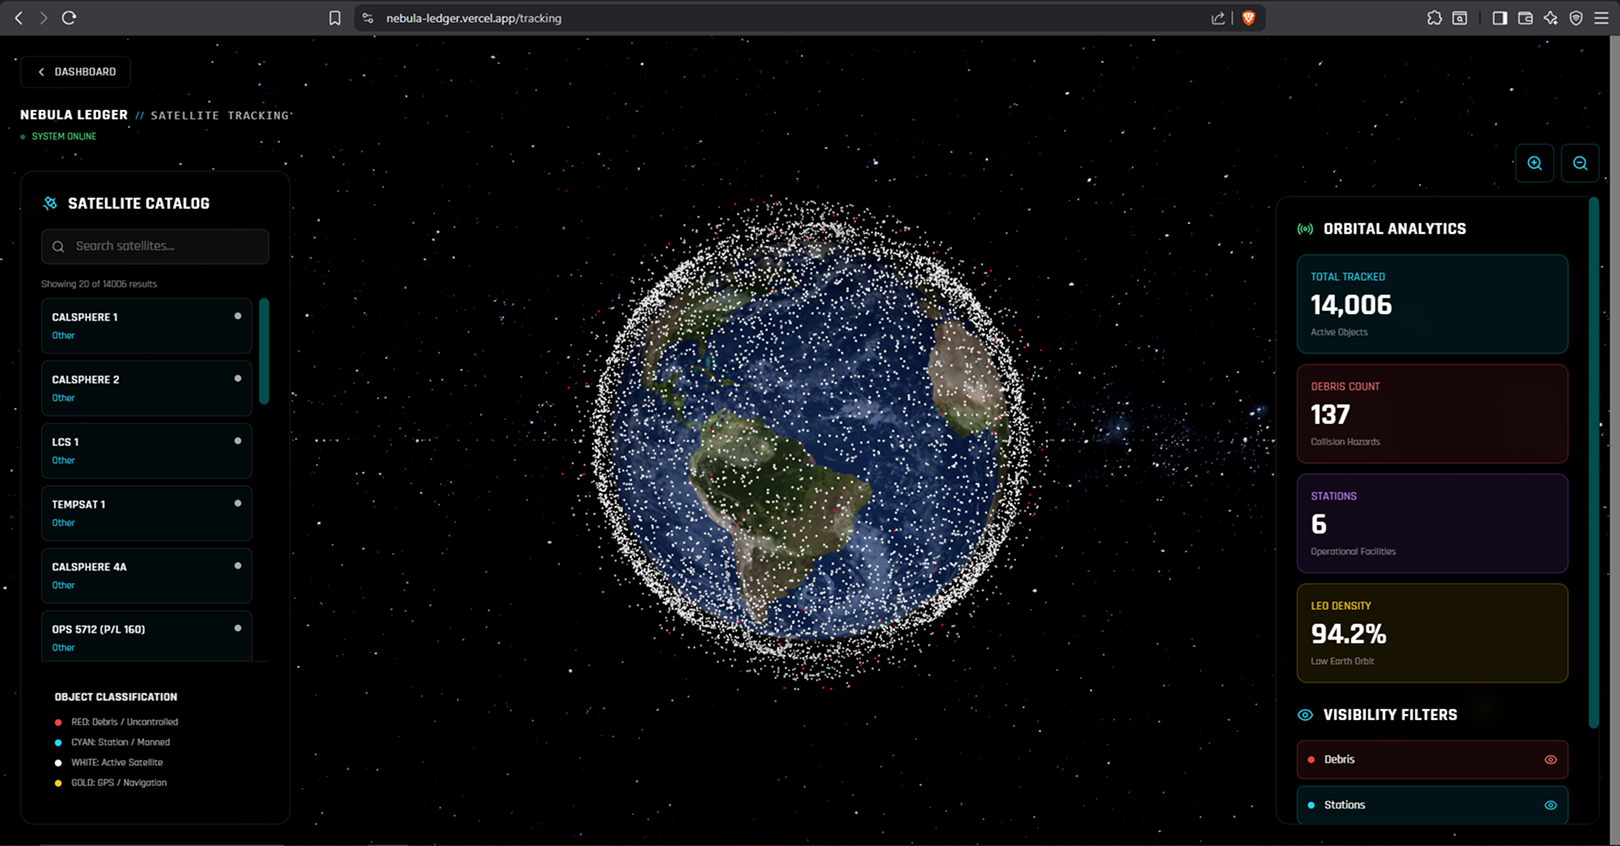
Live Satellite Tracking
-
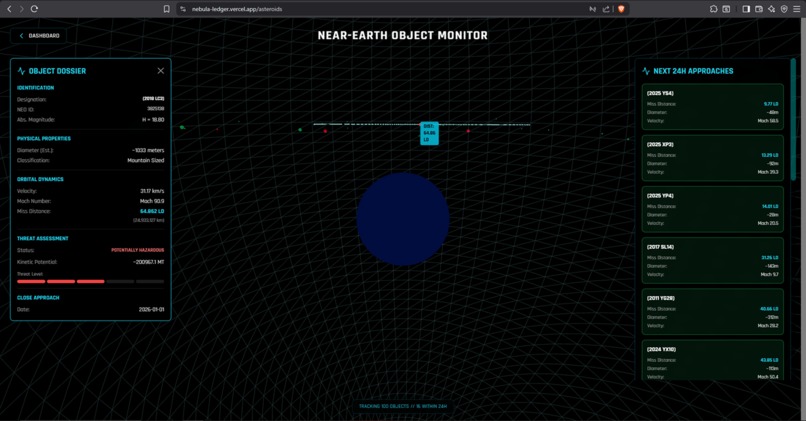
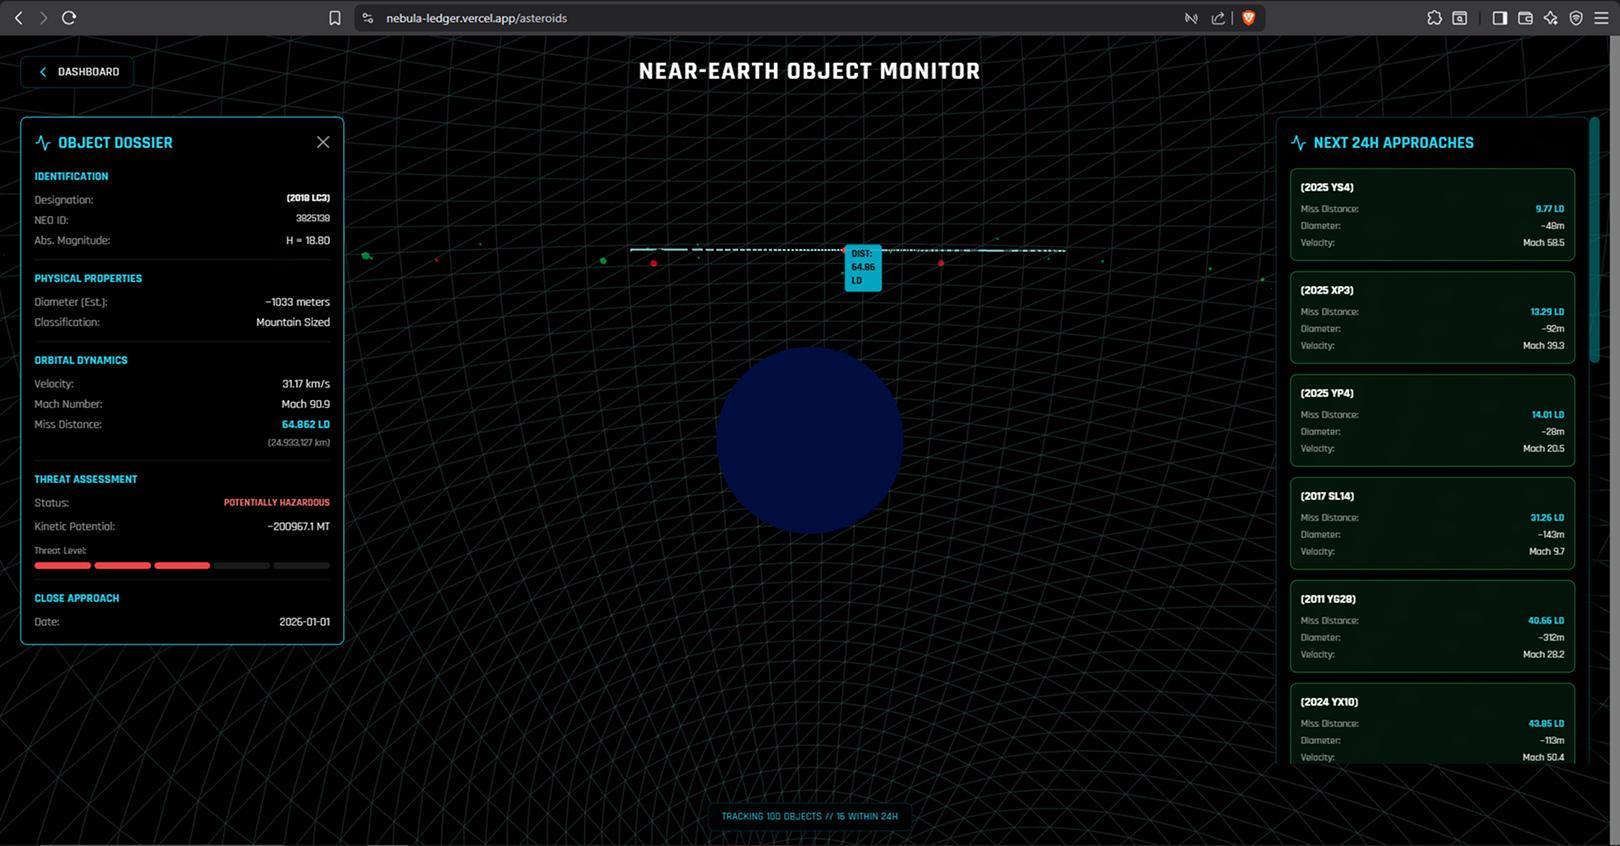
Near-Earth Objects
-

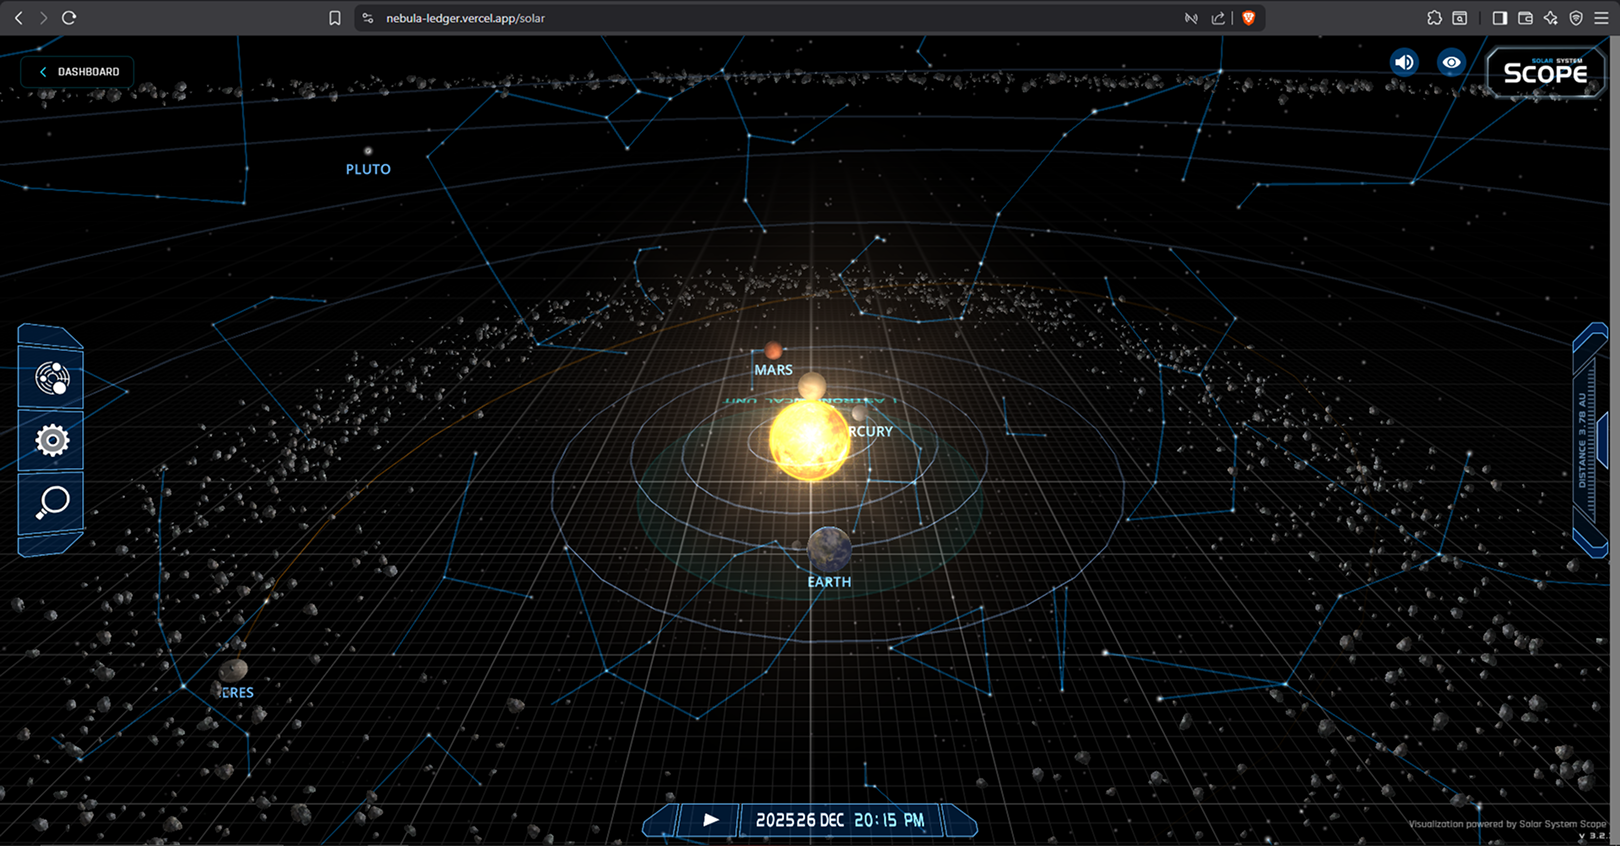
Solar System Map
Inspiration
When we first thought of "ORBIT", we were struck by how many people are currently using space. Generally speaking, Low Earth Orbit (LEO) has become overcrowded, with 1000's of operational satellites orbiting the earth on countless trips around the globe. In addition to the satellites, there are numerous scheduled launches each week and millions of possible "near-earth objects" (NEOs) lurking near the satellite belt. For this reason, instead of just a black hole, we now see the vastness of space as a very busy thoroughfare.
We wanted to create a "God's-eye view" of this chaos, so we decided to create an integrated tool, which was inspired by NASA's various tools that typically would require multiple websites to view weather satellites, asteroid tracking, launch schedules, etc. Our vision for Nebula Ledger is to give everyone, from school students to space enthusiasts, access to Space Situational Awareness (SSA) at the touch of a button by allowing them to see all the real-time "Orbital Intelligence" (OSINT) in one place.
What it does
Nebula Ledger serves as a real-time orbital monitor that encompasses four different ‘Command Modules’:
🛰️ Satellite Telemetry: This module monitors active satellites as they orbit Earth in live time. It also visualizes each satellite’s ground track over a dark-mode map and calculates real-time velocity and altitude based on physics simulation based propagation.
☄️ Asteroid Sentry: A 3D visual representation of the Planetary Defense System for ‘City Killer’ asteroids. This module shows the path of asteroids that near Earth and are considered dangerous using the NASA NeoWs API. Logarithmic scaling allows for smaller meteoroids to be seen in comparison with immense Earth and the kinetic energy (in Megatons) and Mach number estimates for these objects.
🚀 Launch Command: A global dashboard containing current launch manifests from around the world. The countdown clock will show T-Minus up to a millisecond before launch time. Further, this module will show both Earth’s and each launch facility’s location on a 3D globe.
☀️ Solaris: A heliocentric model of our solar system that can be used to track planetary alignment; thus, it is interactive.
How we built it
The user interface was developed using React (Vite) for speed and Three.js (@react-three/fiber) for the main heavy 3D imagery of the satellites. The Physics Engine: The SGP4 (Simplified General Perturbation 4) algorithm was used to accurately calculate the location of satellites in real-time (lat/longitude/altitude) via the collection of raw TLE (two-line element) data sourced through CelesTrak. 3D Visualization: Using React Three Fiber, we were able to construct 3D models of the earth, stars, and orbits. Specifically, we designed a custom coordinate conversion tool for converting 2D geodetic coordinates (latitude/longitude) into 3D Cartesian coordinates ($x,y,z$) so that we could accurately model launch pads on a spherical surface. Data Aggregation: We connected with a number of APIs—NASA NeoWs (near earth objects) for asteroids, The Space Devs (LL2) for launches, and Solar System Scope for planetary information. The "hybrid HUD" System: In order to avoid WebGL crashes caused by the dynamic rendering of text, we employed a hybrid technique of using WebGL for rendering the planet but we used HTML/CSS transformations to overlay our data markers above that. This allowed us to maintain an average framerate of 60 frames per second (FPS), even on lower-end devices.
Challenges we ran into
The "Scale Problem": Space is huge, and asteroids are tiny. If we drew everything to scale, you wouldn't see the asteroids. We had to develop a Logarithmic Scaling Formula ($Scale = Base + \ln(Diameter) * k$) to render asteroids that were visible but still visually distinct based on their size.
WebGL Crashes: Initially, we tried to render launch trajectories using complex 3D Tube Geometries that updated every second. This crashed the WebGL context repeatedly. We pivoted to a "Hybrid HUD" architecture, using CSS animations for the markers, which completely solved the stability issues.
Coordinate Math: Mapping a flat Launch Pad coordinate (e.g., Cape Canaveral) onto a rotating 3D sphere required diving deep into spherical trigonometry. We had to debug "phantom launch sites" appearing inside the Earth's core before we got the radius math right.
Accomplishments that I am proud of
Mathematical Accuracy: The positions of the satellites are mathematically propagated using authoritative methods. Similarly, the velocities for the asteroids are accurate as well and the countdowns are genuine.
Zero-Crash Stability: By optimizing our 3D scene for use with high resolution textures (8K Earth Maps), we eliminated lag on all browsers.
UI/UX: Not only were we able to achieve a slick look that is very "Dark Mode" in style but we also made it feel more like a professional telemetry/dashboard rather than a toy.
What I learned
Rocket Science: ORBITAL MECHANICS: THEORY AND USE OF ORBITAL ELEMENTS - inclinations, eccentricities, etc.
Optimization with React: We have come to understand that re-rendering 3D Geometry every single second is not an efficient way to display content. The use of react.memo and useMemo to optimize 3D components has been a huge success.
API Administration: Learning how to handle rate limits, error handling, and loading states when receiving asynchronous data from four separate aerospace APIs has greatly improved our overall competence as software developers.
What's next for Nebula Ledger
Tracking Space Debris: Adding a layer to show "Space Debris" will help track the increase in junk being left behind in low earth orbit (LEO).
Starlink Satellite Constellation View: A way for users to view the thousands of Starlink satellites in various stages of their orbital path, or "trains".
Virtual Reality on Mobile: We want to develop support for a virtual reality mode to allow users to "stand" in outer space and see the satellites travelling by.
Built With
- celestrak
- javascript
- nasa
- react
- solarsystemscope
- spacedevs
- tailwind
- three.js
- vite

Log in or sign up for Devpost to join the conversation.