Nebraska Livestock Visualization
INTRODUCTION
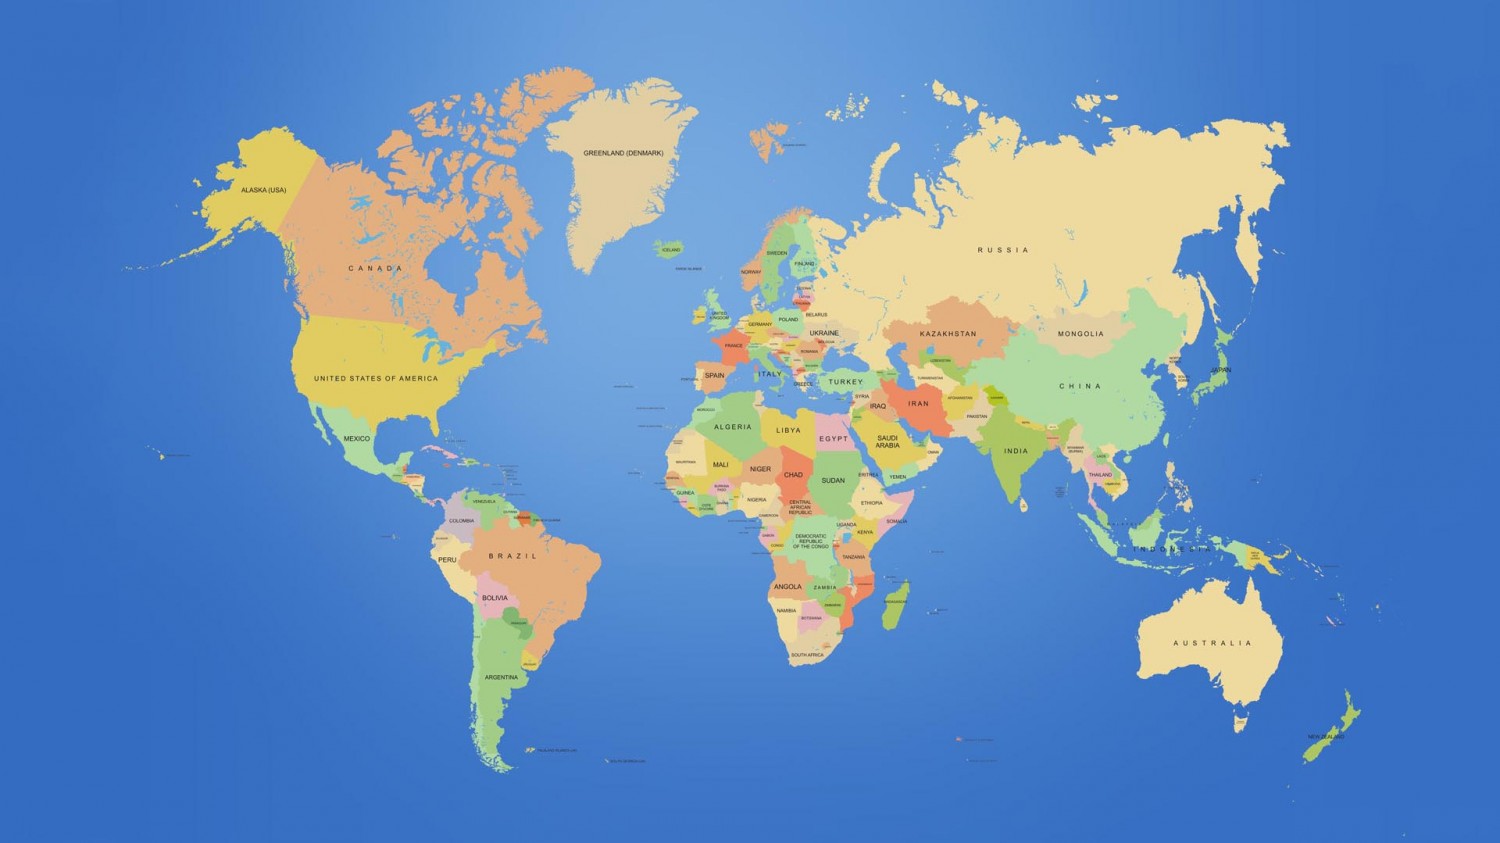
This program collects in the Nebraska water export (in the form of corn, livestock etc) data and visualizes it using the Google Maps API.
This program utilizes PHP as the scripting language; HTML, CSS, and JavaScript for the front-end work and SQL for querying the database.
This project is implemented in 2 phases, a high-level description of which is as follows:
PHASE I
● Write the base PHP code to connect to the database and establish connection
● Query the database appropriately to retrieve the values
● Fetch the Google Maps API framework and 'modify' it as needed, that is, add the CSS and JavaScript components to it
● Using AJAX to pass the SQL values to AJAX and subsequently, pass it on to the necessary methods of the API
PHASE II
● Replacing the Google Maps API with OpenLayers API that supports dynamic visualization (such as arcs going from a place to another).
● Make the front end look prettier with overlapping elements on the console
UTILITIES OF THE PROJECT
This open-source project can serve as a template for visualizing any kind of geospatial data. It can serve as a valuable tool of reference to track the flow of resources from one place to another. The scope of this particular project is limited to visualizing livestock export data from Nebraska to different countries of the world but it can be modified suitably to visualize much larger and diverse datasets as well.


Log in or sign up for Devpost to join the conversation.