-
-
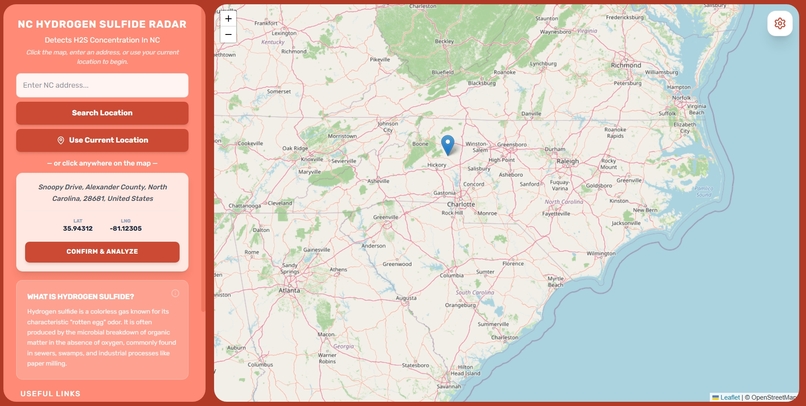
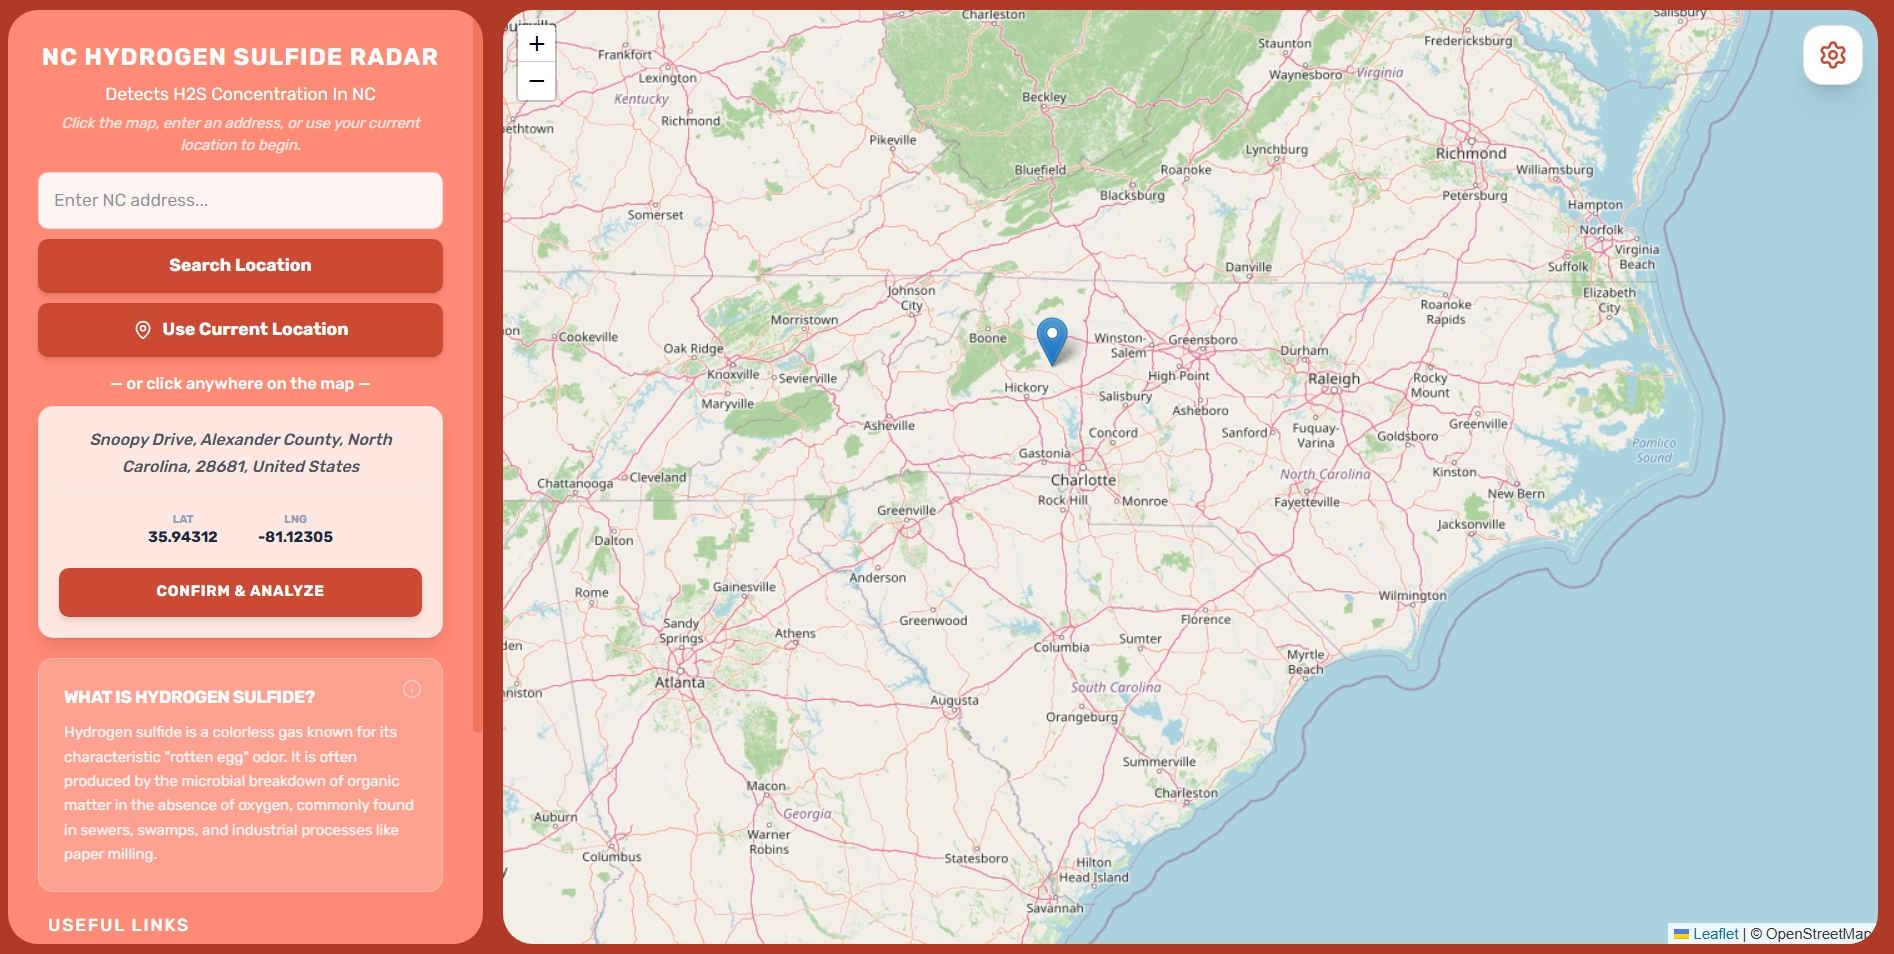
Normal homepage - light mode
-
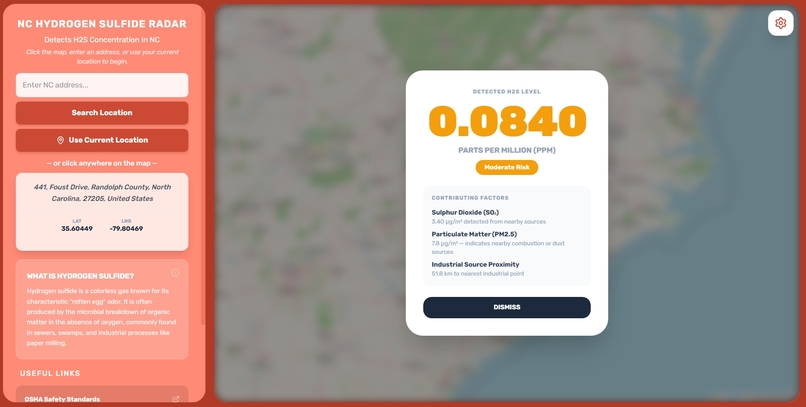
Prediction - light mode
-

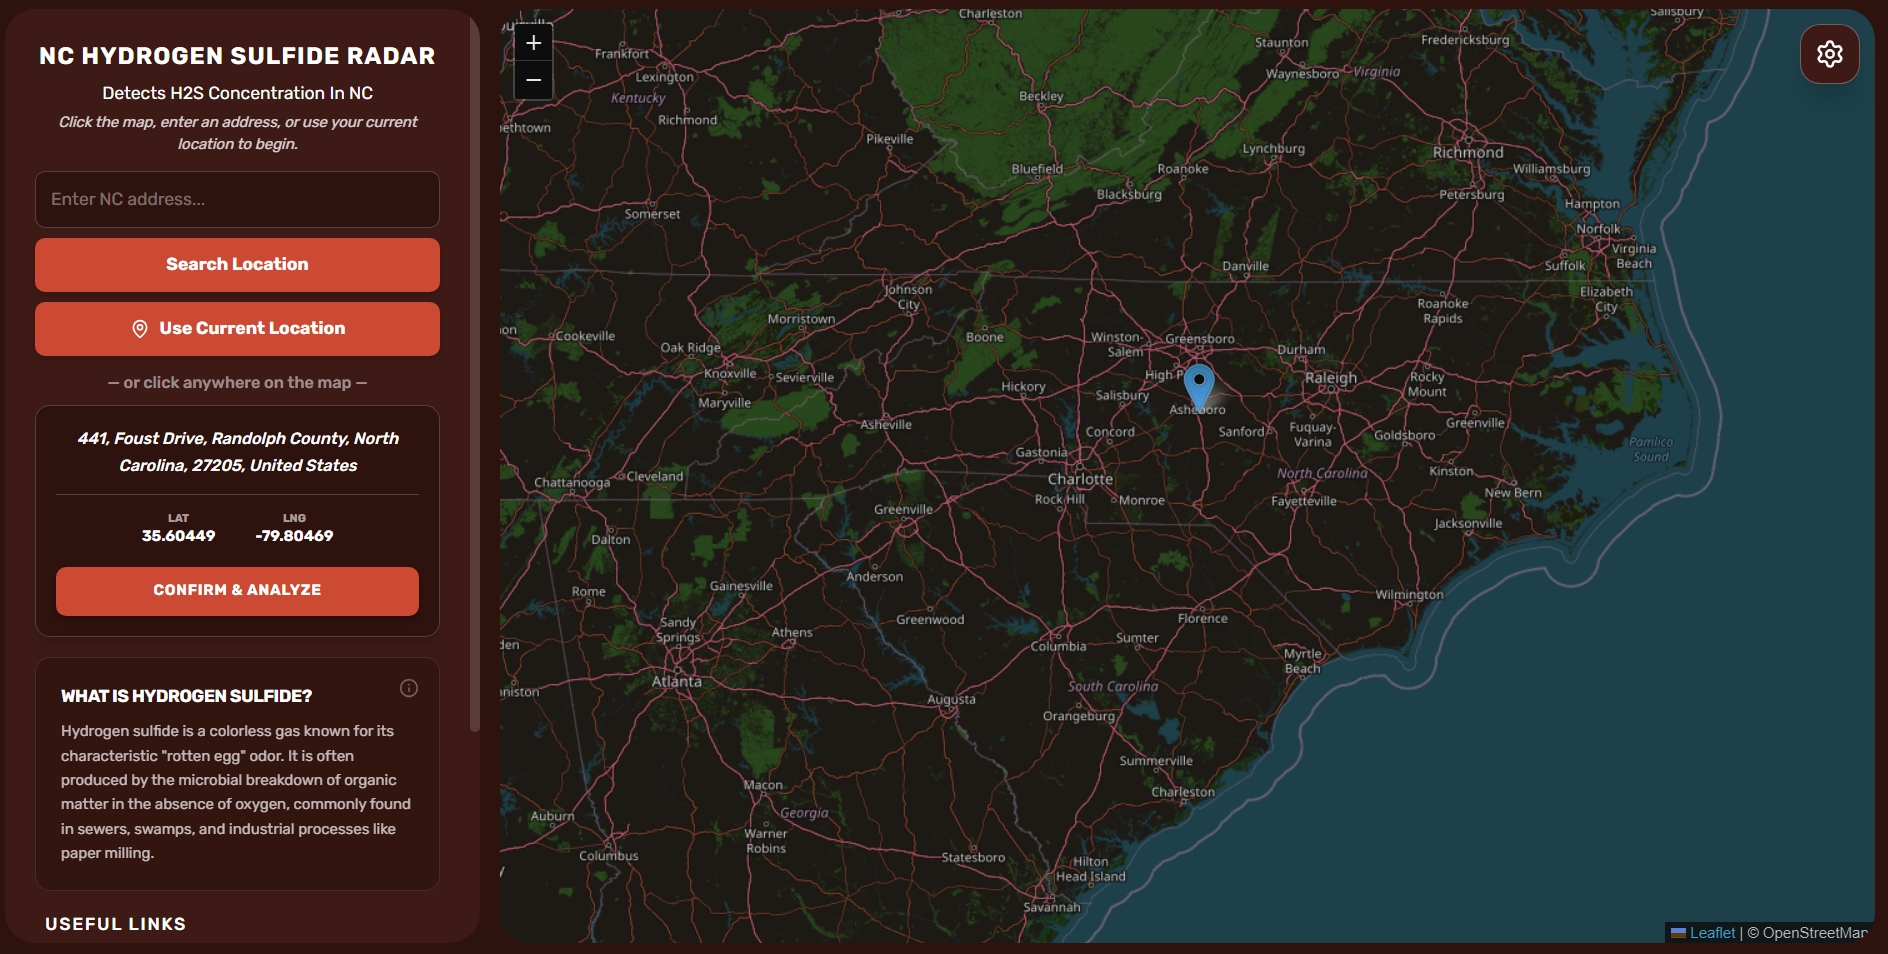
Normal homepage - dark mode
-

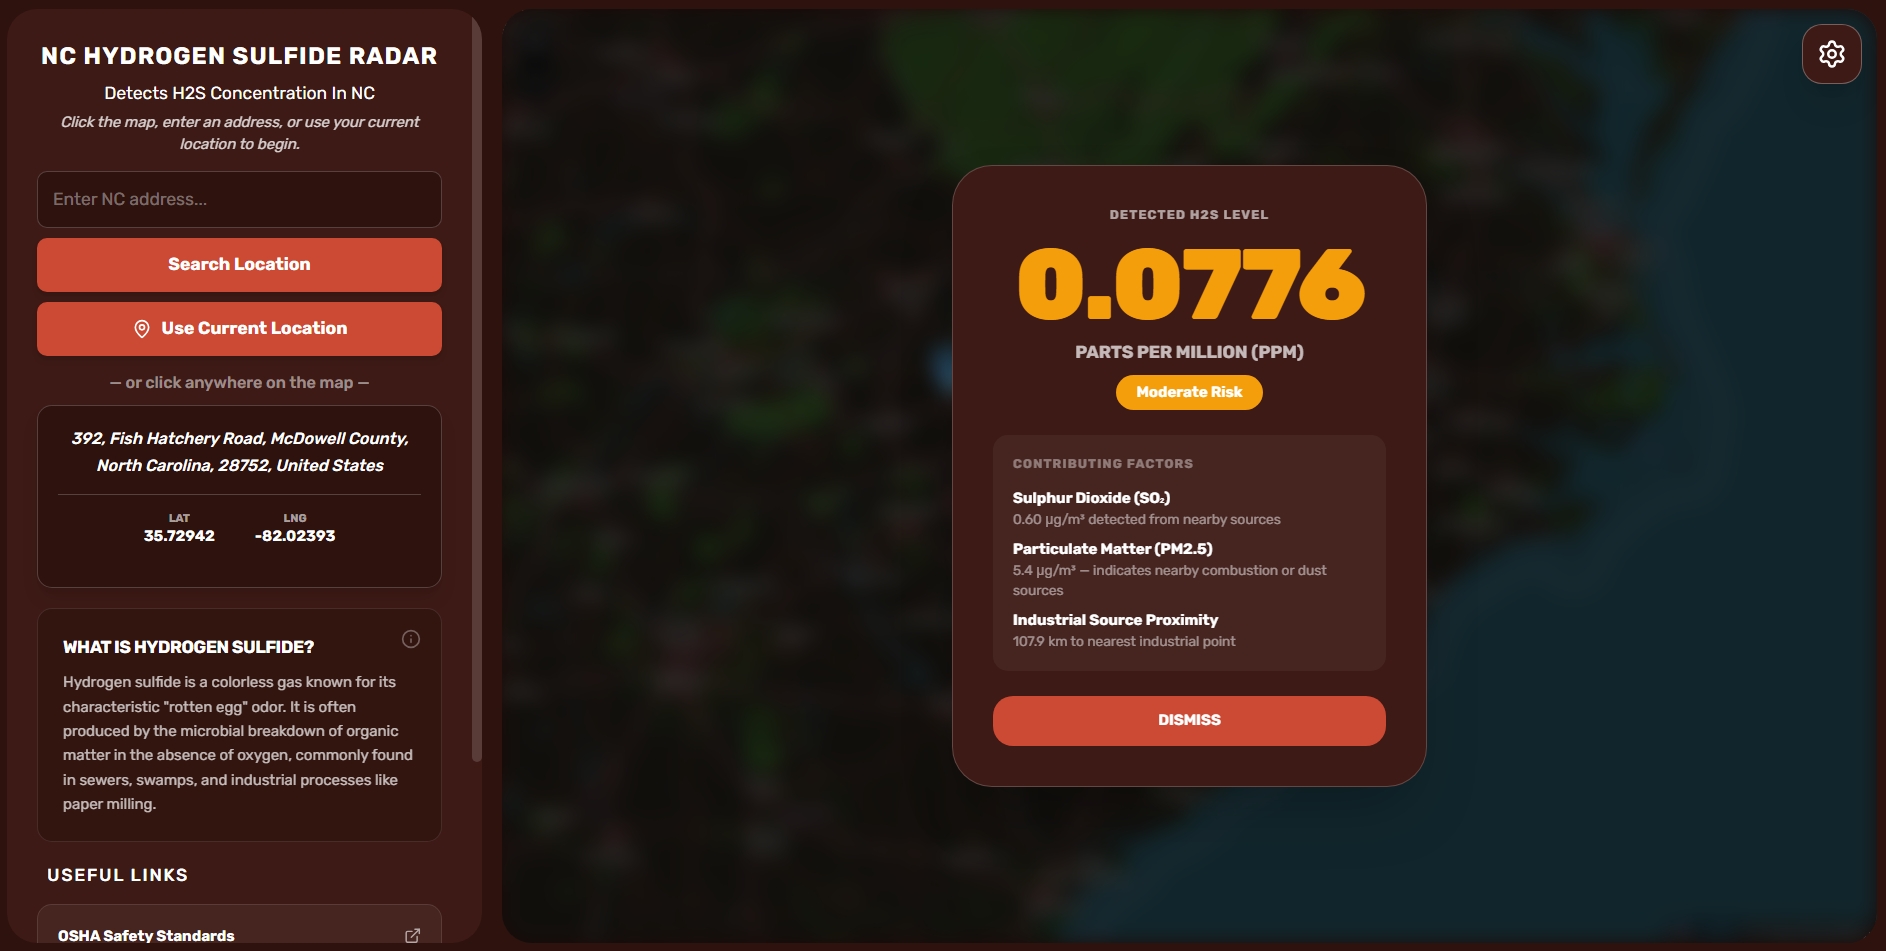
Prediction - dark mode
-
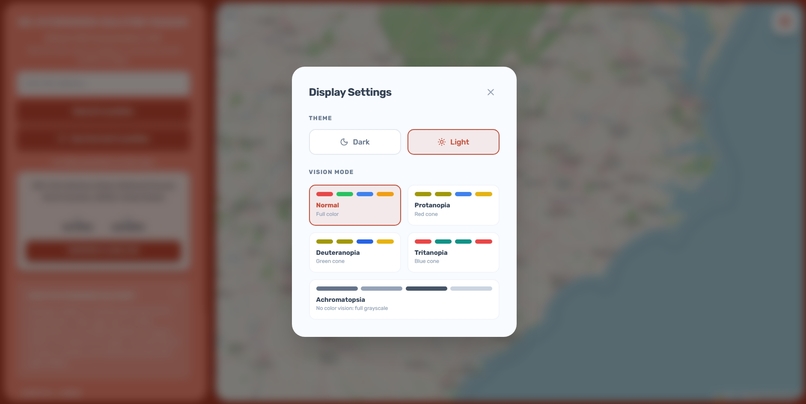
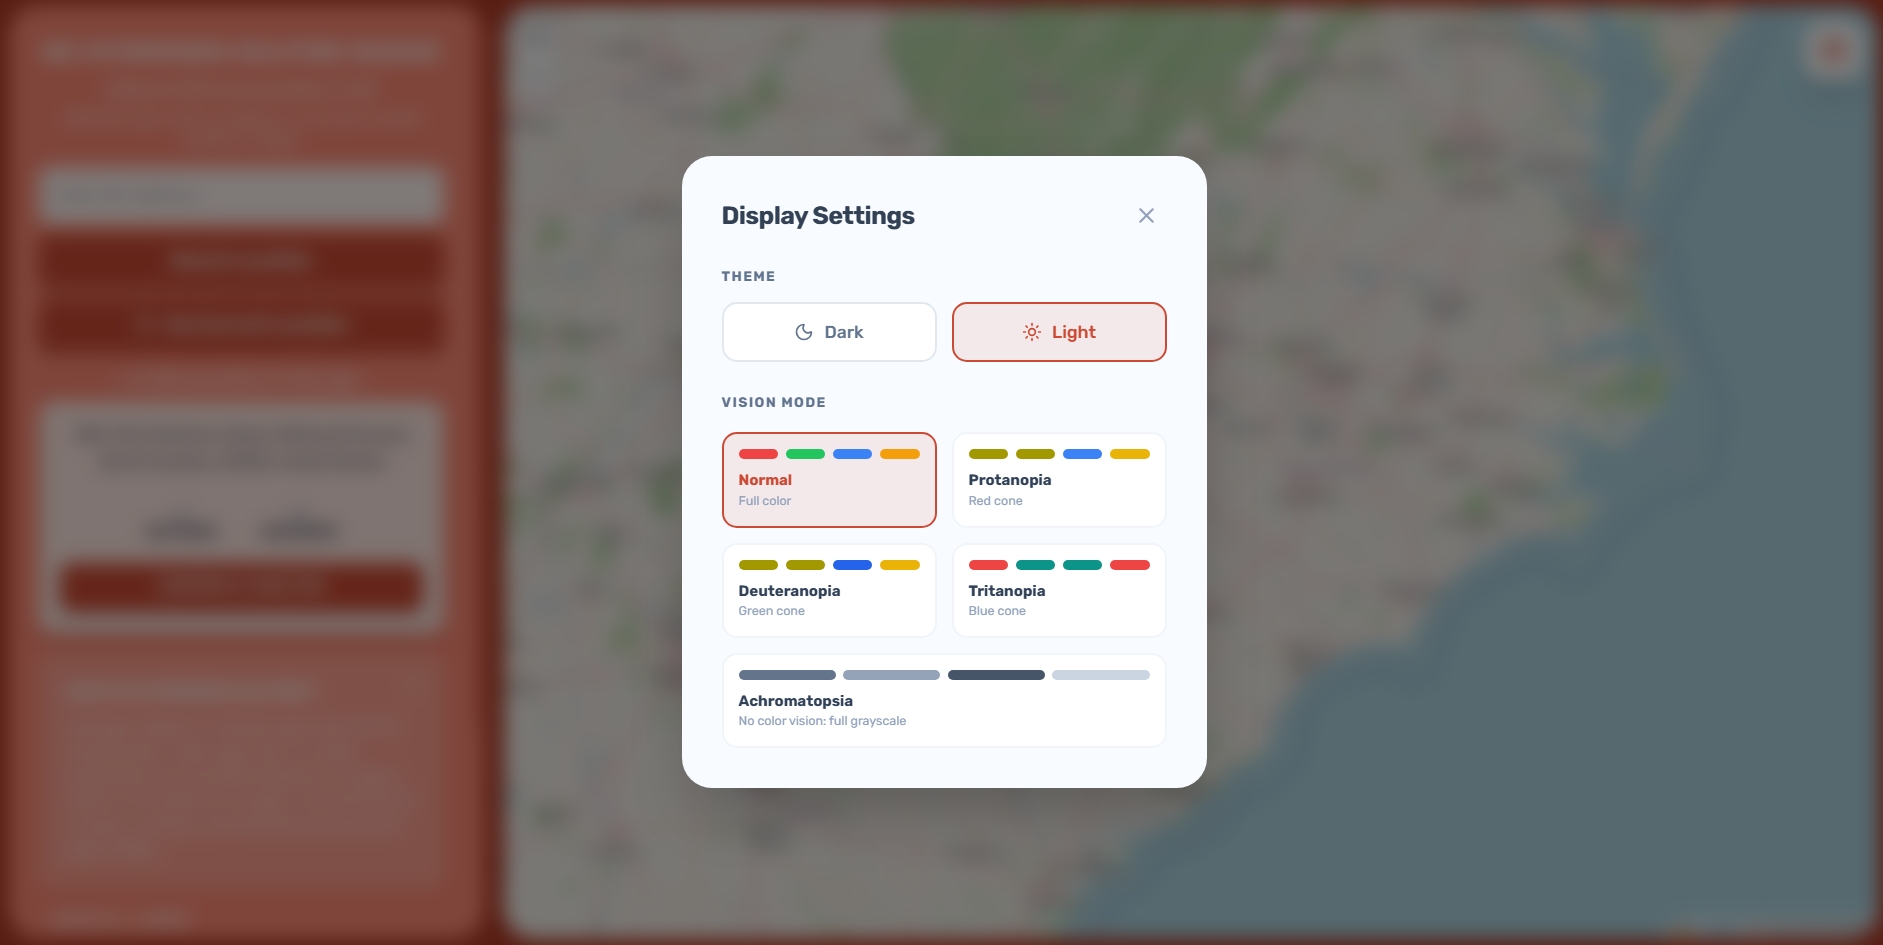
Accessibility settings

NC Hydrogen Sulfide Radar
Inspiration
We grew up in Charlotte, NC, and saw a problem no one had ever heard of here. Just two hours away from us, in Eastern NC, which is one of the world's densest concentrations of industrial hog operations, comes a colorless, odorless gas, hydrogen sulfide, that communities there have been complaining about for decades. It's present everywhere, though, but most prevalent in Eastern NC. No one knows about it. It causes headaches, nausea, respiratory damage, and, at high concentrations, even death. And yet the monitoring infrastructure in NC is almost nonexistent. No person can tell it's there, and before they know it, it ruins their life.
We went insane, not from seeing the pollution itself, but from the gap of tooling that could have been easily fixed, but hasn't yet. Environmental scientists studying this issue have almost no real-time tooling. There is not one good, easy-to-use map you can open, drop a pin on, and immediately get a meaningful estimate for that location. A dwindling number of researchers are still driving out to sites with their handheld sensors, manually logging readings, and building datasets row by row. We wanted to change that.
NCHSR is our answer. A Gradient Boosting Regressor-powered website that gives scientists, researchers, and policymakers an instant, location-based hydrogen sulfide concentration estimate for any point in North Carolina, backed by live environmental data fetched in real time on the click.
What It Does
A user opens the app and is shown an interactive map of North Carolina. They can click any location on the map, search by address, or use their current GPS position. Once a location is confirmed, the app:
fetches live environmental data for that exact coordinate from the Open-Meteo Air Quality and Elevation APIs. This data includes sulfur dioxide, ammonia, PM2.5, carbon monoxide, nitrogen dioxide, dust concentration, and elevation above sea level. No API key was required, and no data gets cached. Every prediction reflects current atmospheric conditions.
combines those live readings with a set of geographic features from the coordinates, closeness to known hog farm clusters across NC, distance to wetland and estuary zones, industrial corridor closeness along I-85 and I-40, coastal plain soil classification, and several other things!
passes the full 21-feature vector through a trained gradient boosting regressor model and returns a predicted hydrogen sulfide concentration in parts per million, a risk classification, and the top three contributing factors ranked by their actual influence on the prediction.
The result appears in an animated modal overlay: the PPM value, a color-coded risk (Low, Moderate, High, Hazardous), and an easy breakdown of what is driving the reading at that location.
How We Built It
The application is split into a Next.js frontend and a Flask backend, designed to be deployed independently, with the backend hosted on Render.
The frontend is written in TypeScript with React and styled with Tailwind. The map is made with Leaflet using react-leaflet. We built custom CSS keyframe animations for the result popup: a spring-curve entrance on the card, fade-up animations for each UI element, and slide-in animations that show the contributing factors one by one. The interface supports a dark mode, three colorblind vision filters (protanopia, deuteranopia, tritanopia), and address support through the Nominatim API.
The backend is a Flask application with a single prediction endpoint. The main file of the system is model.py, which handles features, simulated training data generation, model training, and inference. Geographic features are computed using the haversine formula against specially curated clusters of real NC hog farm centers, industrial sources, and wetland zones from USDA and NC DEQ data. The gradient boosting model is trained on 100,000 simulated NC data points whose hydrogen sulfide values are constructed from domain physics, exponential decay with distance from source clusters, coastal plain amplifiers, elevation factors, and log-normal noise to match the real-world distribution of hydrogen sulfide measurements. The trained model and scaler are committed as .pkl files, so when we deploy to Render, we can skip retraining entirely.
Our live data is fetched in fetch_live_features.py using only Python's standard library urllib. The Open-Meteo Elevation API and Air Quality API are called on every prediction request, and the most recent non-empty hourly reading is extracted for each variable. SO2 and NH3 readings carry direct causal weight in the model because they are co-emitted with hydrogen sulfide from the same agricultural and industrial sources, making them meaningful real-time data even when hydrogen sulfide itself is not directly measured.
Challenges We Ran Into
The most significant challenge was the absence of direct hydrogen sulfide data. Hydrogen sulfide is not a criteria pollutant under the Clean Air Act, so it is not included in the EPA AQS dataset, Open-Meteo, or AirNow. Every free public air quality API we tried to see returned the same set of standard pollutants, and nothing more.
One other challenge we ran into was actually choosing our tech stack. We had many options to choose from, but we ended up with Next.js and Flask because they offered easy accessibility.
Accomplishments We Are Proud Of
We're proud we built a working ML application that can actually help scientists. Every prediction is made with real data fetched on the click. The risk classification aligns with OSHA and NIOSH hydrogen sulfide exposure thresholds, making the output not only visually appealing but also scientifically proven. The contributing factors panel shows the actual contributing factors for each location rather than generic factors, so a researcher can quickly understand what is driving the estimated concentration.
We are also proud of our accessibility work: the three colorblind vision filter modes are rarely seen in hackathon projects, and it shows we want to make environmental data tools usable by everyone.
What We Learned
We came in knowing machine learning and web development.
We left with a much deeper understanding of the environment, the NC regulatory landscape, and what it actually means to build a scientific tool. Designing for scientists forced us to be creative and precise in ways products to the people do not; every label, every threshold, and every factor had to be accurate enough for a researcher to trust.
We also learned that the absence of data is itself a problem. When the data you need doesn't exist, you have to reason carefully about what does exist, what it implies, and how to be transparent with your users about the uncertainty involved.
Business Model
NC Hydrogen Sulfide Radar targets three customer markets.
Environmental research institutions are our first market. The universities, state agencies, and federal research programs studying air quality in NC currently lack a good tool like ours. We would offer a research API subscription, tiered by request volume, that gives institutions access to predictions across coordinate grids. A research team could query our API across a 10x10 grid of eastern NC to obtain a full hydrogen sulfide concentration surface in seconds, something that would otherwise require weeks of fieldwork.
Environmental law and consulting firms represent a second market. Hydrogen sulfide litigation in NC has been active for years. Our platform provides attorneys and expert witnesses with defensible, timestamped, location-specific concentration estimates that can support field measurements.
State and local government agencies are the third market. The NC Department of Environmental Quality and county health departments have a mandate to monitor air quality near concentrated animal feeding operations, but lack the tools to do so efficiently. We would offer a government licensing tier with bulk access and custom reporting.
Revenue would come from API subscription tiers, institutional licensing, and a premium dashboard product with historical trend analysis and alert systems. Our cost structure is low: Open-Meteo is free, Render hosting scales with usage, and the model runs on commodity compute. Gross margins will be high from day one!
What's Next
The most important next step is integrating real hydrogen sulfide sensor data as it becomes available. Several NC universities and advocacy organizations operate small sensor networks near hog operations. Partnering with them to use their readings as ground truth labels would allow us to fine-tune the model and dramatically improve prediction accuracy.
We also want to extend coverage beyond North Carolina. The same architecture can apply to any region with concentrated animal agriculture: Iowa, Missouri, etc, all have comparable hydrogen sulfide problems and no equivalent tooling.
Long-term, we want to build an alert system that notifies subscribed researchers when predicted hydrogen sulfide levels at a monitored location exceed a configurable threshold, turning the radar from a lookup tool into an active monitoring platform.
We want to do everything we can to keep people safe from this gas no one has seen before.
Acknowledgments and Resources
Here were the resources we used! We would also like to thank the hackathon organizers and judges for taking the time to review our project. We really do appreciate it :).
Horton, Rachel A., et al. "Malodor as a Trigger of Stress and Negative Mood in Neighbors of Industrial Hog Operations." American Journal of Public Health, vol. 99, no. S3, 2009, pp. S610–S615. PubMed Central, https://pubmed.ncbi.nlm.nih.gov/19890165/.
Guidry, Virginia T., et al. "Hydrogen Sulfide Concentrations at Three Middle Schools near Industrial Livestock Facilities." Journal of Exposure Science & Environmental Epidemiology, vol. 27, no. 2, 2017, pp. 167–174. PubMed, https://pubmed.ncbi.nlm.nih.gov/27094997/.
Wing, Steve, et al. "Environmental Injustice in North Carolina's Hog Industry." Environmental Health Perspectives, vol. 108, no. 3, 2000, pp. 225–231. PubMed, https://pubmed.ncbi.nlm.nih.gov/10706528/.
Nickerson, Charlotte, and Sacoby Wilson. "CAFOs and Environmental Justice: The Case of North Carolina." PubMed Central, 2013, https://pmc.ncbi.nlm.nih.gov/articles/PMC3672924/.
University of Maryland Center for Community Engagement, Environmental Justice & Health. "Fighting Hog Farm Health Hazards in Eastern North Carolina." CEEJH, 26 Aug. 2019, https://www.ceejh.center/southeast/projects/fighting-hog-farm-health-hazards-in-eastern-north-carolina-gz74r-yyd3t-88a2x.
Bell, Michelle L., et al. "Modeling and Analysis of Air Pollution and Environmental Justice: The Case for North Carolina's Hog Concentrated Animal Feeding Operations." PubMed Central, 2023, https://pmc.ncbi.nlm.nih.gov/articles/PMC10449010/.
United States Environmental Protection Agency. "Lifting of Administrative Stay for Hydrogen Sulfide." EPA, https://www.epa.gov/toxics-release-inventory-tri-program/lifting-administrative-stay-hydrogen-sulfide. Accessed 2 May 2026.
South Carolina Department of Environmental Services. "Air Monitoring for Hydrogen Sulfide." SCDES, https://des.sc.gov/programs/bureau-air-quality/air-monitoring-hydrogen-sulfide. Accessed 2 May 2026.
Reiffenstein, R. J., et al. "Environmental Toxicology of Hydrogen Sulfide." PubMed Central, 2018, https://pmc.ncbi.nlm.nih.gov/articles/PMC5777517/.
Ahamed Shafeeq, B. M., et al. "Ensemble Learning for Air Quality Index Prediction: Integrating Gradient Boosting, XGBoost, and Stacking with SHAP-Based Interpretability." Scientific Reports, vol. 16, article 8544, 2026, https://www.nature.com/articles/s41598-026-39232-w.
Alyousifi, Yousif, et al. "Machine Learning-Based Forecasting of Air Quality Index under Long-Term Environmental Patterns: A Comparative Approach with XGBoost, LightGBM, and SVM." PLOS ONE, 8 Oct. 2025, https://journals.plos.org/plosone/article?id=10.1371/journal.pone.0334252.
Feng, Roubing, et al. "Forecasting Urban Air Quality in Paris Using Ensemble Machine Learning: A Scalable Framework for Environmental Management." PubMed Central, 2025, https://www.ncbi.nlm.nih.gov/pmc/articles/PMC12633865/.
Side note:
Render may take an upwards of 5 minutes to load :)
Built With
- flask
- gradient-boosting-regressor
- leaflet.js
- lucide-react
- next.js
- nominatim-geocoding-api
- numpy
- open-meteo-air-quality-api
- open-meteo-elevation-api
- python
- react
- react-leaflet
- render
- scikit-learn
- tailwind-css
- typescript


Log in or sign up for Devpost to join the conversation.