-
-
strategic insights
-
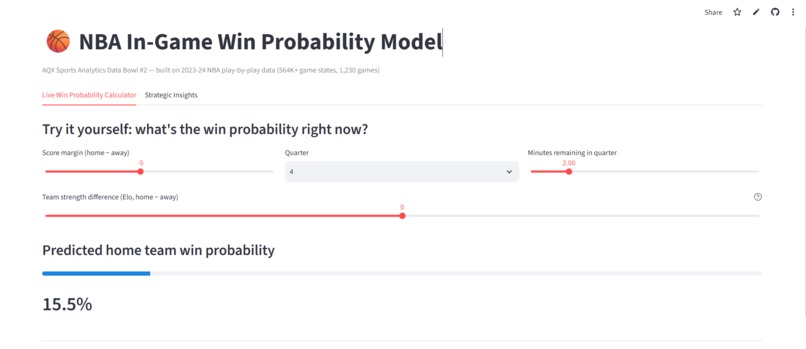
home page
Inspiration
Anyone who's watched a close basketball game knows the feeling: a 10-point lead with five minutes left feels safe until suddenly it doesn't. Announcers say things like "this is far from over" or "you can never feel good about this lead" — but that's a gut feeling, not a number. I wanted to know: exactly how safe is a given lead, at a given point in the game? And once I had that answer, could the same model tell me something a coach could actually use — not just "who's going to win," but "when does a single possession matter most" and "does calling a timeout during a run actually work"?
That's what turned this from a modeling exercise into something with real practical application, which is exactly what this hackathon rewards.
What it does
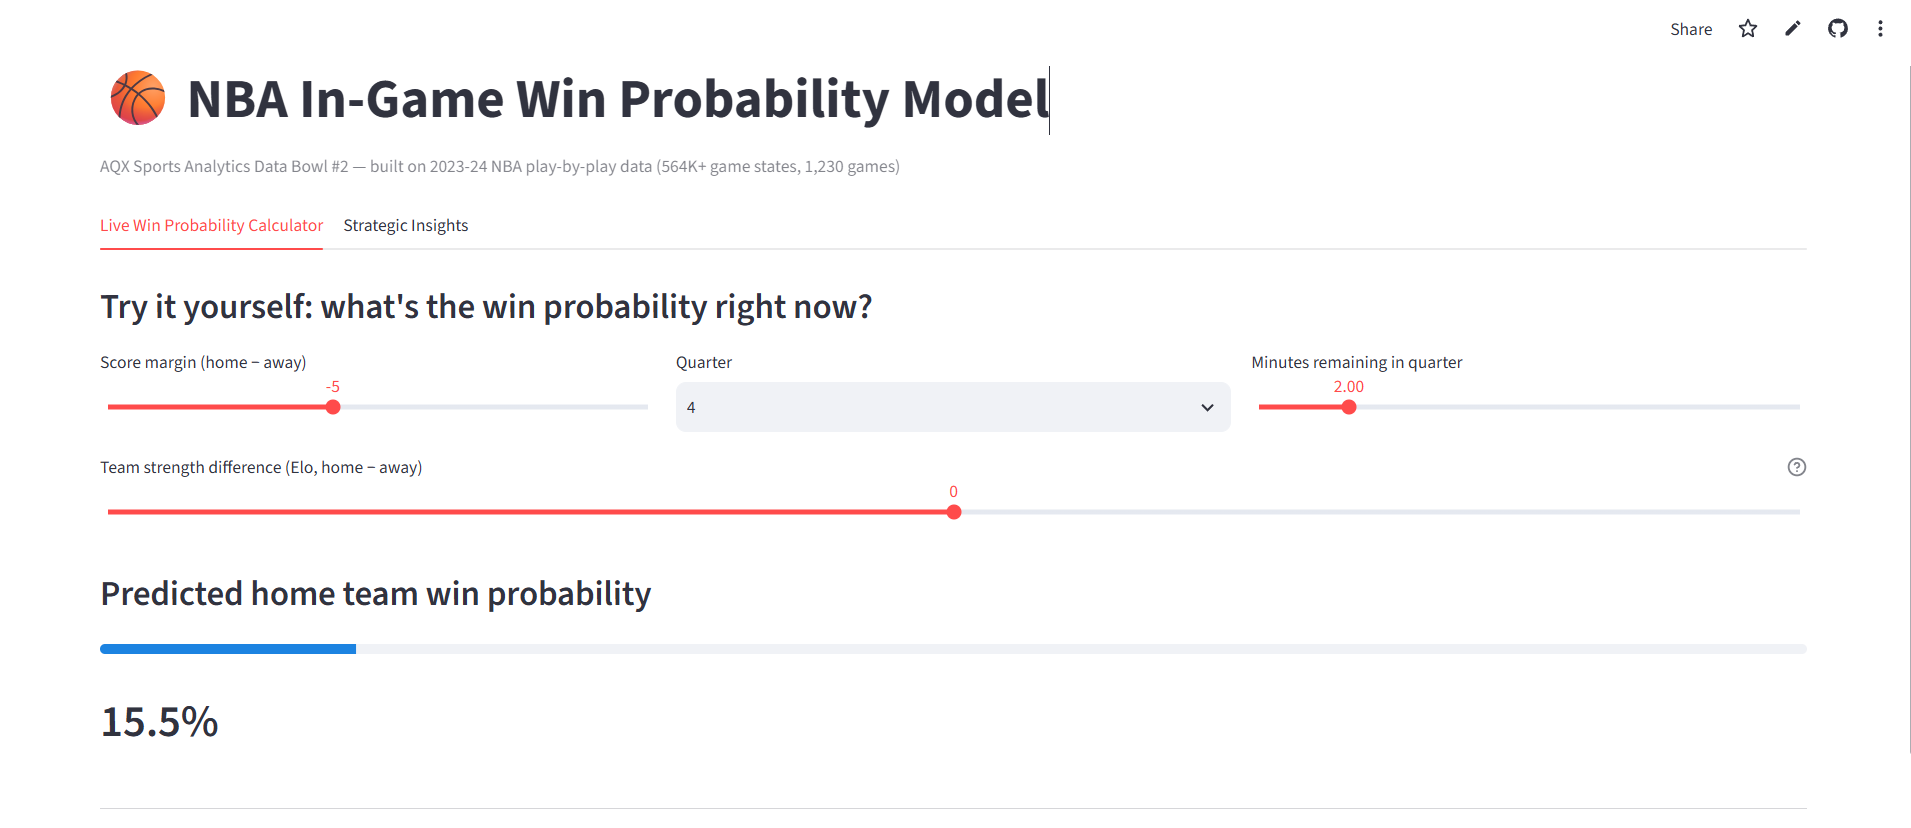
The project builds an in-game win probability model trained on a full NBA season of real play-by-play data (564,000+ game states across 1,230 games), then mines that model for three concrete, actionable insights:
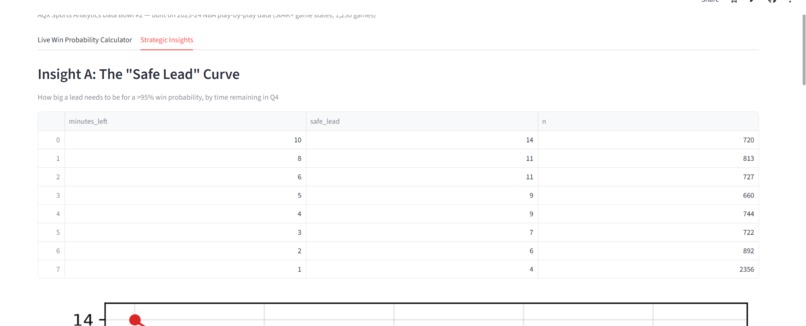
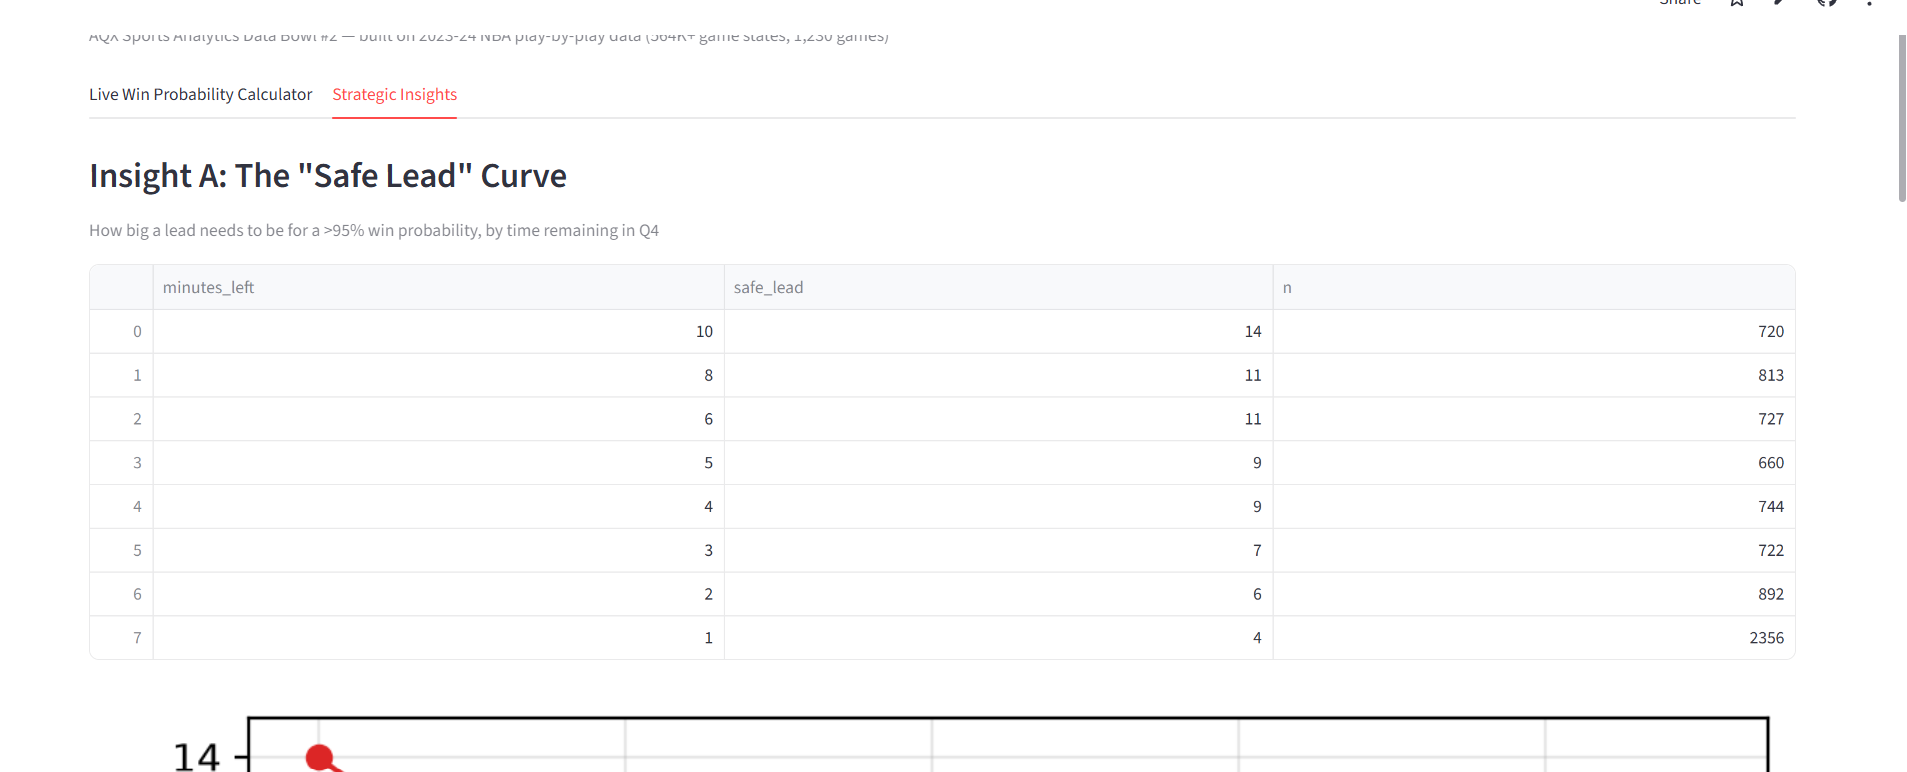
- The "Safe Lead" Curve — exactly how many points you need to be up, at any point in the 4th quarter, to have a 95%+ chance of winning. (Spoiler: 14 points with 10 minutes left shrinks to just 4 points in the final minute.)
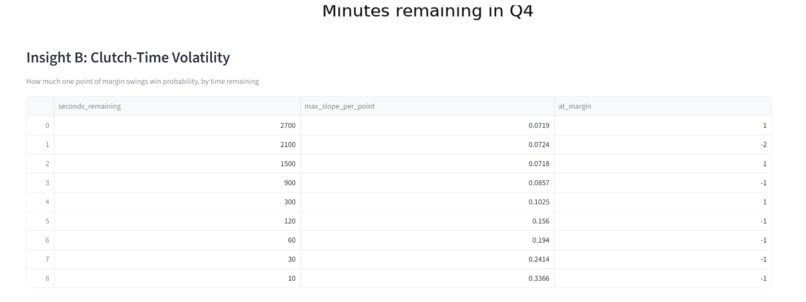
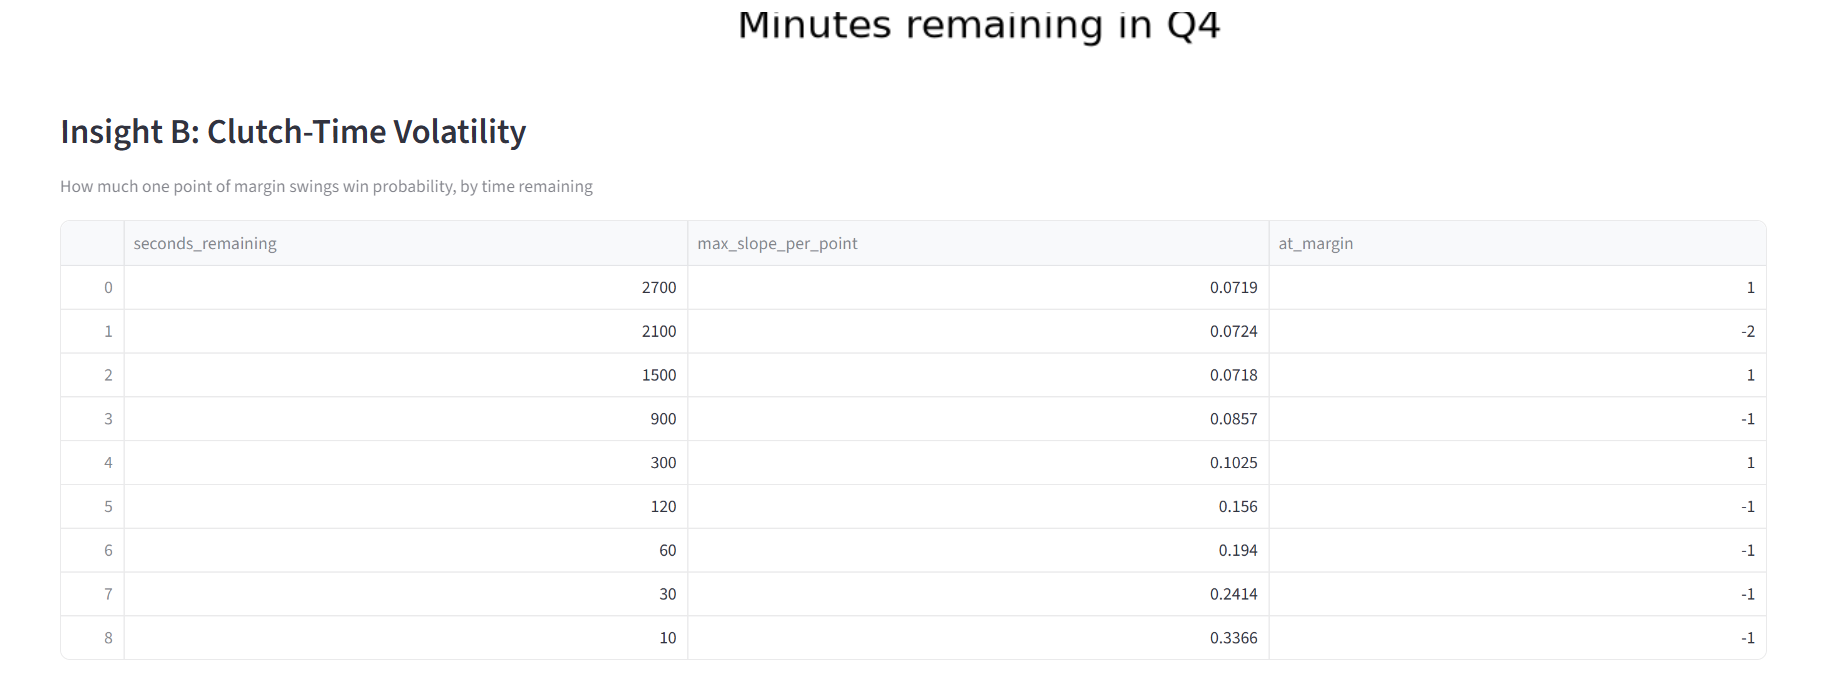
- Clutch-Time Volatility — quantifying how much more a single possession matters as the clock runs down. A one-point swing in the final 10 seconds moves win probability roughly 5x more than the same swing in the first quarter.
- Timeout Effectiveness — evidence that calling a timeout during an opponent's scoring run actually slows it down, on average. Teams went from losing ground (-3.69 points of momentum) before the timeout to roughly neutral (+0.53) afterward.
How I built it
Data: Rather than fighting NBA.com's rate limits directly, I pulled play-by-play data from an open GitHub-hosted mirror of stats.nba.com data (shufinskiy/nba_data) — a huge time-saver that let me get straight to modeling instead of scraping.
Feature engineering: The key insight here wasn't a complicated feature — it was a simple, known transform from sports analytics literature: normalizing score margin by time pressure,
$$ \text{time_pressure} = \frac{\text{score_margin}}{\sqrt{\text{seconds_remaining} + 1}} $$
This single transform captures the non-linear relationship between margin and time far better than feeding raw margin and raw time into a model separately.
Team strength: I built a lightweight Elo rating system, updated chronologically game-by-game:
$$ E_{\text{home}} = \frac{1}{1 + 10^{-\frac{(R_{\text{home}} + \text{HCA}) - R_{\text{away}}}{400}}} $$
$$ R_{\text{home}}' = R_{\text{home}} + K \cdot (\text{actual} - E_{\text{home}}) $$
Updating game-by-game (rather than using full-season stats) was essential to avoid leaking future information into earlier predictions.
Modeling: I trained both a logistic regression baseline and an XGBoost model, split by game (not by row) to avoid leaking correlated in-game states across train/test.
Validation: Rather than trusting accuracy alone, I checked calibration explicitly — does a predicted 80% win probability actually correspond to teams winning ~80% of the time? Both models tracked the diagonal closely, meaning the probabilities are honest, not just directionally correct.
Challenges I ran into
- Data access: My original plan was to hit the live NBA stats API directly, but I hit a wall with network restrictions in my dev environment. I pivoted to a static, GitHub-hosted dataset instead — which turned out to be faster and more reliable anyway.
- A humbling result: XGBoost, my "stronger" model, actually performed slightly worse than the simple logistic regression baseline. Instead of hiding that or over-tuning until it looked better, I treated it as a finding: once a game is underway, current score and time dominate the prediction so completely that pre-game team strength barely moves the needle. That's a genuinely interesting result about how basketball games unfold.
- Avoiding fake rigor: It would have been easy to report a flashy accuracy number without checking whether the model was actually well-calibrated, or to claim the timeout finding was "proof" timeouts work when it's really a correlation. Being upfront about what the data can and can't prove was harder than just presenting clean numbers, but it made the final result more trustworthy.
What I learned
- Sometimes the "boring" model wins, and that's worth reporting honestly rather than engineering around it.
- A single well-chosen feature transform (time-normalized margin) can outperform throwing more complexity at a model.
- The gap between "a model that predicts things" and "a model that's actually useful" is the insight-mining step — building the model was maybe half the work; turning it into three specific, coach-usable takeaways was the other half, and the part that matters most for real-world impact.
Built With
- git
- jupyter-notebook
- matplotlib
- numpy
- pandas
- python
- scikit-learn
- xgboost

Log in or sign up for Devpost to join the conversation.