-
-
front page
-
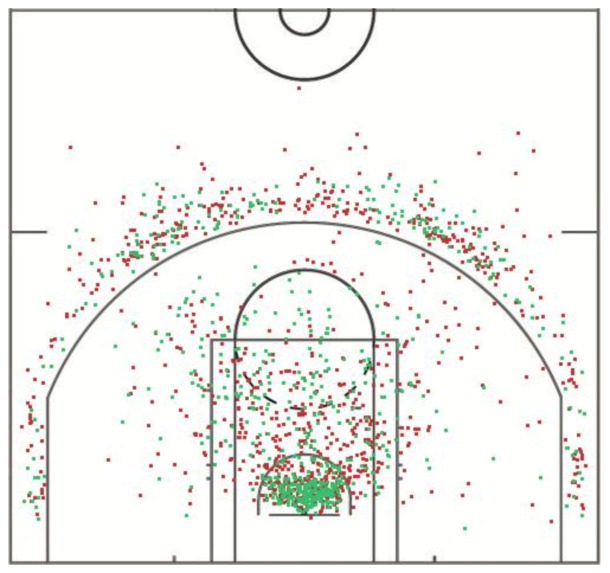
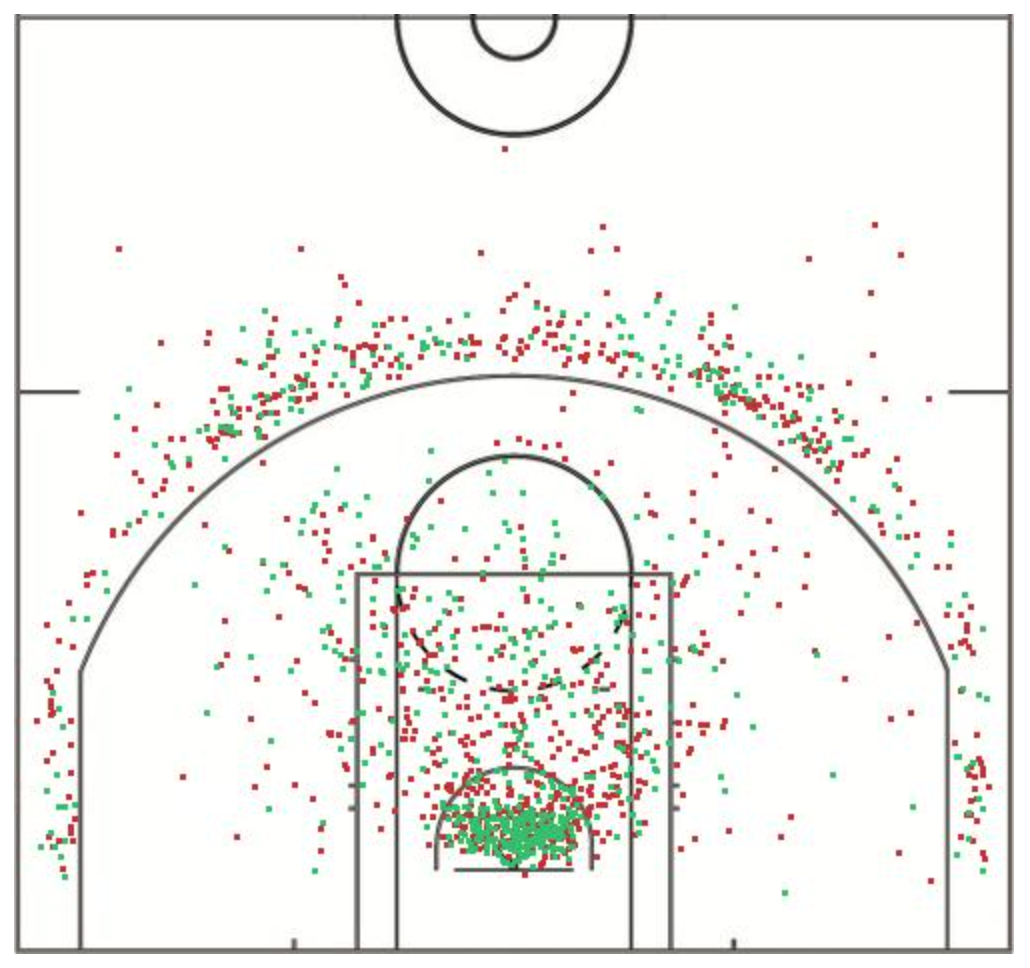
ex. Donovan Mitchell's shot chart

Inspiration
I was inspired by the NBA API. I came across it while looking for free APIs to learn and mess around with. I thought it was particularly interesting and wanted to use it.
What it does
The site displays the shot chart of an NBA player given their player id. It shows, to scale, the location that the shots are taken from and is color-coded to show which shots were missed and which were made.
How I built it
I built it using the NBA API, which contains an endpoint called shotchartdetail that returns information about the type of shot, x and y locations, etc. I stored the values returned by the request in CSV files which I parsed to plot each point on an empty shot chart. I used flask to get the player id from the user in HTML, and I programmed the code to find and plot points in python.
Challenges I ran into
I had trouble working with the server-side aspect of the project, particularly getting the user input in HTML and bringing that to the python file. While I was using VSCode, I could only work with the front-end because I was using a live server extension. I had to switch to PyCharm and implement the back-end. This involved creating a Flask object, which interfered with importing the NBA API at first. After testing with different web servers, such as apache and Django, I returned back to Flask and was able to fix the initial issue.
Accomplishments that I'm proud of
This was my first time working with APIs and back-end development. I'm proud of the accuracy of the shot charts in plotting by pixels.
What I learned
I learned how to use virtual environments and flask. I also learned how to alter images using pixels.
What's next for NBA Player Shot Charts
I anticipate allowing users to search for players by name/team, develop a better UI, and switching game seasons. Currently, it only checks season 2018-19.


Log in or sign up for Devpost to join the conversation.