-
-
NBA MVP Profile
Inspiration
The NBA MVP award often rewards team wins and media narratives rather than pure individual efficiency. We wanted to build a tool that strips away the narrative and asks a data-driven question: what actually constitutes an "MVP statistical profile," and which players are being statistically overlooked?
What it does
NBA MVP Profile Analyzer is an interactive web application built with Streamlit.
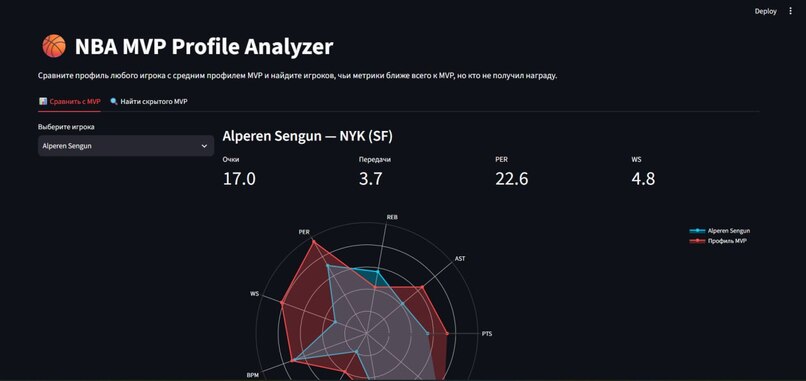
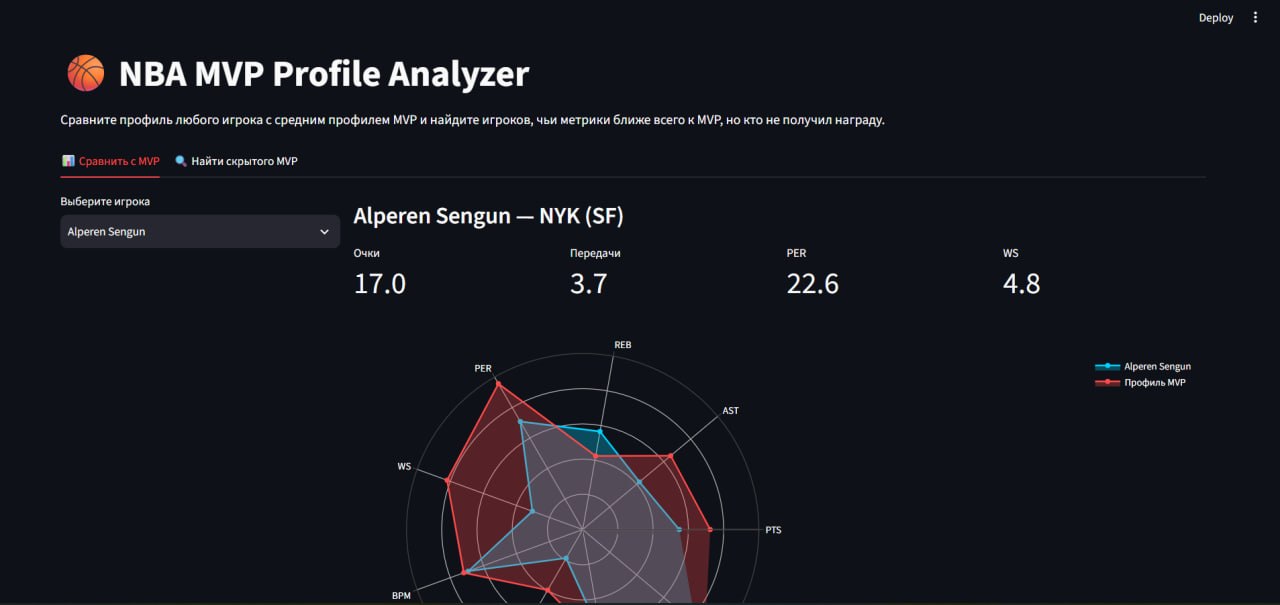
- Compare with MVP Tab: Allows users to select any player and view a dynamic Radar Chart comparing their advanced metrics (PTS, AST, REB, PER, WS, BPM, VORP, USG%, TS%) against the average profile of the Top-5 MVP candidates.
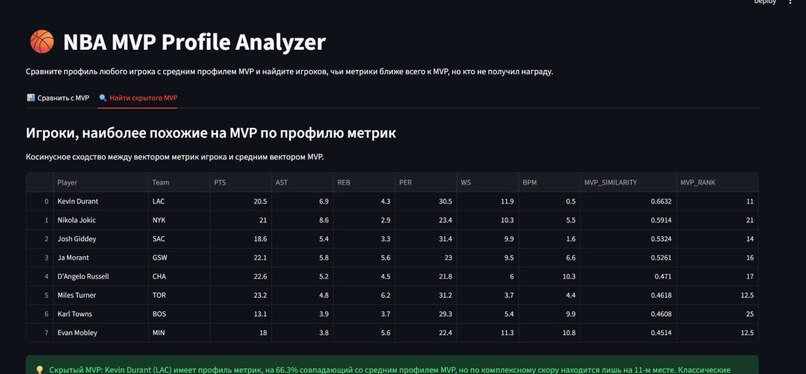
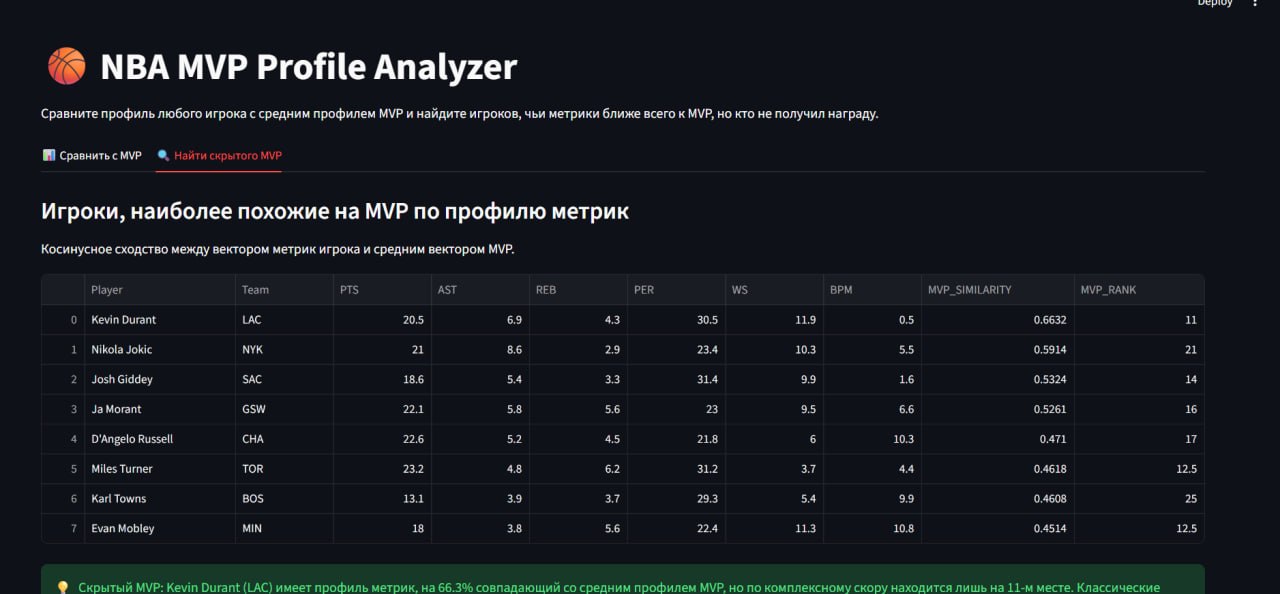
- Find a Hidden MVP Tab: Uses Cosine Similarity (scikit-learn) to calculate how closely a player's normalized statistical vector matches the MVP profile. It surfaces players who have a >90% similarity to MVPs but rank outside the top-10 by our composite MVP score, highlighting underrated talent.
How we built it
- Language: Python
- Framework: Streamlit for the interactive web interface.
- Data Processing: Pandas and NumPy for data manipulation and normalization.
- Machine Learning: Scikit-learn for StandardScaler and Cosine Similarity calculations.
- Visualization: Plotly for rendering the interactive Radar Charts with a custom dark theme.
- Data: We created an automated script (
generate_data.py) that generates a realistic dataset of 120 NBA players across 30 teams, ensuring the project is fully reproducible without external API dependencies.
Challenges we ran into
The biggest challenge was related to environment setup and browser rendering. When running the Streamlit app locally, we encountered a persistent "black screen" issue in the browser. We had to debug the code, verify data generation, resolve WebSocket caching issues, and implement error handling (try-except blocks for data loading) to ensure the app gracefully handles missing data instead of silently failing. We also had to tune the Plotly radar chart normalization so the graph didn't overflow and turn into a white blob.
What we learned
We gained hands-on experience with Streamlit's caching mechanisms and Plotly's polar charts. More importantly, we learned the importance of robust data validation and the difference between documentation (GitHub Pages) and the running application itself.
What's next
We plan to integrate the official NBA API (balldontlie) for real-time stats, add support for historical season comparisons, and deploy the app to Streamlit Community Cloud for public access.


Log in or sign up for Devpost to join the conversation.