-
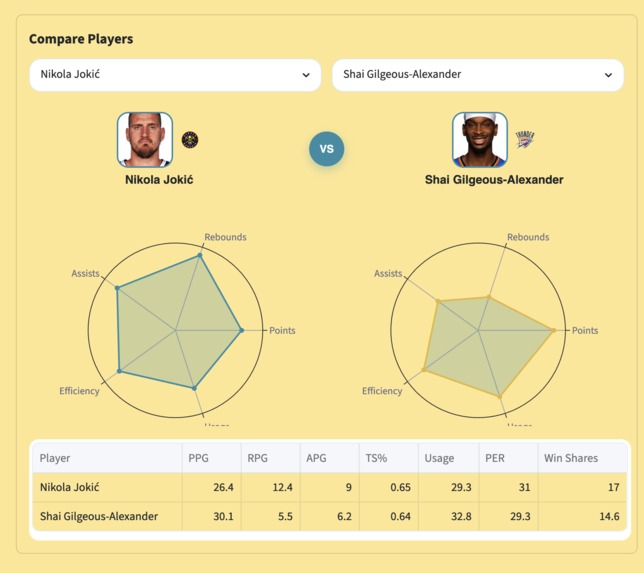
radar chart view
-
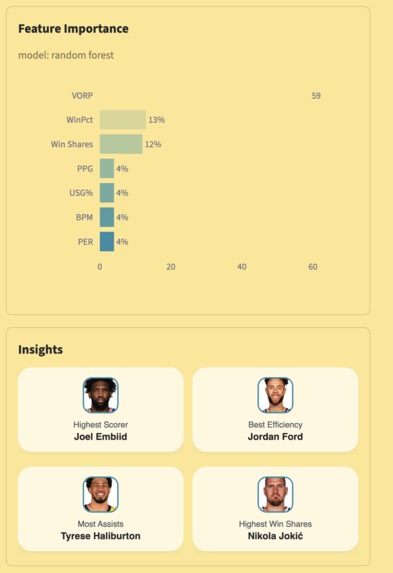
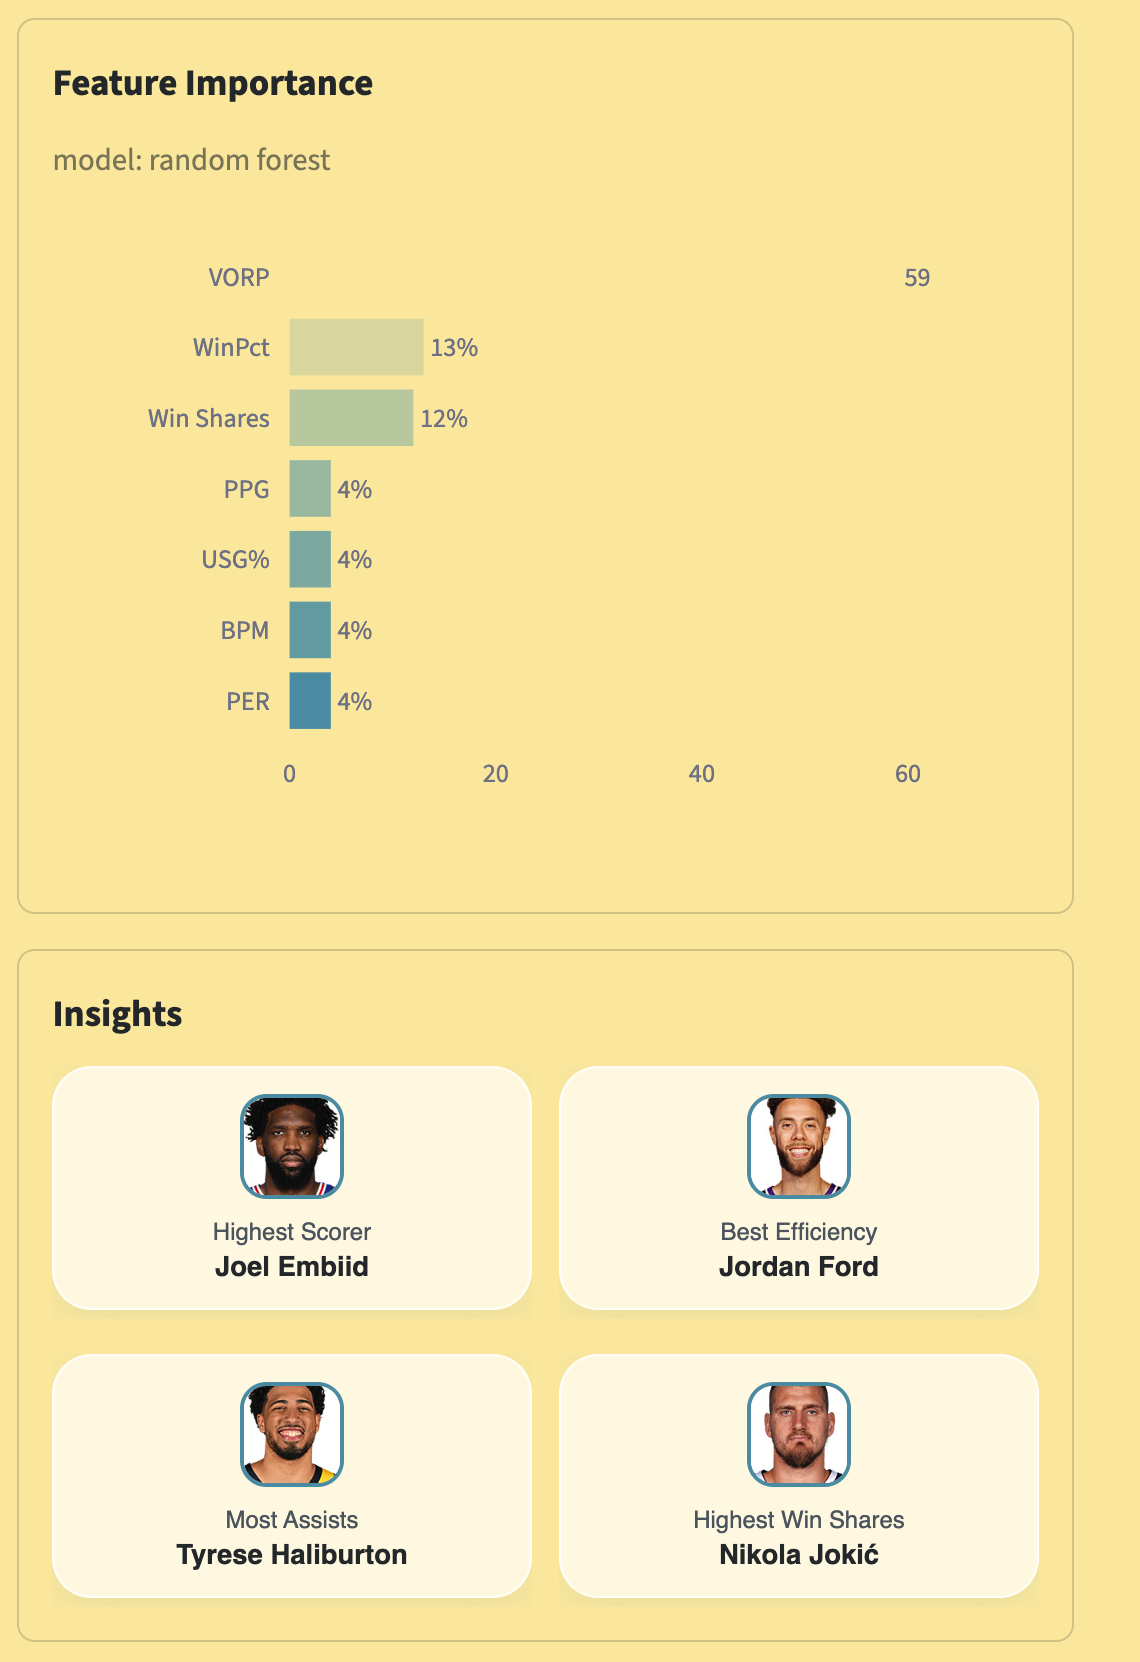
bar chart of feature importance and insights
-
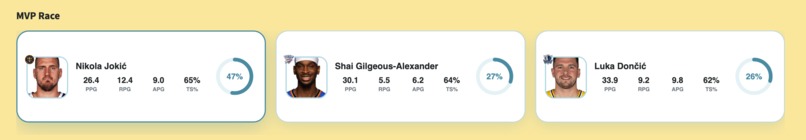
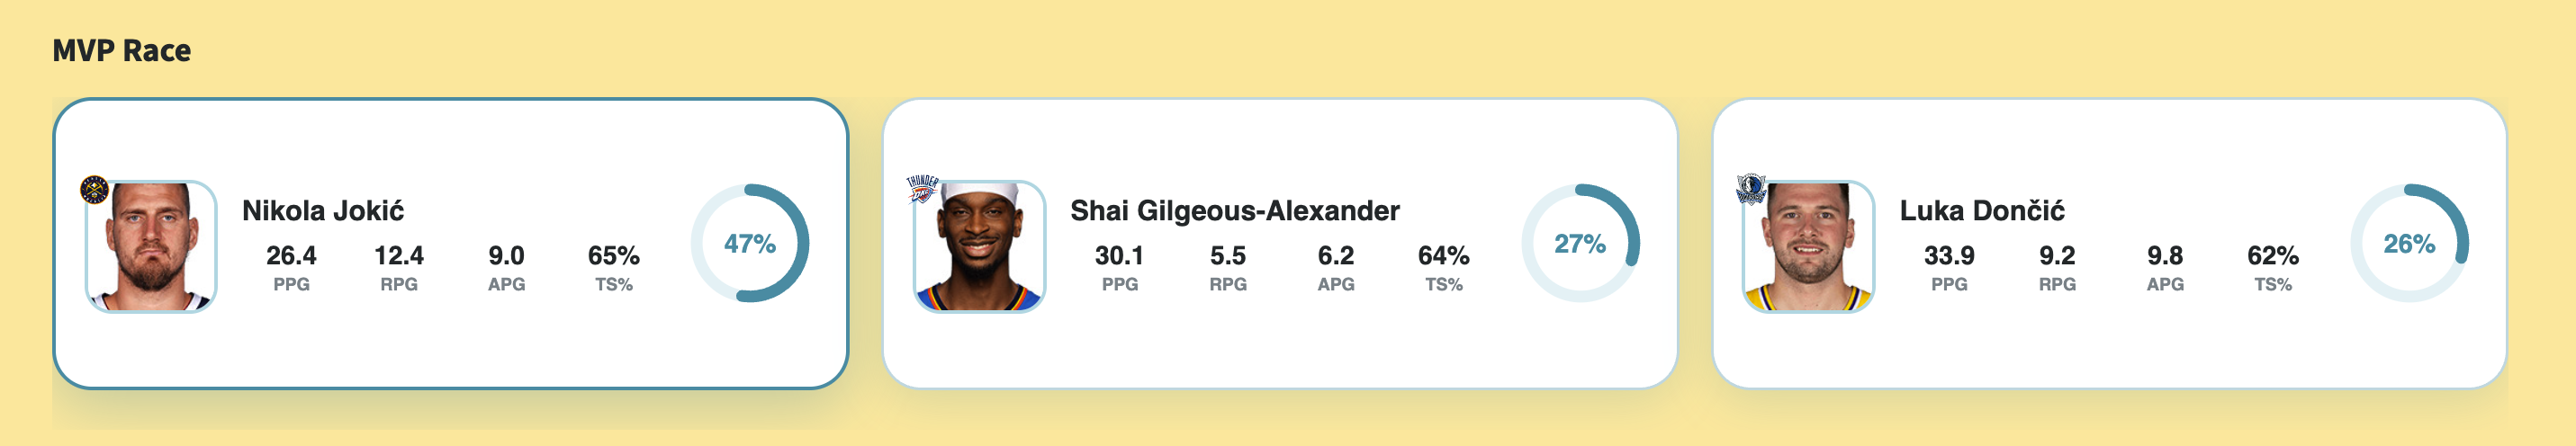
top 3 cards
Inspiration
Every NBA season, the MVP debate dominates sports media — but the arguments are usually based on narratives, not numbers. I wanted to see if we could use real player stats and past voting results to predict how much MVP support a player would get.
I'm still learning about basketball, so this project was also a way to understand what actually drives MVP voting: scoring, team success, advanced metrics, or something else entirely.
What it does
NBA MVP Predictor estimates MVP vote share (0–100%) for every qualified player in a season. The interactive dashboard shows:
- MVP Race — top 3 predicted candidates with key stats and probability rings
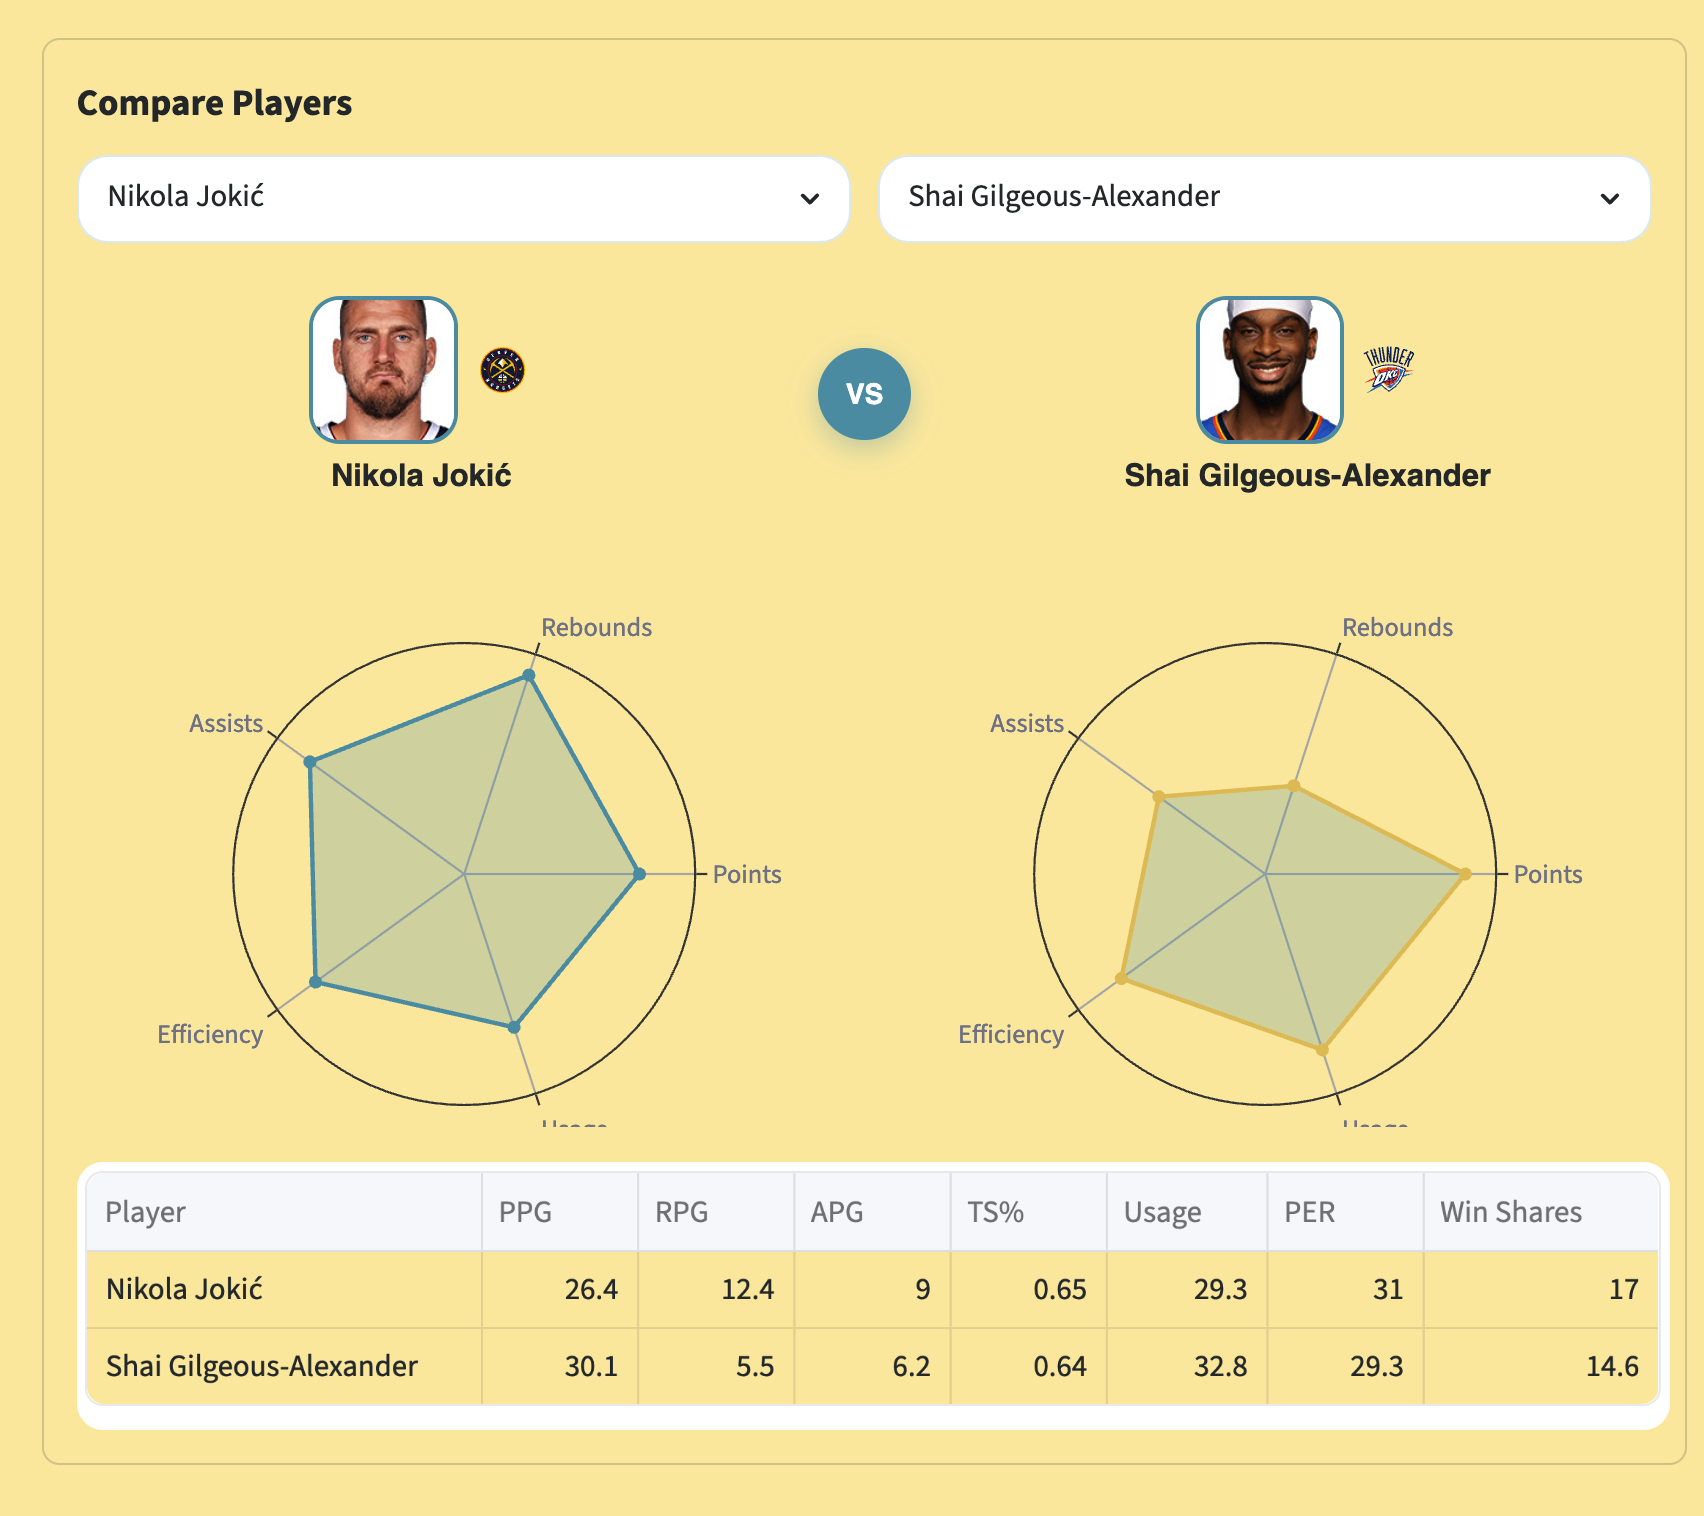
- Compare Players — side-by-side radar charts and stat tables
- Feature Importance — which stats the model weights most for MVP voting
- Insights — season leaders in scoring, efficiency, assists, and win shares
Pick any season from 2001–2024 and explore the race with data instead of hot takes.
How we built it
1. Data pipeline (data_loader.py)
We scraped Basketball Reference for 24 seasons of:
- Per-game and advanced player stats (PER, BPM, VORP, win shares, etc.)
- Team win percentage
- Historical MVP vote share (our training target)
Data is cached locally so the dashboard loads fast after the first run.
2. Model (train_model.py)
We framed MVP prediction as regression on vote share, not a simple yes/no classification — because MVP voting is a spectrum (e.g. Jokic 76%, Embiid 24% in 2023).
We compared 4 models with season-by-season cross-validation (train on past years, test on the next) to avoid leaking future data:
| Model | Approach |
|---|---|
| Linear Regression | Baseline |
| Ridge | Regularized linear |
| Random Forest | Ensemble trees |
| Gradient Boosting | Boosted trees |
Random forest won on holdout metrics (last 3 seasons):
- R² ≈ 0.80
- MAE ≈ 0.0035 on vote share
24 features feed the model — scoring, efficiency, playmaking, defense, and team win %.
3. Dashboard (app.py)
Built with Streamlit and Plotly. Custom HTML/CSS for MVP cards (player photos, stat rows, probability rings) using the project's cream (#FFEBAF) and teal (#4C9CB0) palette.
What we learned
- Team success matters — win percentage and win shares are among the strongest predictors
- Advanced stats add signal — VORP, BPM, and PER capture value beyond raw points
- Temporal validation is essential — random train/test splits would overstate accuracy; season-by-season CV is more realistic
- Scraping real data is harder than modeling — Basketball Reference table formats changed across eras (division vs conference standings), which required extra handling
Challenges
- Web scraping edge cases — older seasons use different HTML table IDs; we had to handle both formats
- Subjective target variable — MVP voting isn't purely stat-driven, so the model can't be perfect (and that's part of the story)
- Dashboard layout — Streamlit's default columns cramped the MVP cards; we switched to custom HTML components for a cleaner layout
- First-time NBA learner — translating stats like TS%, eFG%, and VORP into something meaningful for the UI took research
What's next
- Live season updates as new data becomes available
- Extend the pipeline to other awards (DPOY, MIP, All-NBA)
- Deploy the dashboard publicly on Streamlit Cloud
Built With
- numpy
- pandas
- plotly
- python
- scikit-learn
- streamlit

Log in or sign up for Devpost to join the conversation.