Inspiration
The inspiration for this project came from the recent NBA Finals.
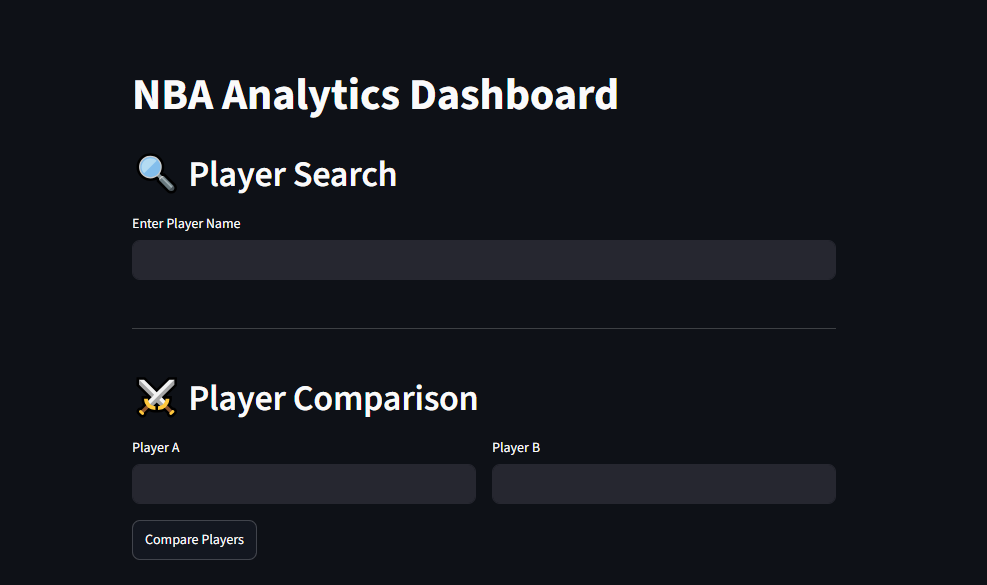
What it does
This ETL Pipeline pulls NBA player data and loads it into a dashboard
How I built it
This project was built using Python, Plotly, Pandas, PySpark, and Streamlit
Challenges we ran into
My challenge was finding a free data source. Luckily, the NBA api package is available for Python with the most recent season's data.
Accomplishments that we're proud of
This was my first project using PySpark, and I am happy with the results
What we learned
I learned how to create visualizations using plotly
What's next for NBA Data Pipeline Visualization
Hopefully deployment!


Log in or sign up for Devpost to join the conversation.