-
-
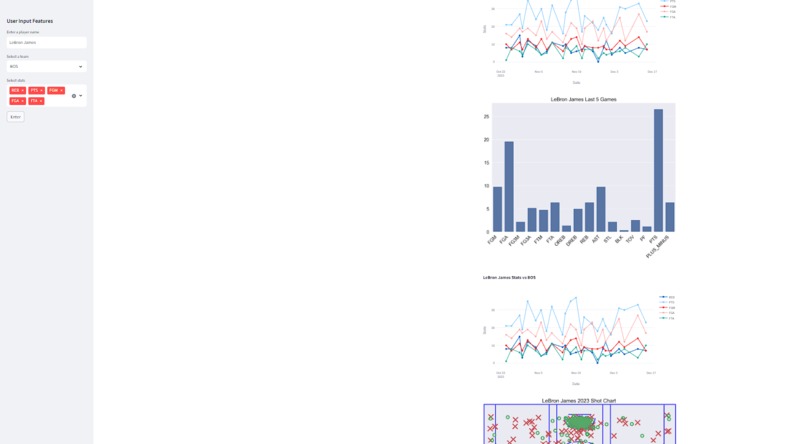
zoomed-out picture of analysis for lebron against the celtics

Inspiration
The inspiration behind creating this interactive web application was to revolutionize the sports betting experience by providing users with a dynamic and visually engaging platform. Instead of relying on generic machine-generated predictions, we aimed to empower users to create their own insights by exploring NBA player statistics in a personalized and interactive manner. The idea was to make the process of decision-making more enjoyable and unique, allowing users to craft their betting strategies based on their own interpretations of player performance data.
What it does
The interactive web application allows users to input an NBA player's name and a rival team, generating visualizations that showcase the player's recent performance trends. By selecting specific statistical categories like points, rebounds, blocks, etc., users can gain a comprehensive understanding of the player's gameplay. The app utilizes NBA API data to provide real-time and accurate insights, enabling users to make informed decisions when placing bets. Visualizations include line plots, bar charts, shot charts, and comparison line plots, offering a holistic view of the player's statistics.
How we built it
The development of this project involved the integration of the NBA API, Pandas, Matplotlib, Seaborn, and Plotly. Using the Streamlit framework in Python, we created a practical data visualization web application. The application fetches data from the NBA API, processes it using Pandas, and leverages Matplotlib, Seaborn, and Plotly to generate interactive and visually appealing charts. The user interface is designed to be intuitive, allowing users to explore and interpret NBA player statistics effortlessly.
Challenges we ran into
Throughout the development process, we encountered challenges related to data availability and visualization techniques. Selecting the right statistics was a hurdle, as some of the initially considered ideas had to be abandoned due to limitations in the data provided by the NBA API. Additionally, certain data visualizations and manipulations proved to be unnecessary or fell short of delivering meaningful insights. Adapting to these challenges required us to iterate on our approach and find creative solutions to ensure the application's functionality and user experience met our standards.
Accomplishments that we're proud of
We take pride in overcoming the challenges associated with data limitations and visualization complexities. The application now stands as a user-friendly, dynamic tool that empowers sports enthusiasts to analyze NBA player statistics and make informed betting decisions. The combination of real-time data, interactive visualizations, and user customization options sets this project apart as a valuable resource for gaining a competitive edge in sports betting.
What we learned
This project provided valuable lessons in navigating the complexities of sports data APIs, data visualization, and user interface design. It reinforced the importance of adaptability in the face of data limitations and the significance of user engagement in the development of sports analytics applications. Through this experience, we deepened our understanding of Python libraries and frameworks, honing our skills in creating practical and visually appealing data-driven applications.
What's next for Nba Betting Insights and Visualizations.
Moving forward, we aim to enhance the application by incorporating user feedback and expanding the range of available statistics. We plan to refine the user interface, optimize data visualization techniques, and explore additional features such as predictive analytics. Collaborations with experts in sports analytics and continuous updates to the application will ensure that Nba Betting Insights and Visualizations remains at the forefront of providing innovative and personalized tools for sports enthusiasts.

Log in or sign up for Devpost to join the conversation.