-
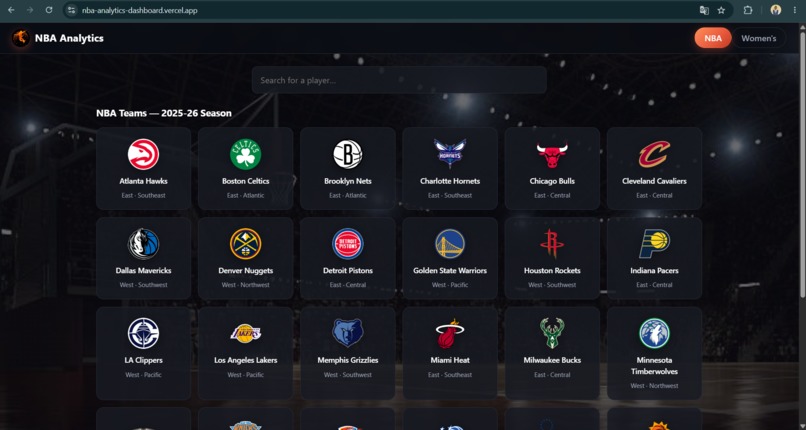
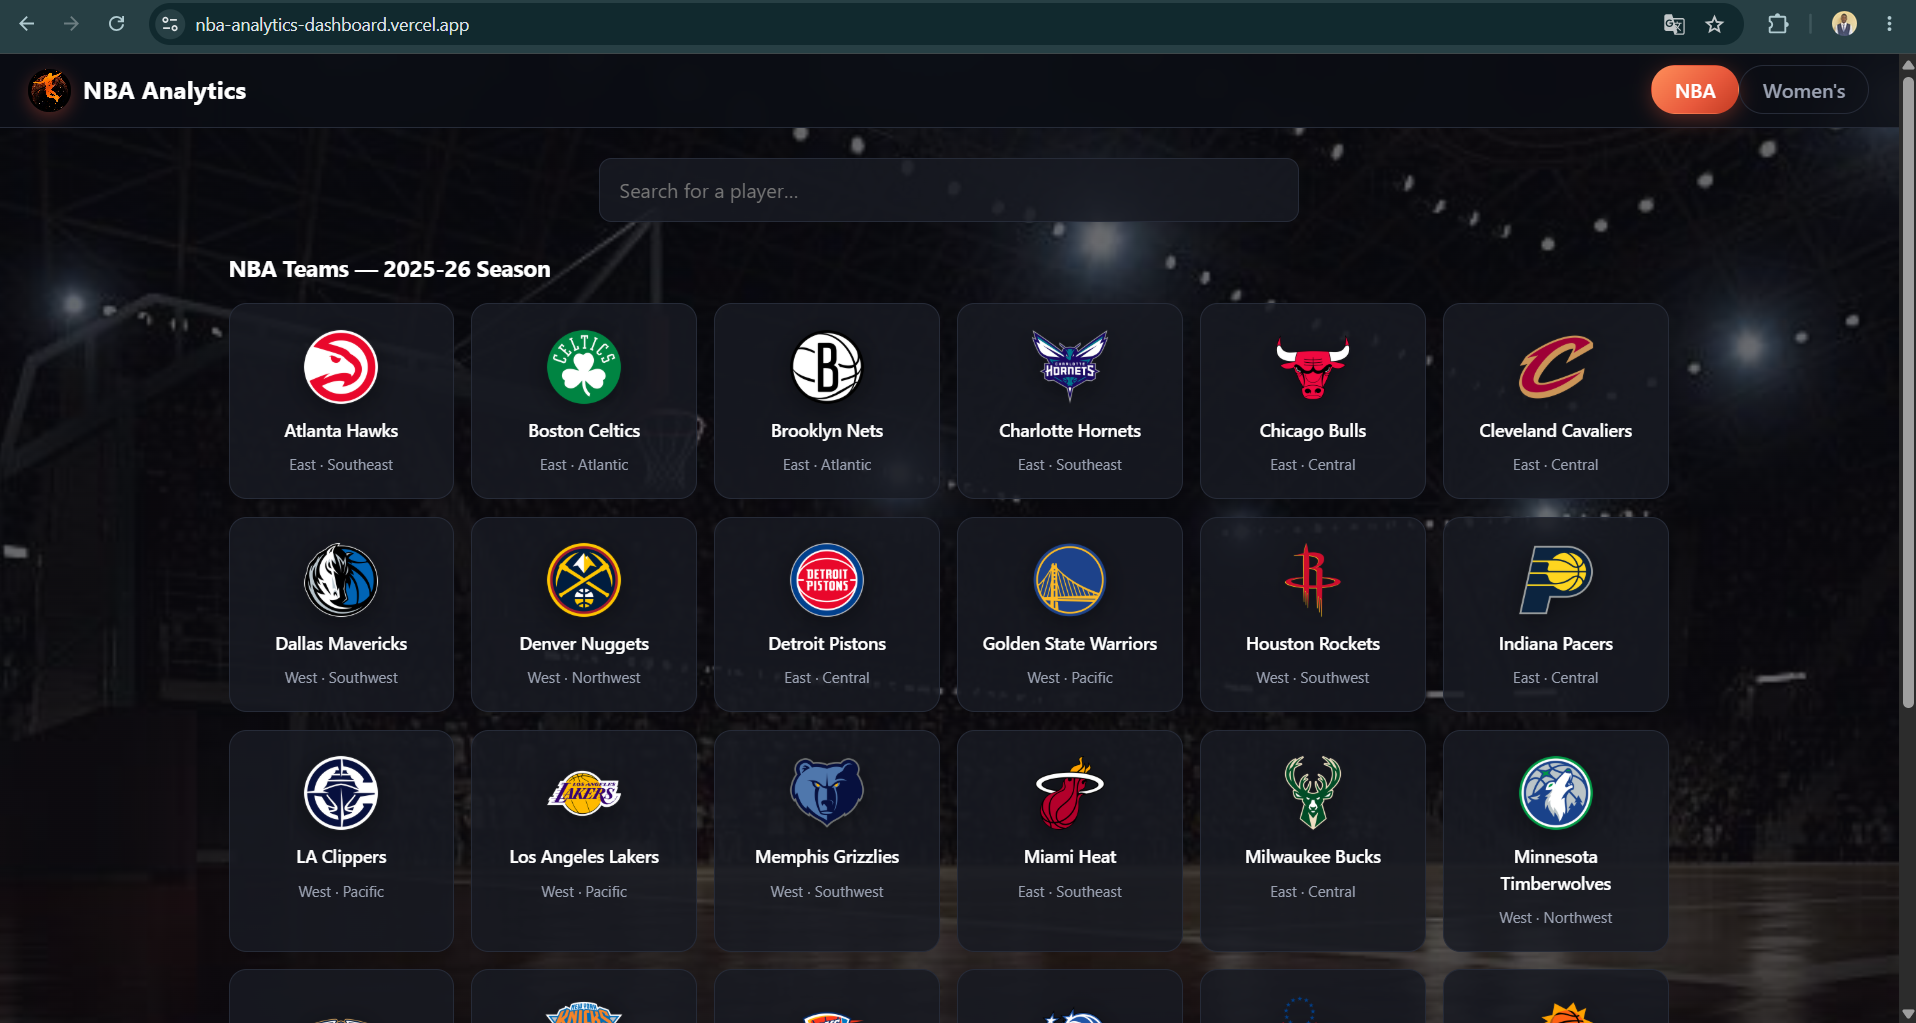
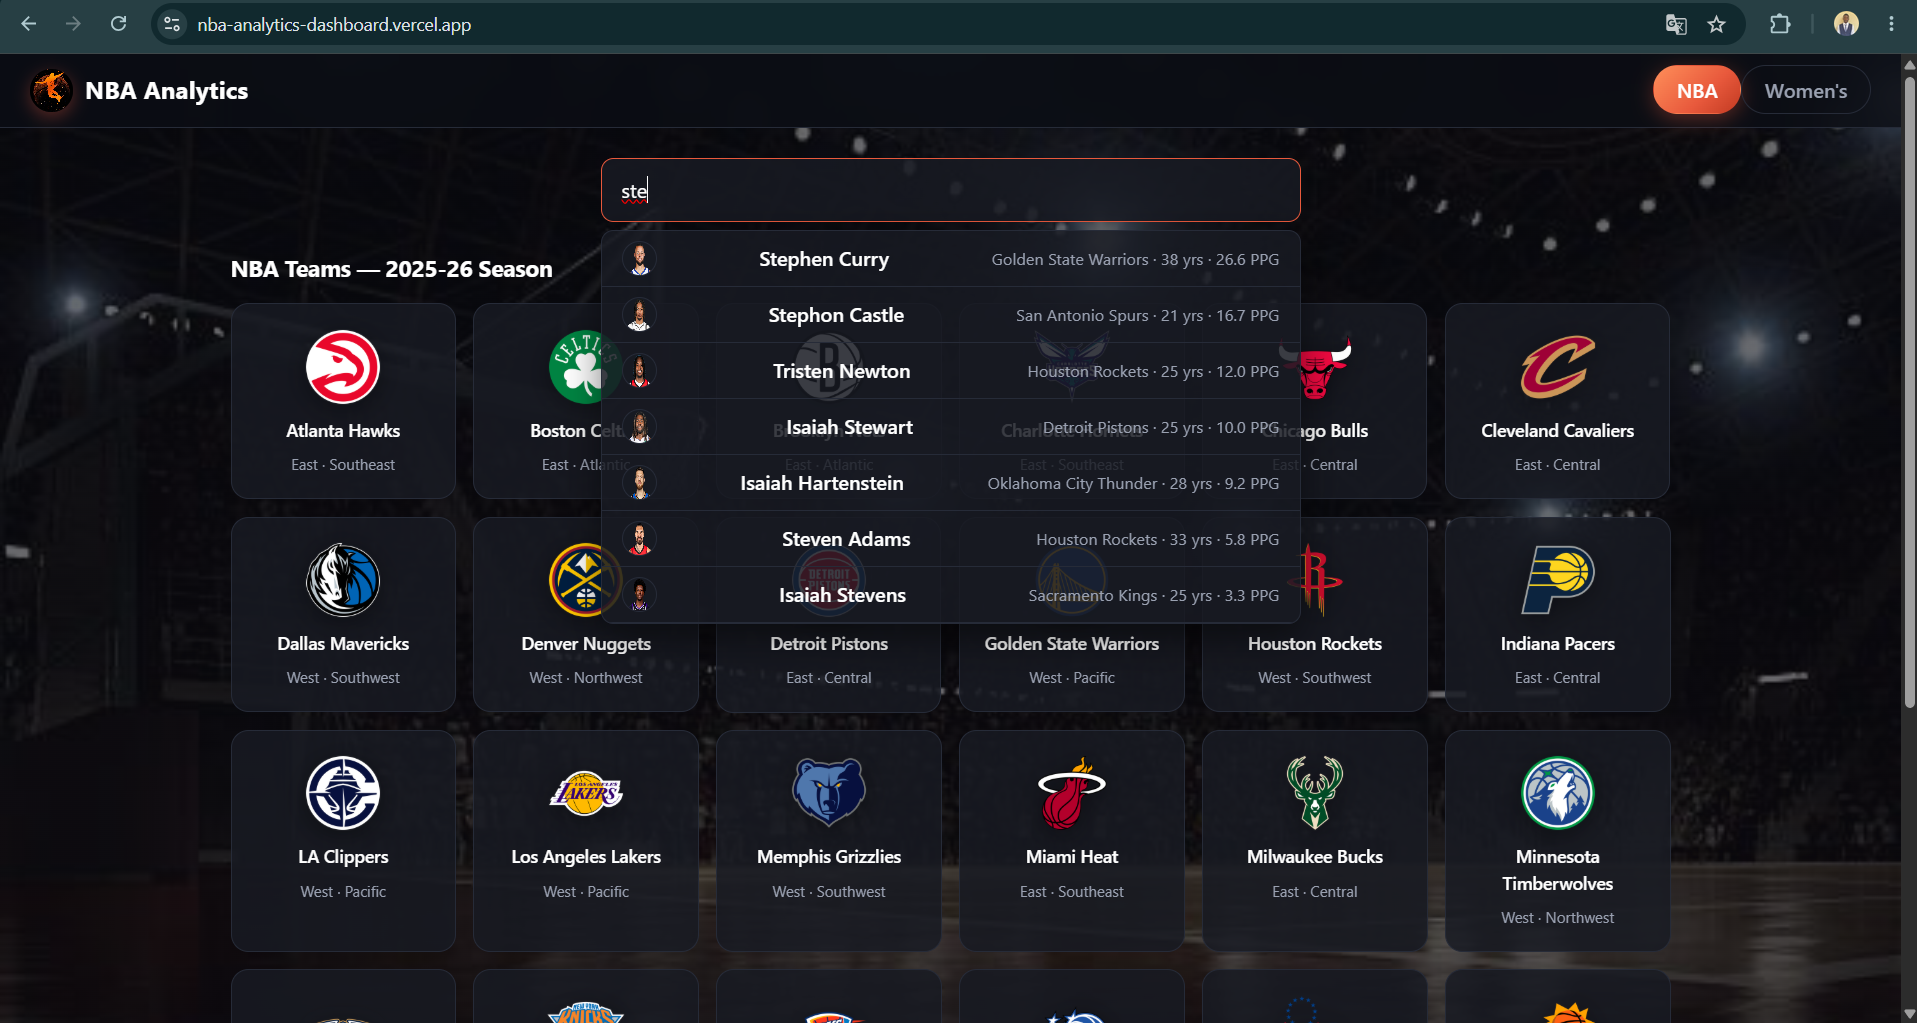
All 30 NBA teams at a glance logos, conferences and divisions on the home page.
-
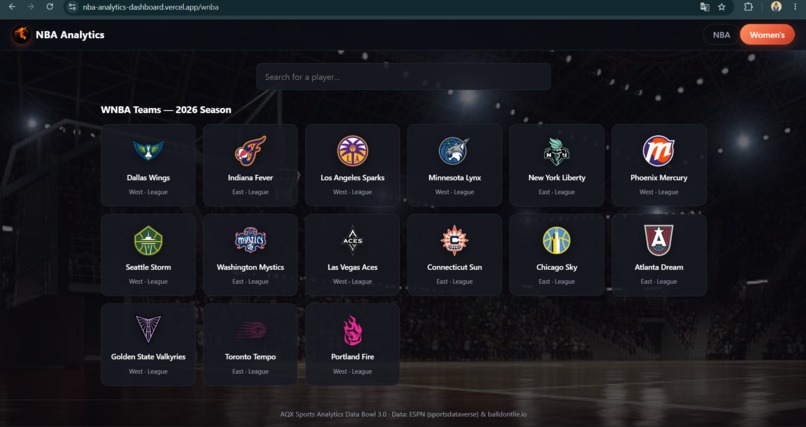
women's teams
-
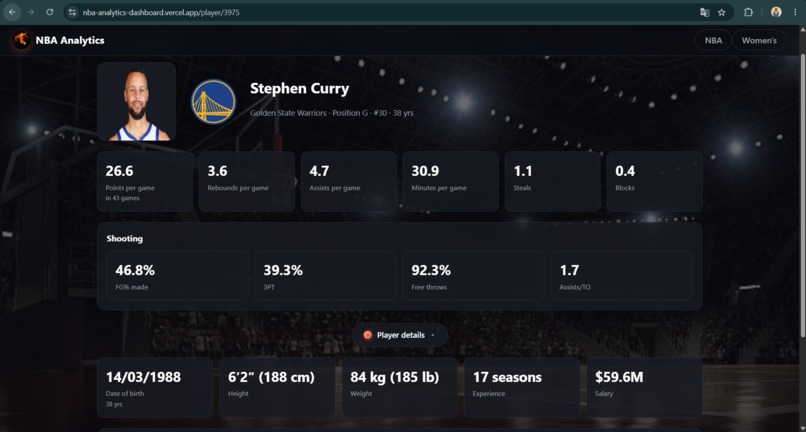
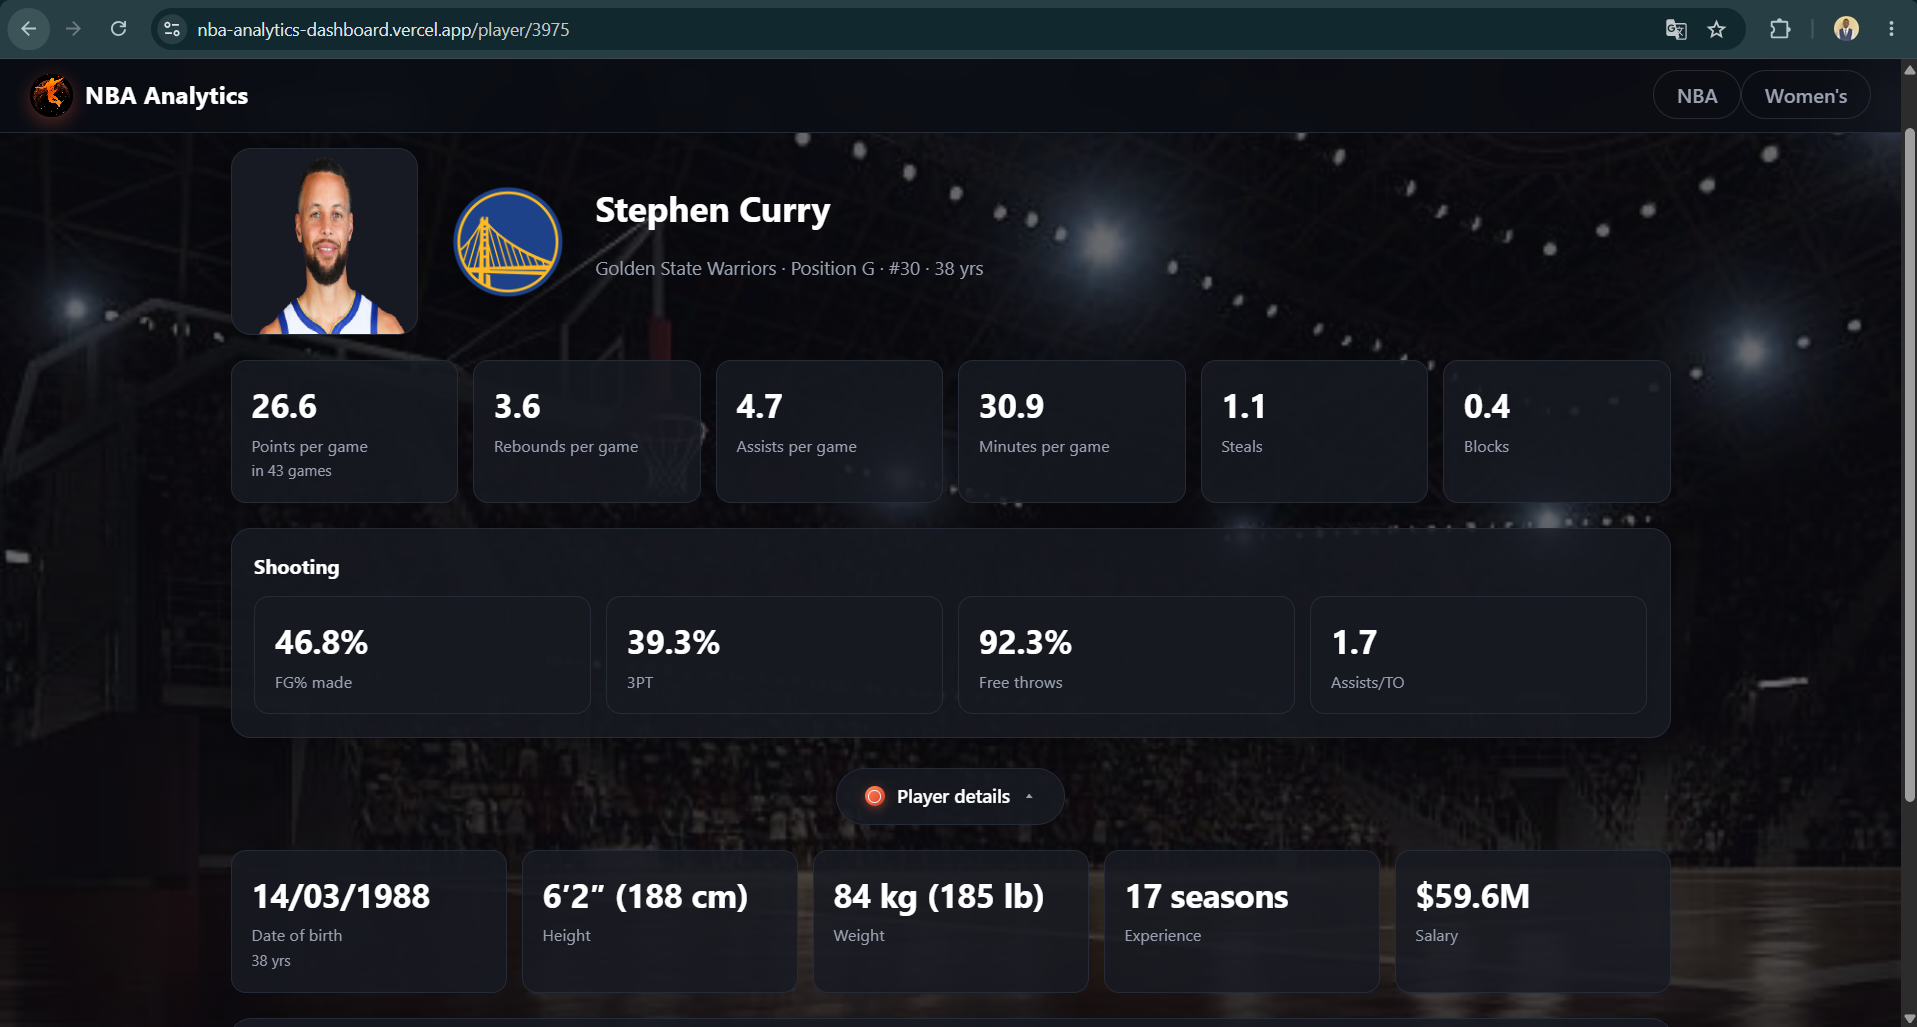
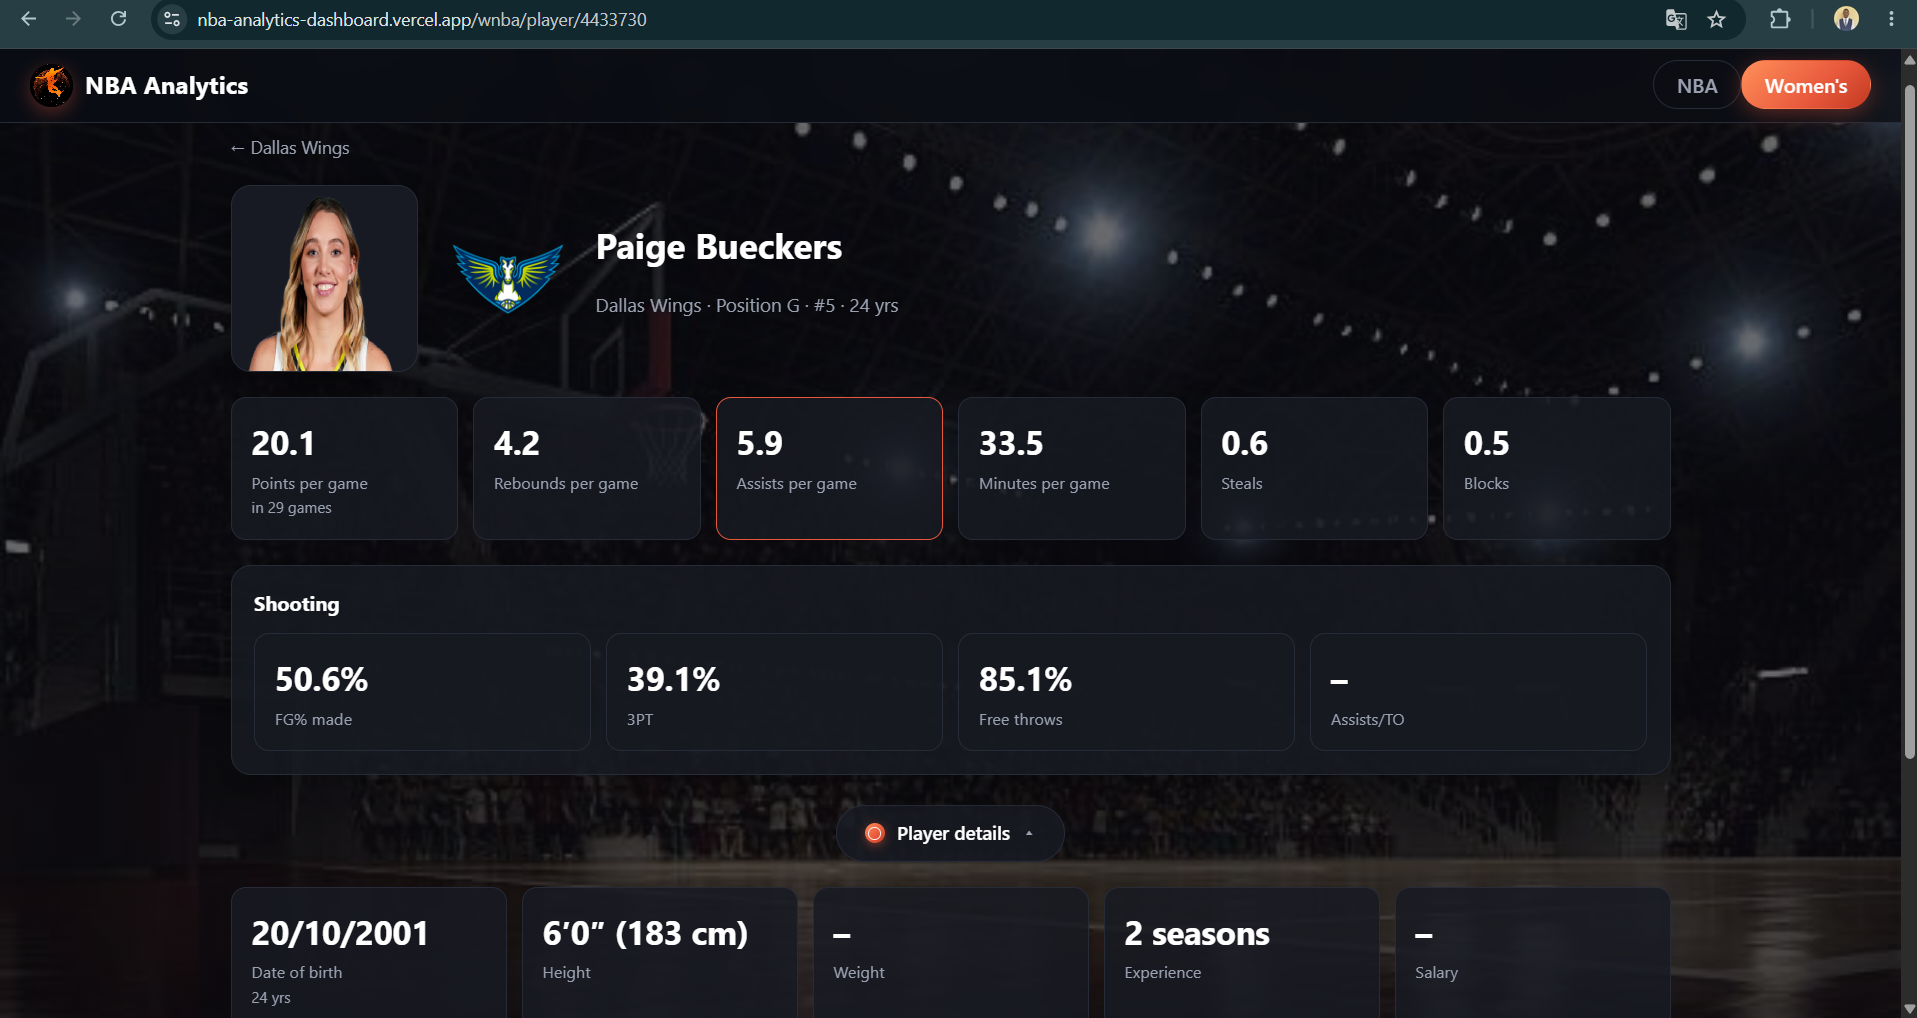
Shooting splits plus personal details — height, weight, age, experience and salary.
-
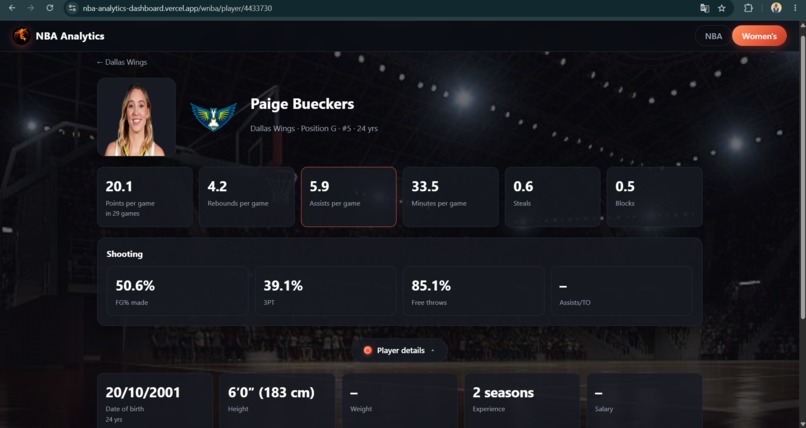
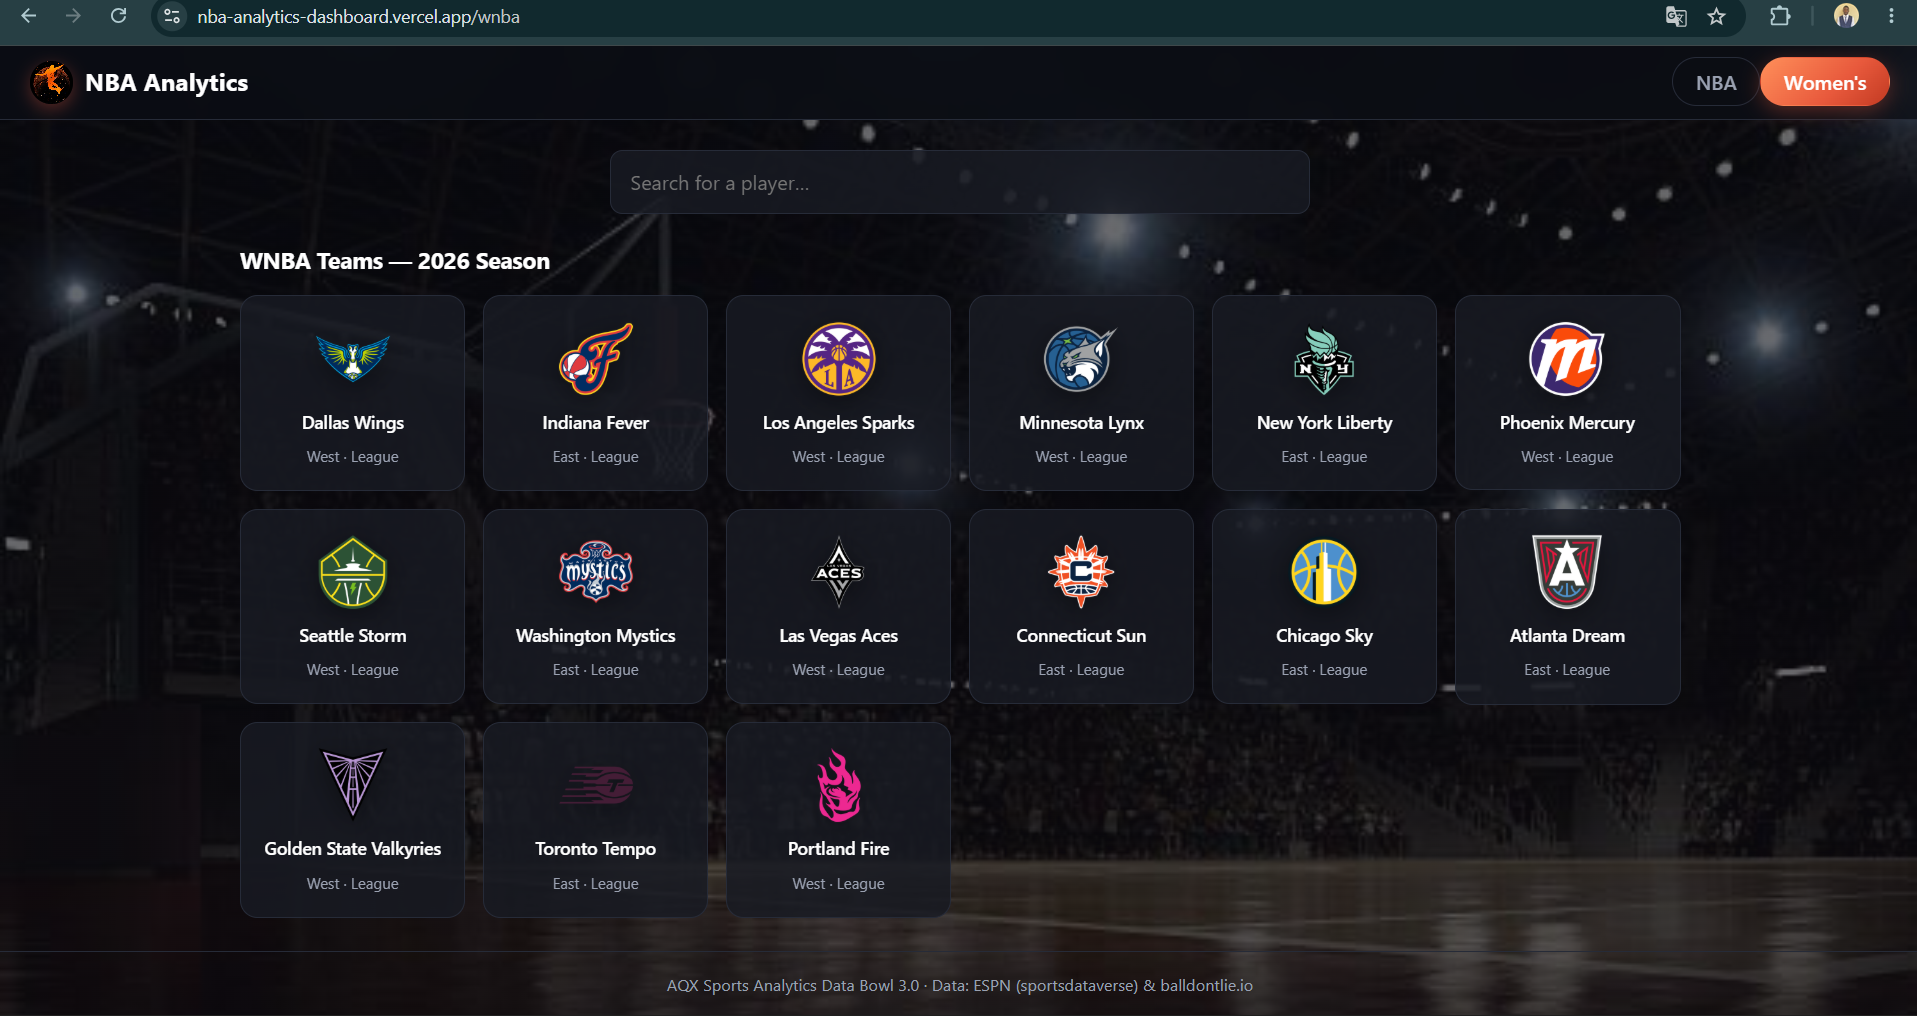
The same experience for the WNBA — standings, rosters and player stats.
-
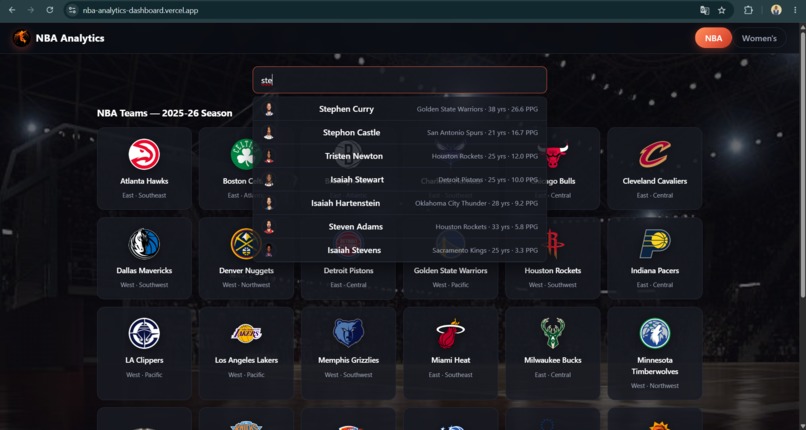
Search finds any player from both leagues instantly
Inspiration
Every year, tens of thousands of data points are produced by the NBA — box scores, shooting splits, streaks — but they're scattered across paywalled stats sites and developer-unfriendly APIs. We wanted to put the 2025-26 season in one place a coach, front-office person or fan could actually use in seconds: standings, rosters and player stats at a glance. The AQX Sports Analytics Data Bowl pushed us to build something practical and statically sound rather than just pretty — so we designed a dashboard that answers the three questions anyone asks first: where do we stand, who's on the roster, and what are the numbers?
What it does
A dashboard that answers the three questions a coach or front office asks first: where does each team stand, who's on the roster, and what are the numbers? It covers all 30 NBA teams and 12 WNBA teams. The home page shows a grid of every team with logos, plus a search bar that finds any player from both leagues. Click a team to see its conference ranking, win-loss record and full roster sorted by points scored. Click a player to get detailed stats — points, rebounds, assists, steals, blocks, shooting splits (FG/3PT/FT) — along with height, weight, age, experience and salary.
How we built it
- Frontend: React 19 + Vite + React Router, with a custom CSS design (no UI framework).
- Standings: computed live from the season's 1,200+ real games (W/L, PCT, streaks, point differential) in src/lib/standings.js.
- Data strategy — "snapshots": the free balldontlie.io plan is limited to 5 requests/min and doesn't expose player averages, so instead of calling APIs at runtime we run one-time fetch scripts that dump teams.json, games_2025.json and players_2026.json into the repo. The app reads static JSON: instant load, no rate limits, reliable for demos.
- Player data: ESPN season stats from the sportsdataverse/ESPN dataset (582 NBA players), merged with birthdate data.
- Logos & photos: ESPN CDN images (the official NBA CDN returns 403 when hotlinked).
- Both leagues, one codebase: a single LeagueProvider feeds NBA and WNBA through the same pages and routes.
Challenges we ran into
- Every "official" NBA data source (stats.nba.com, data.nba.net, api.nba.com, ESPN) is blocked by CORS or returns 403 from the browser — so we couldn't just call the league's own APIs.
- The free balldontlie.io API doesn't expose player averages or direct standings, and is rate-limited to 5 requests per minute.
- The official NBA CDN refuses hotlinked logos (403), so we switched to the ESPN CDN and aliased a few team abbreviations (e.g. NOP → NO).
- Some ESPN player photos don't resolve, so we built a graceful SVG fallback instead of leaving broken images.
- WNBA national teams kept leaking into the standings until we filtered them out.
Accomplishments that we're proud of
- We built a data pipeline that works around API restrictions instead of fighting them — the app loads almost instantly because it reads pre-computed snapshots.
- Both NBA and WNBA are fully covered from a single clean codebase: one LeagueProvider, one set of pages, one router — two leagues.
- A search that handles accented names correctly, so "A'ja Wilson" or "Victor Wembanyama" findable the way fans actually type them.
- Real standings computed from the actual 1,200+ games of the season, not hardcoded tables.
- A polished, responsive UI done in pure CSS — no UI framework needed.
What we learned
- How to design around API constraints instead of fighting them — a snapshot strategy beats live calls when demo reliability matters more than real-time freshness.
- That clean data presentation starts upstream: the time we invested in preprocessing and deduplicating the data is what makes the UI simple.
- How to share logic across leagues: by modeling NBA and WNBA through the same provider, we added a whole second league without duplicating pages.
- A little thing: even search needs care with accented characters and apostrophes to feel natural to real users.
What's next for nba-analytics-dashboard
- Predictive analytics: a win-probability model trained on the season's game-by-game data.
- Advanced metrics: add PER, TS% and on/off court impact to every player page.
- Player comparison tool: head-to-head stat comparison between any two players.
- Auto-refreshing data: a scheduled job that regenerates the snapshots daily so the dashboard stays current.
- WNBA parity: bring the same predictive features and advanced metrics to the women's side.
- Polish: dark/light themes, mobile-optimized tables and shareable player stat cards.
Built With
- api
- balldontlie.io
- css
- espn
- github
- html5
- javascript
- node.js
- npm
- react
- recharts
- rest
- router
- sportdataverse
- visual-studio
- vite


Log in or sign up for Devpost to join the conversation.