-
-
-
-
-
-
-
-
-

-
Logo
-
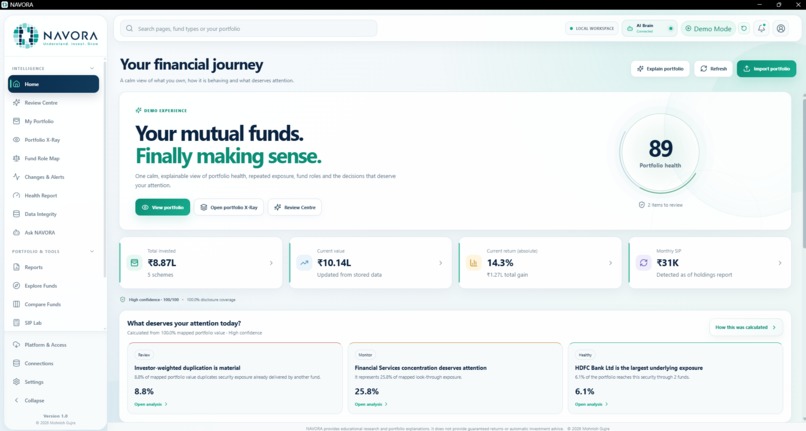
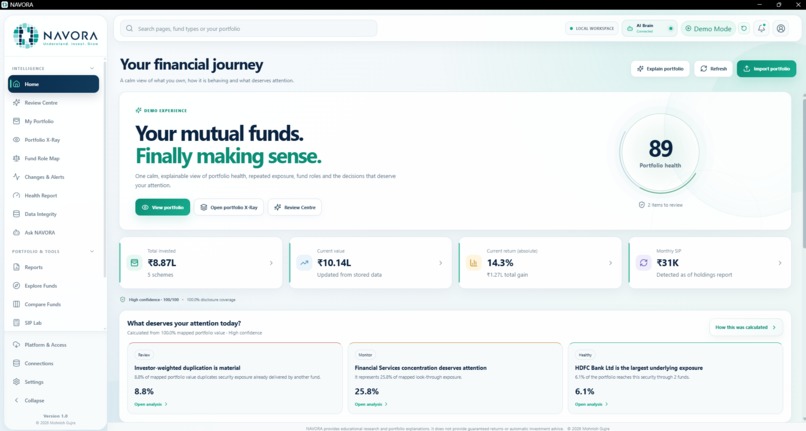
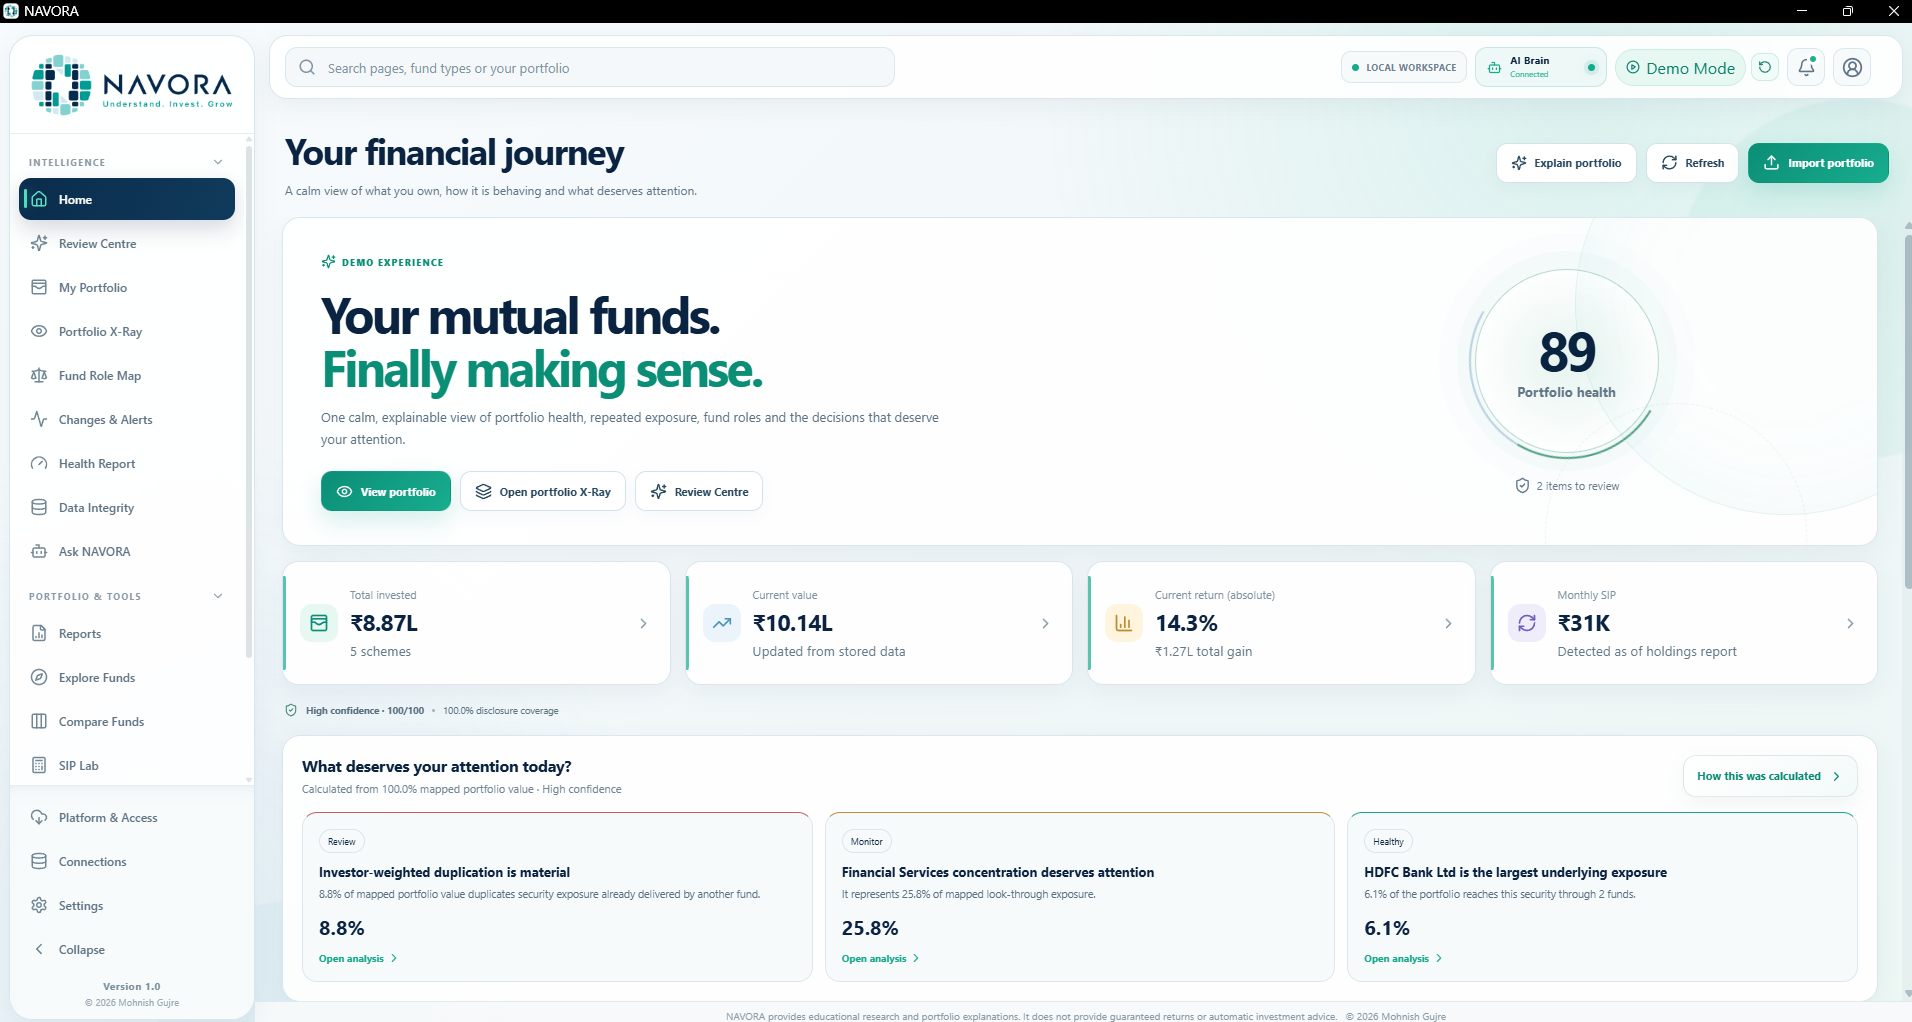
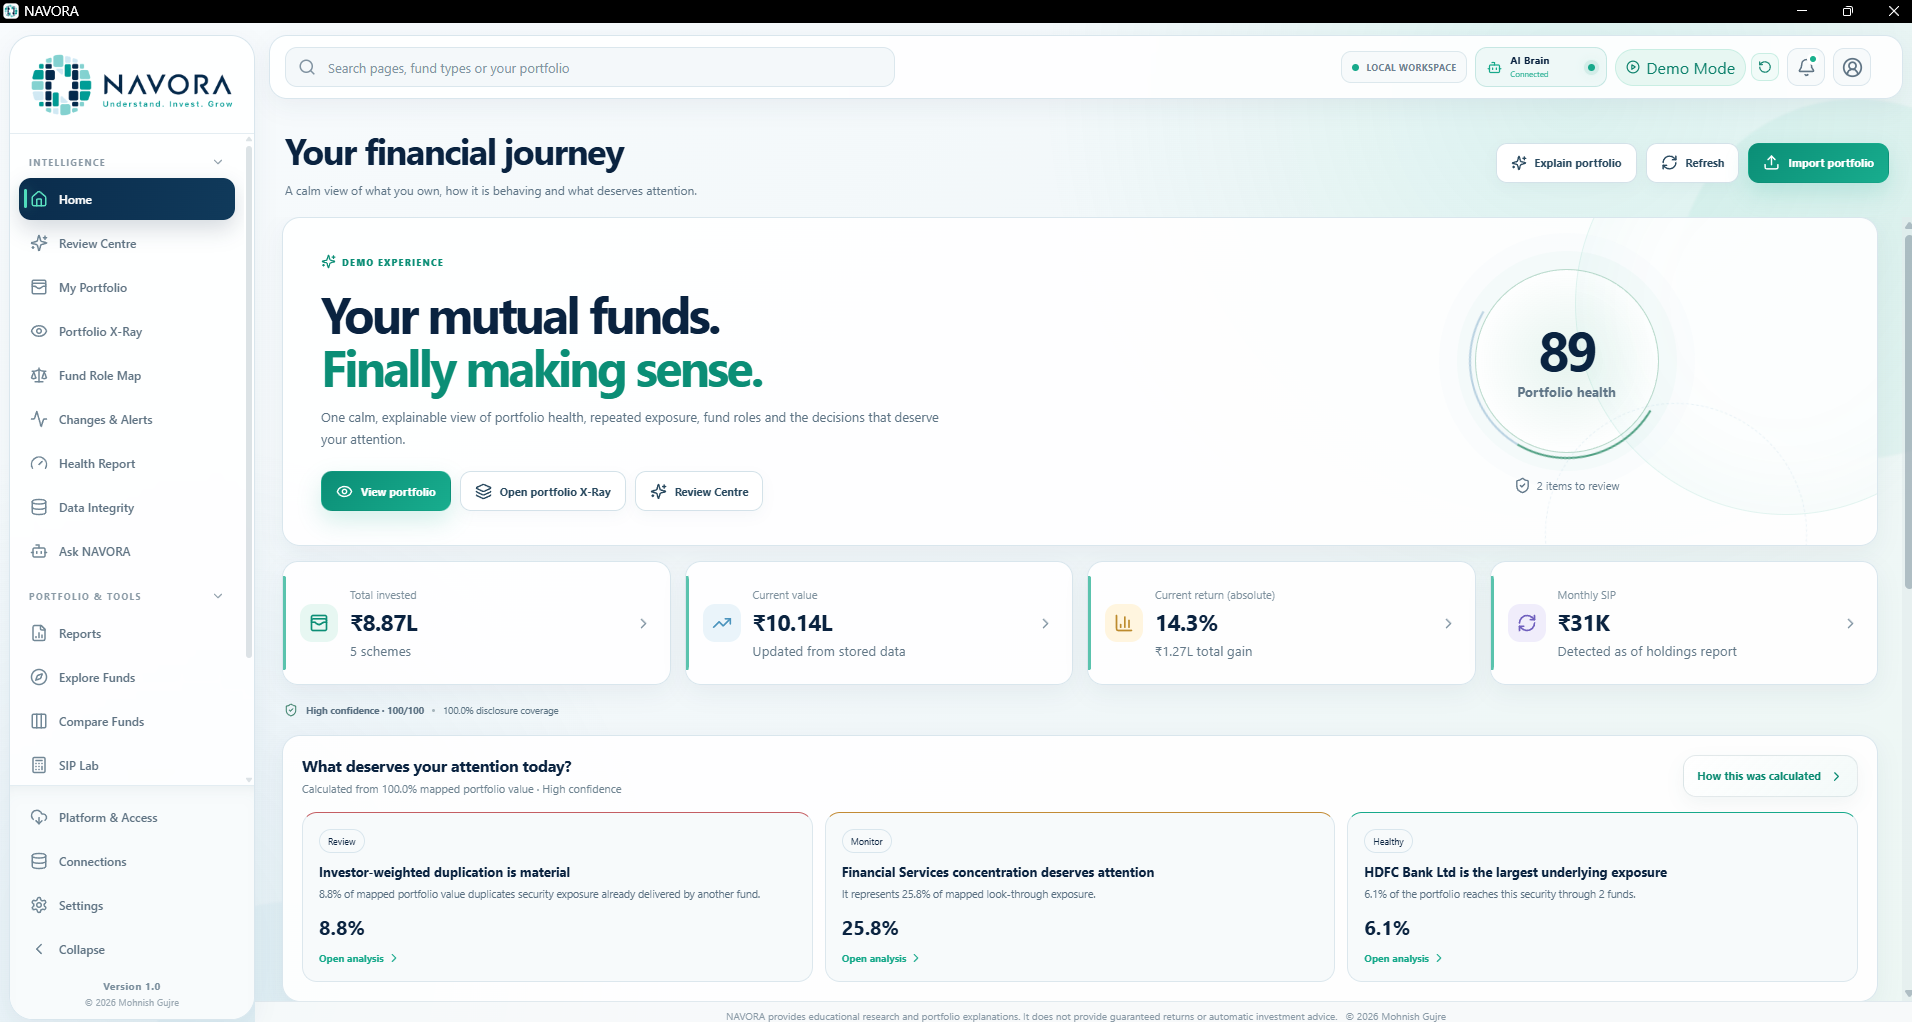
Home Page
-
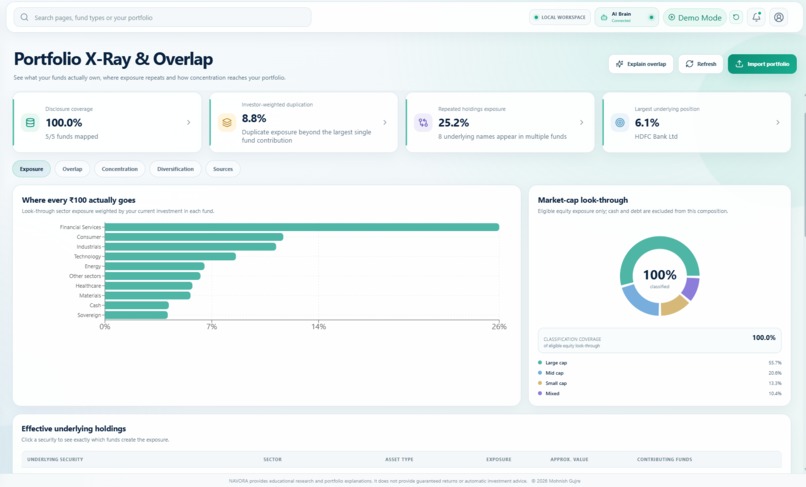
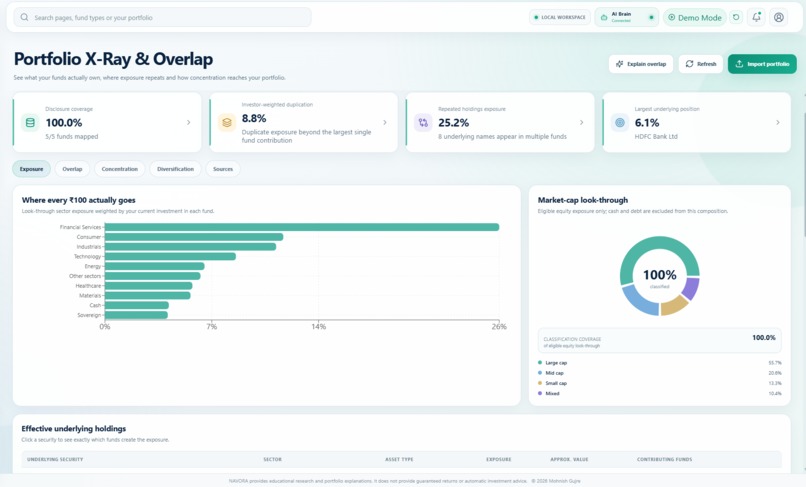
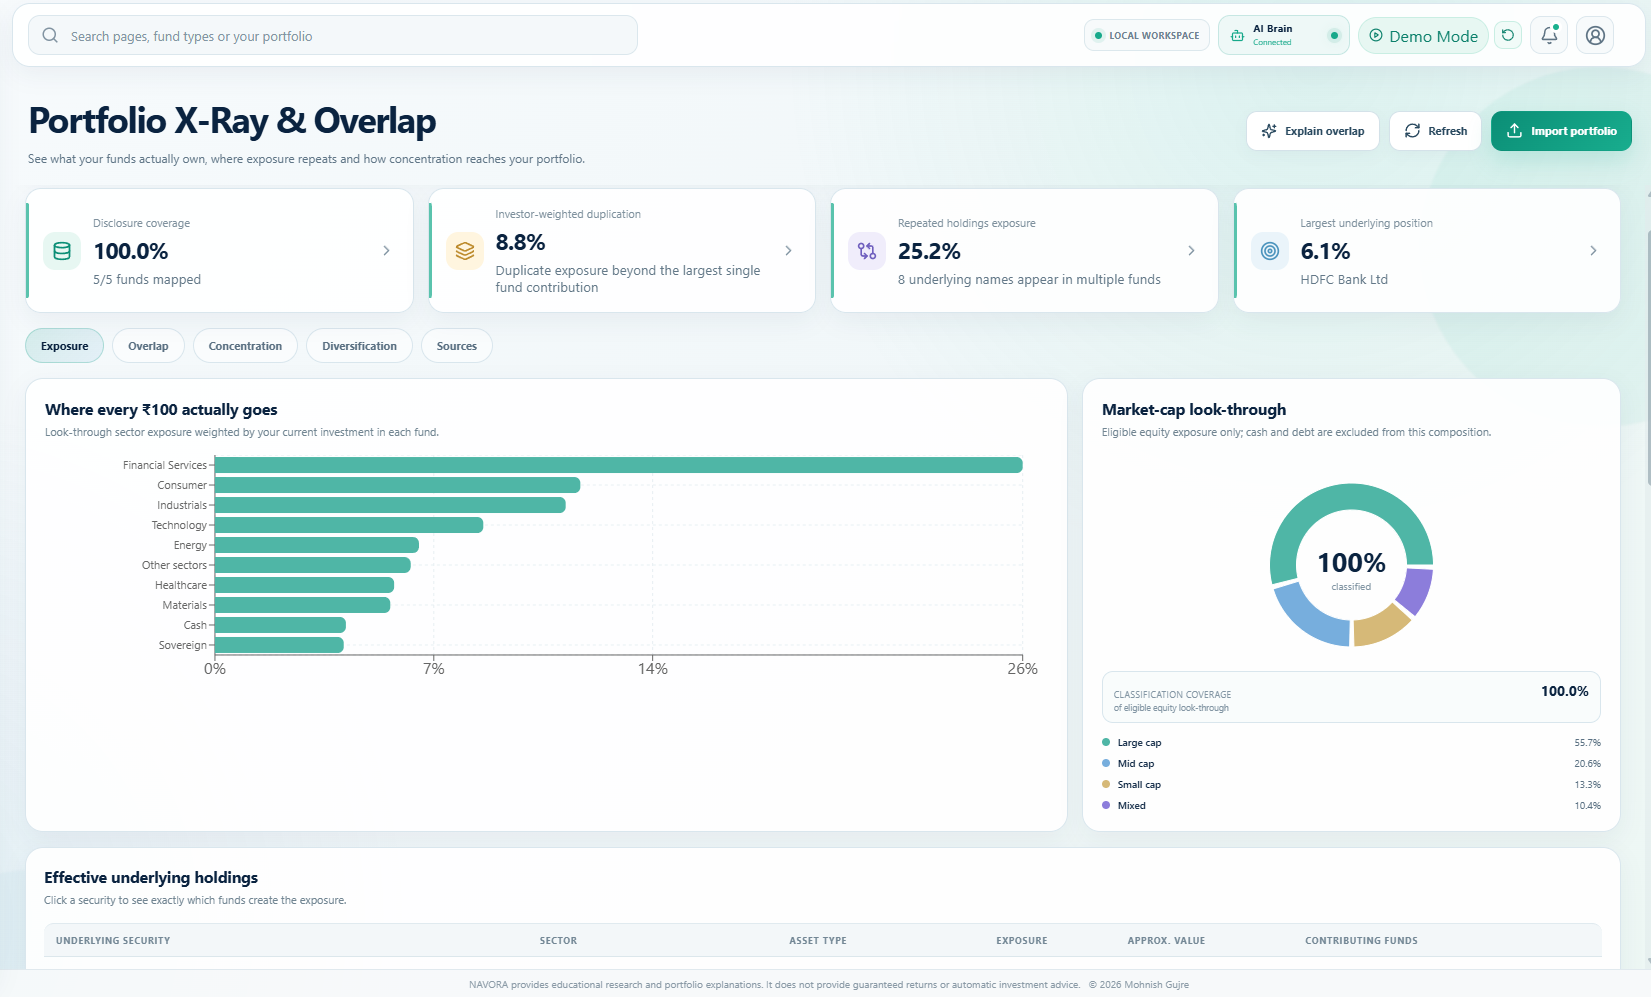
Portfolio X-Ray
-
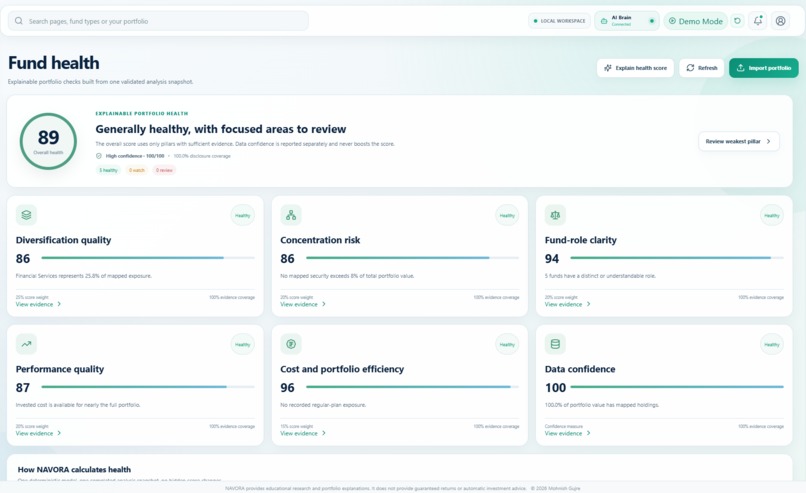
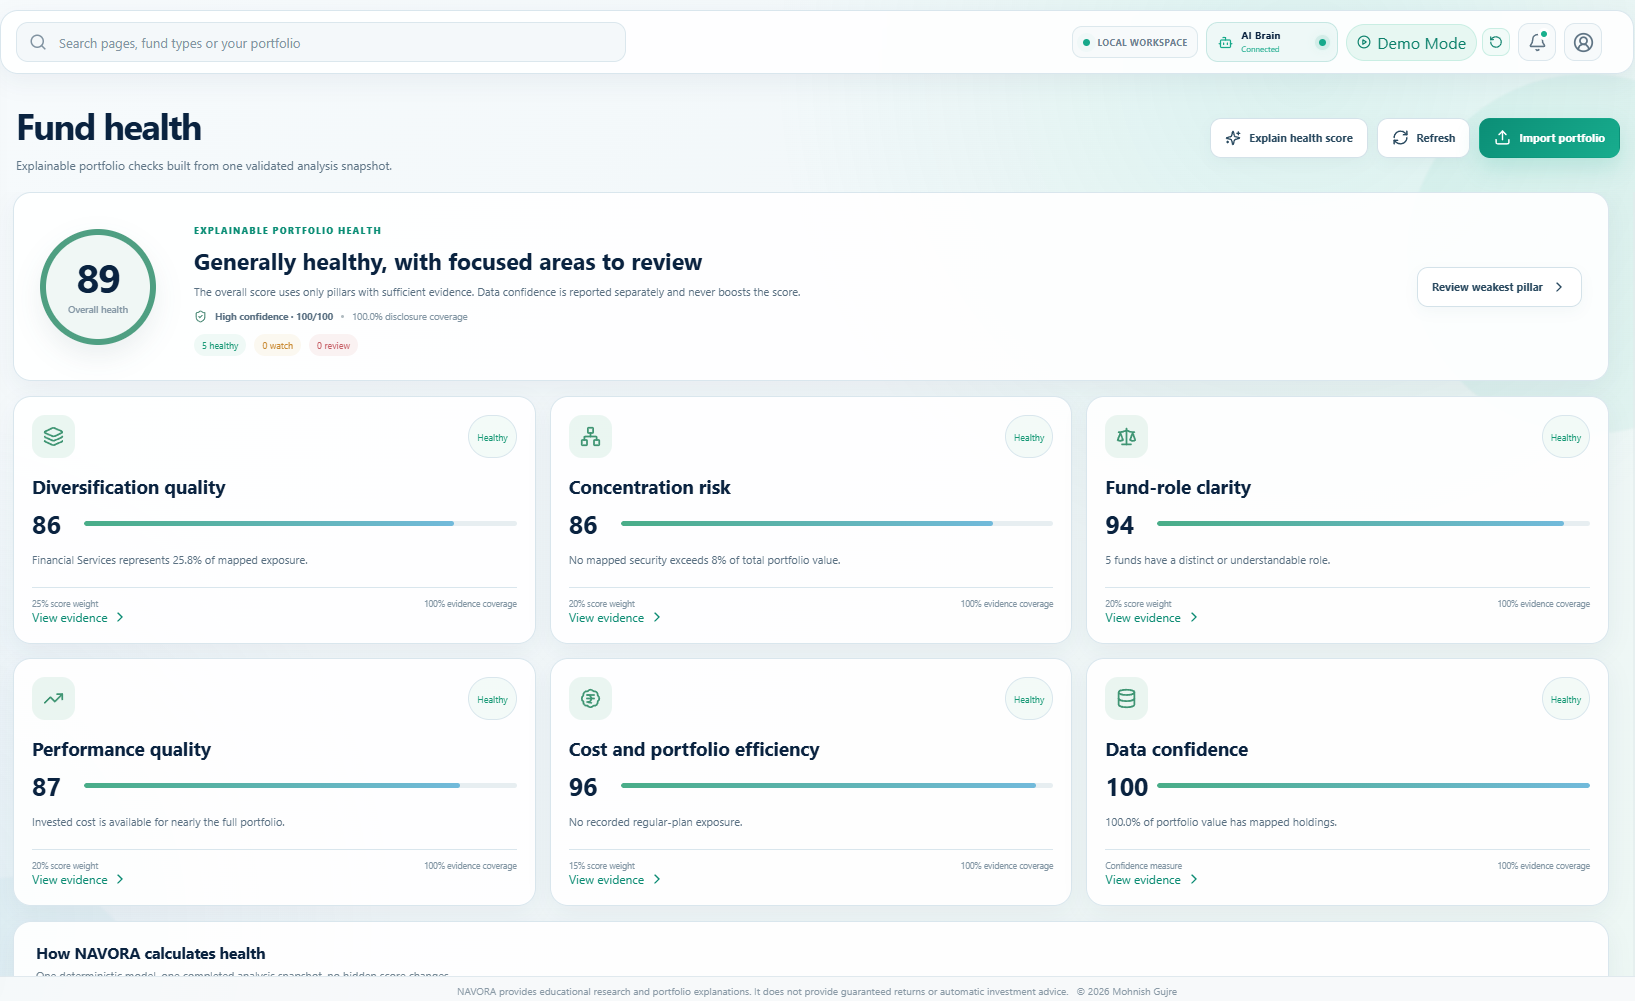
Fund Health
-
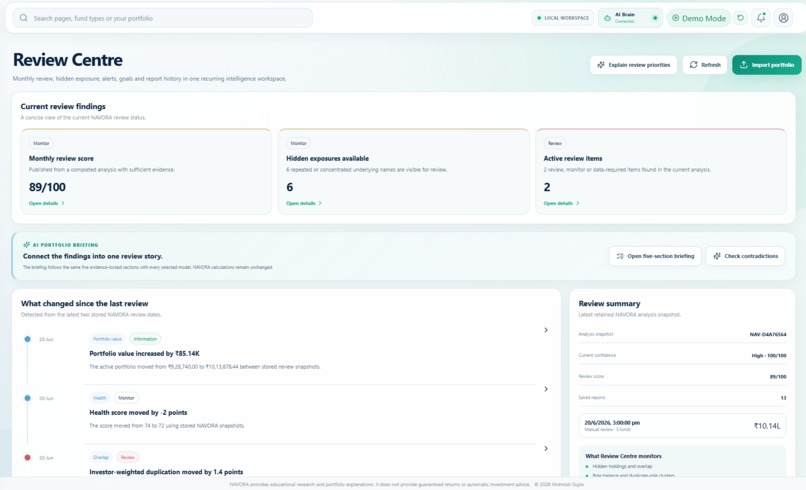
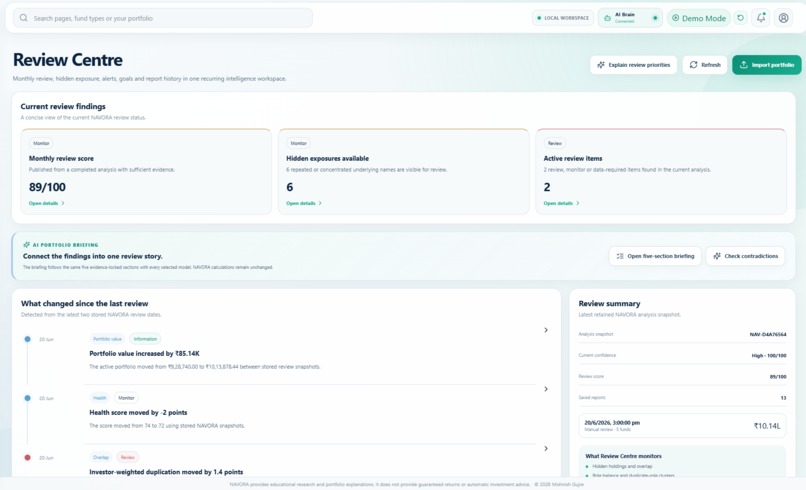
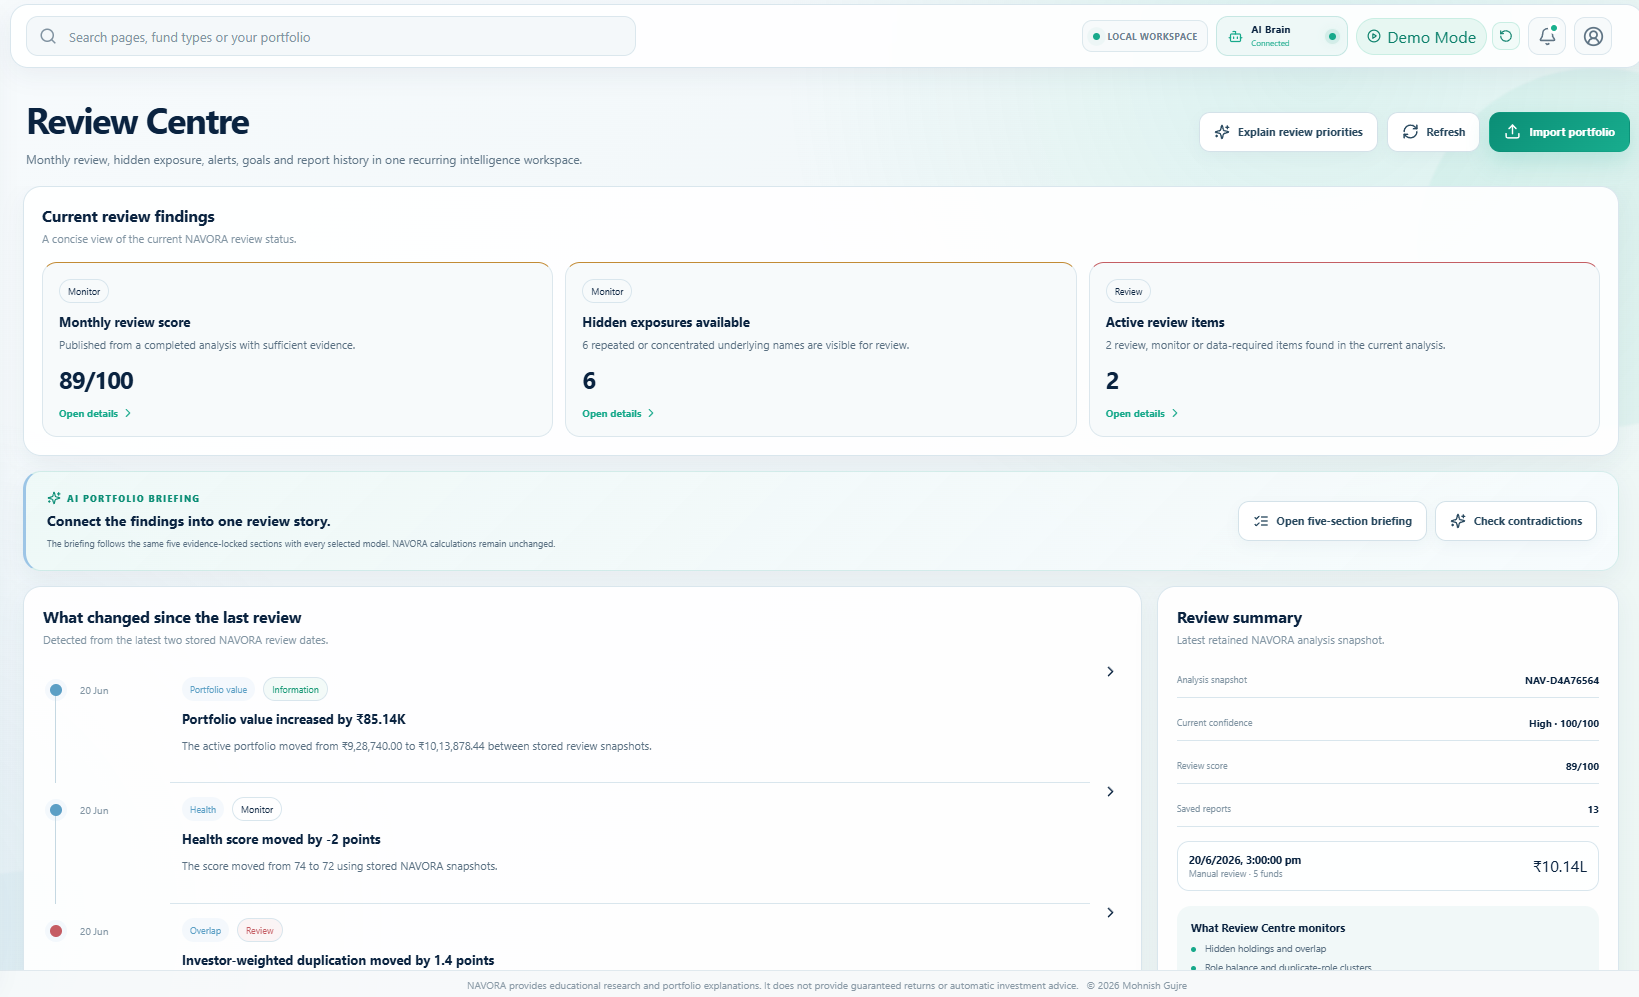
Review Center
-
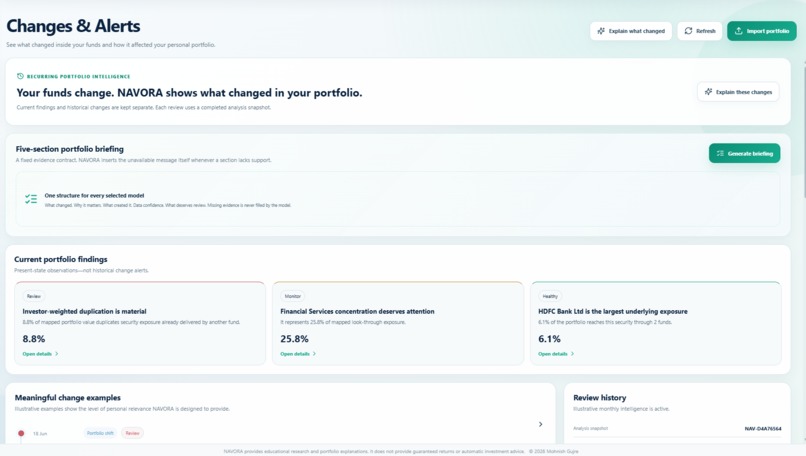
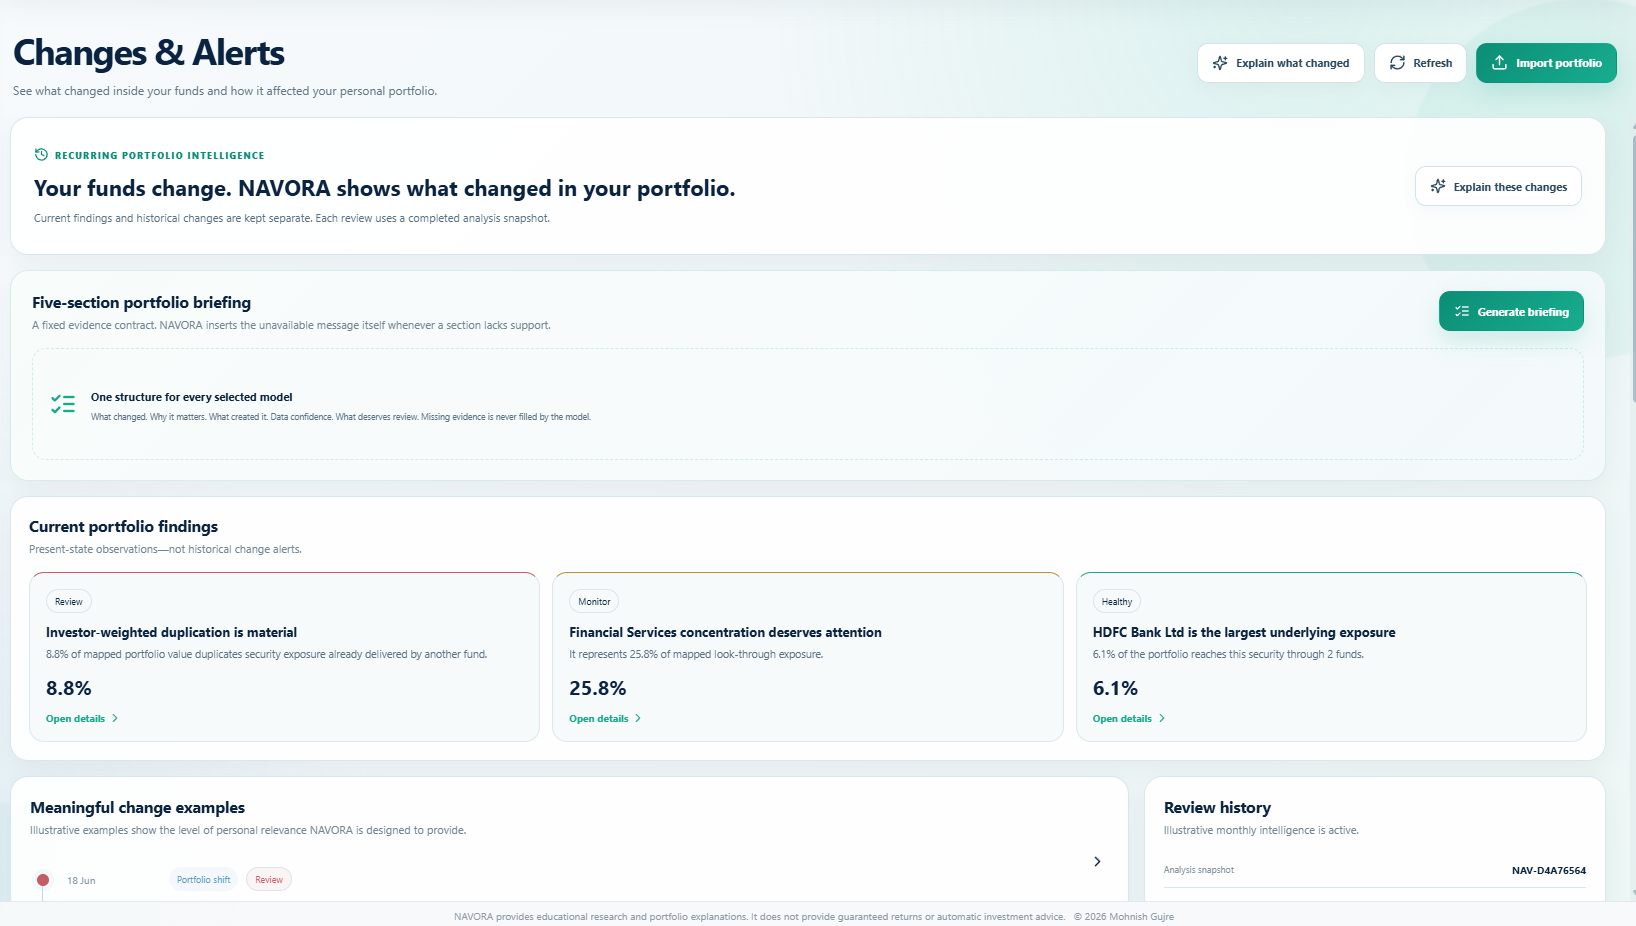
Changes & Alerts
-
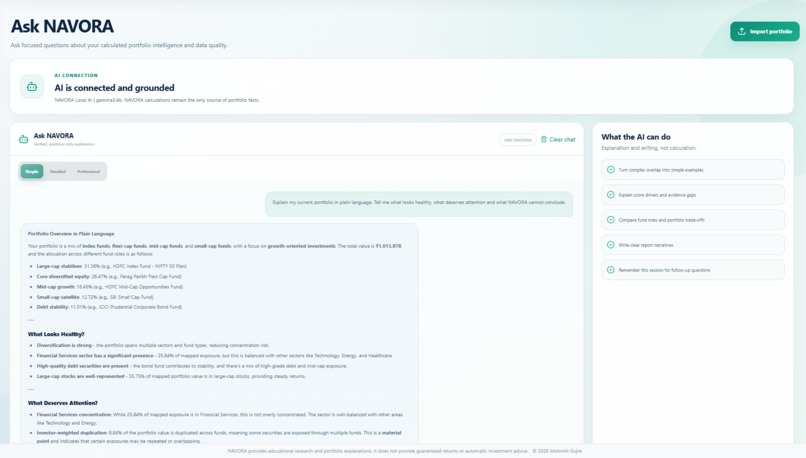
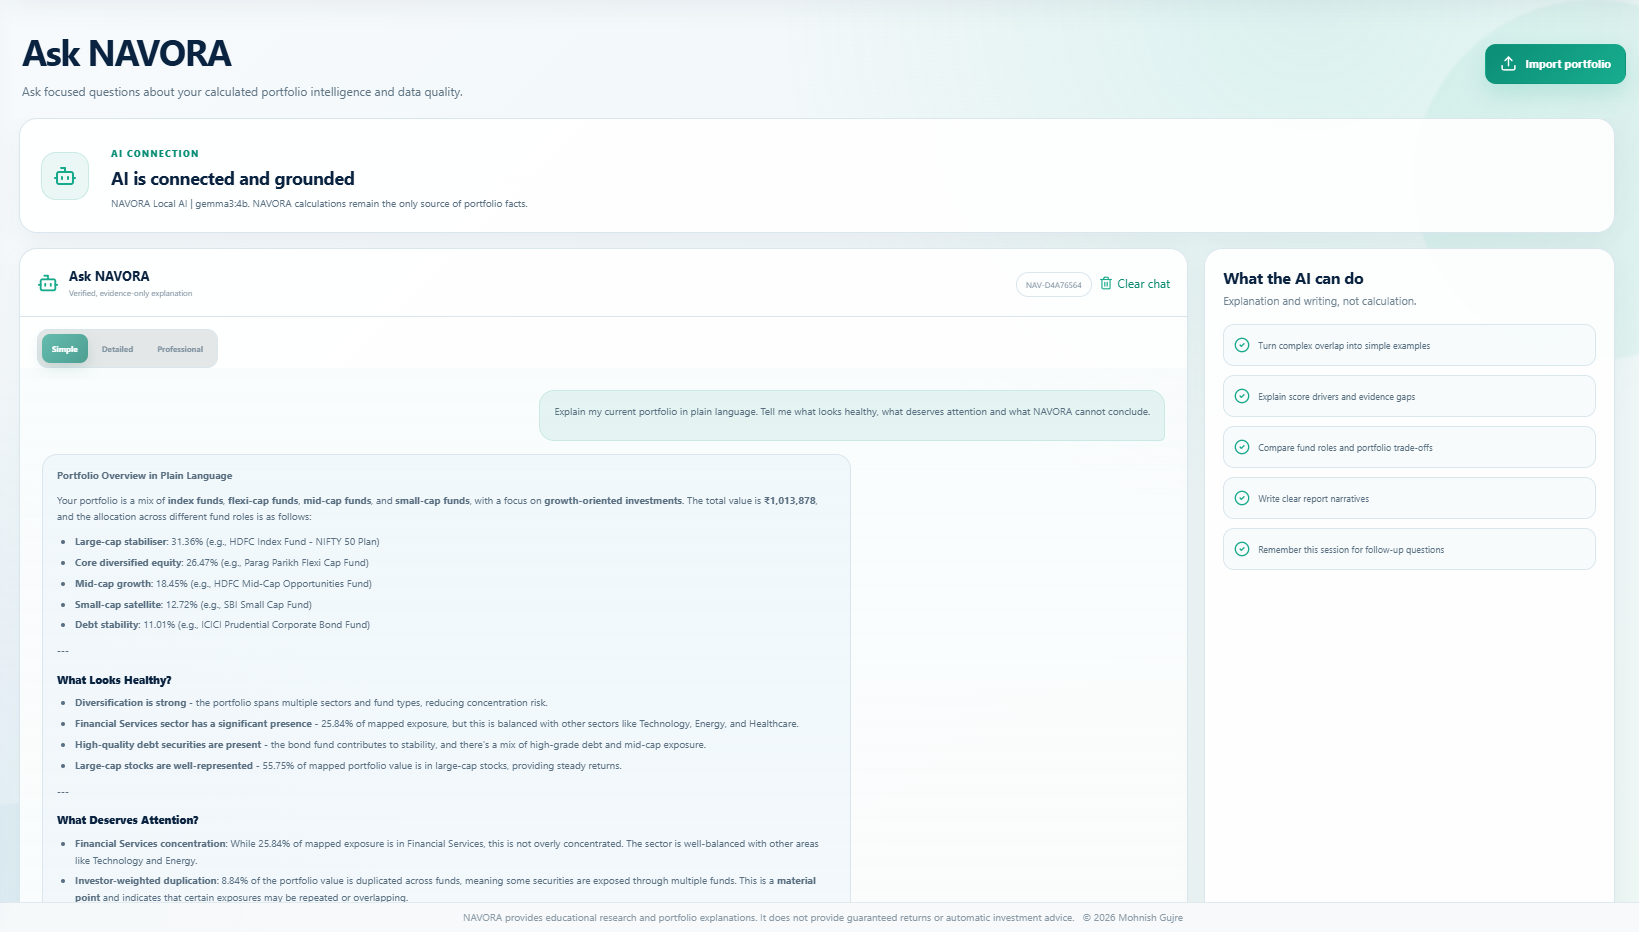
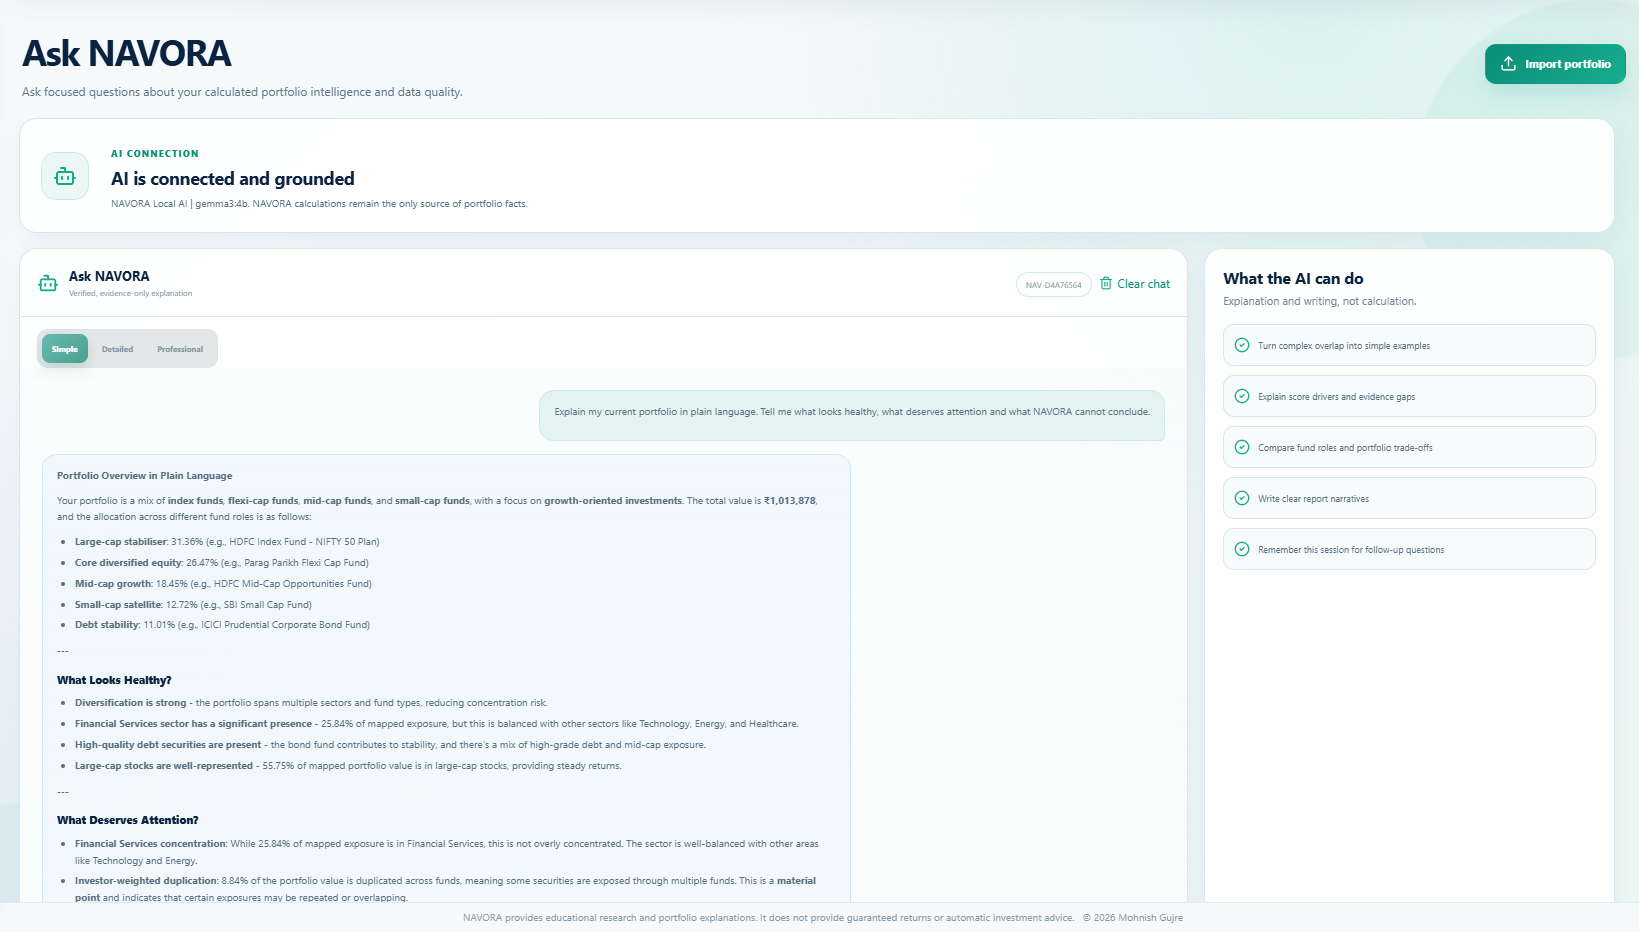
Ask Navora

Inspiration
Eight mutual funds. Eight different names. Eight different categories. On the screen, it looked like a well-diversified portfolio. But I began wondering: Were these really eight different investments or eight different doors leading to many of the same places? That question changed the entire way I looked at mutual-fund portfolios.
Most investment platforms show the outer layer clearly. They show the fund name, invested amount, current value, returns, rating, category, and past performance. All of that is useful. But it still leaves the most important part hidden:
"What does the investor actually own after all the mutual funds are opened up and combined?"
A fund name is only a container. Inside that container are companies, sectors, market segments, investment styles, and hundreds of decisions made by the fund manager.
When an investor owns several funds, those hidden layers begin interacting with one another. Two funds with different names may own many of the same companies. Three funds from different categories may still depend heavily on the same sector. A portfolio with eight schemes may behave like a portfolio of only four genuinely different ideas. One fund may exist without serving any clear purpose. Two others may be doing almost the same job. A company that appears small inside one fund may become one of the investor’s largest exposures after all the funds are combined. Yet the investor usually sees none of this. They see eight separate boxes. The portfolio itself remains invisible.
That is where 'NAVORA' began. I did not want to build another platform for finding funds, buying funds, tracking returns, or looking at ratings. Those products already solve important problems.
I wanted to solve the problem that begins after an investor has already built a portfolio:
“I know which mutual funds I own. But do I understand the portfolio they have created together?”
NAVORA was built to answer that question. It does not treat mutual funds as isolated products. It opens them, connects them, and rebuilds them as one complete portfolio.
What it does
NAVORA is a mutual-fund portfolio intelligence platform that reveals the portfolio hiding beneath fund names, categories, and returns. Most investing platforms show investors which funds they own.
NAVORA goes one layer deeper. It shows:
- Which companies they actually own indirectly
- Their real exposure to each company
- Where different funds repeat the same holdings
- Whether that repetition is creating concentration
- Which sectors dominate the portfolio
- What role each fund is playing
- Whether multiple funds are doing the same job
- How the portfolio is changing over time
- How complete and current the available information is
The result is not another list of mutual funds. It is a connected map of the investor’s actual ownership.
Looking Beyond Ordinary Fund Overlap
Most overlap tools simply show that two funds hold some of the same companies. But that does not tell investors how much the overlap actually matters to them.
Suppose 40% of an investor’s portfolio is in one fund, and that fund has 8% invested in a particular company. The investor’s actual exposure is:
[ 40% \times 8% = 3.2% ]
NAVORA performs this calculation across every available holding in every fund, then combines repeated holdings across the portfolio. A company may appear small inside individual funds but quietly become one of the investor’s largest exposures once all the funds are brought together. So NAVORA does not only ask:
“Do these funds overlap?”
It asks:
“How much of the investor’s actual money is being repeated, and where is that repetition creating meaningful concentration?”
More Than a Portfolio X-Ray
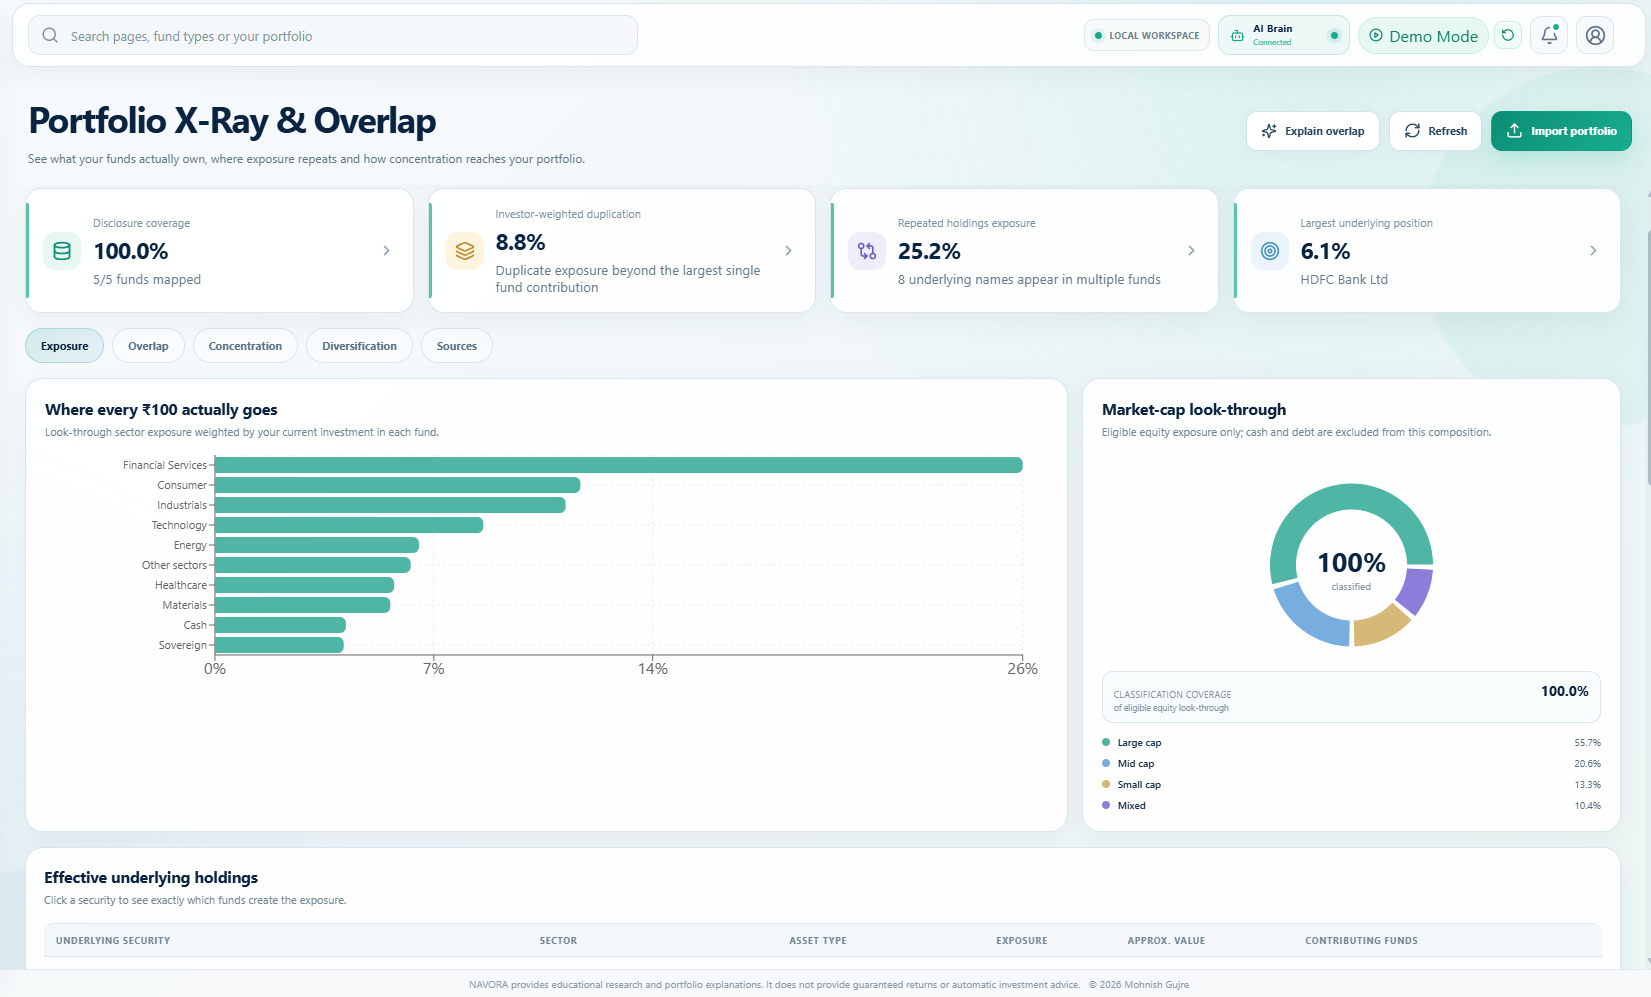
Portfolio X-Ray is the center of NAVORA. It opens every fund, studies the underlying holdings, and rebuilds the portfolio as one complete system. It reveals:
- The investor’s largest indirect company exposures
- Combined sector exposure
- Concentration across companies and sectors
- Repeated holdings
- Relationships between funds
- Portfolio coverage and data freshness
- Unresolved or incomplete information
But NAVORA does more than show what is inside the portfolio. It also explains why every fund is there.
Understanding the Role of Every Fund
Mutual-fund portfolios often grow over time. One fund may have been added because it performed well. Another may have been recommended by someone. A third may have been started for tax saving. Some may remain in the portfolio for years without being reviewed. Eventually, the portfolio becomes a collection of decisions made at different times. NAVORA studies the contribution of each fund to the complete portfolio. A fund may be providing growth, stability, diversification, international exposure, tax efficiency, smaller-company exposure, or a distinct investment style. It also identifies when two or more funds appear to be serving almost the same purpose. This changes the question from:
“Is this a good fund?”
to:
“What is this fund actually doing for my portfolio?”
A fund may be good on its own and still add very little to a particular investor’s portfolio. That distinction is central to NAVORA.
A Portfolio That Can Explain Itself
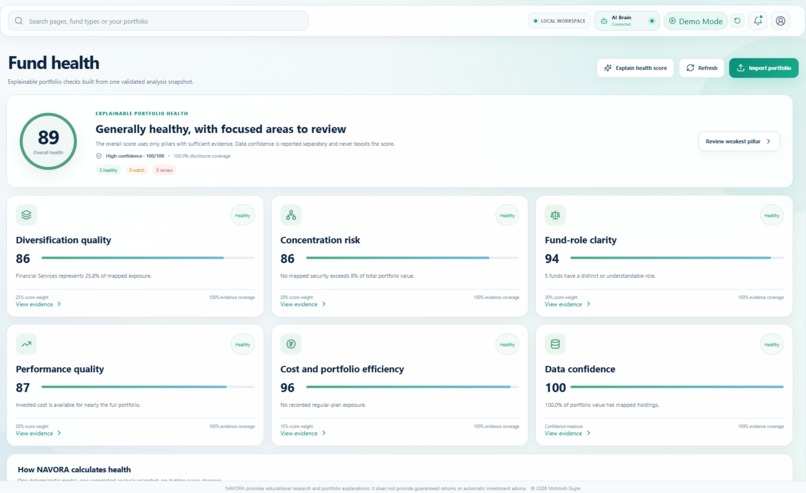
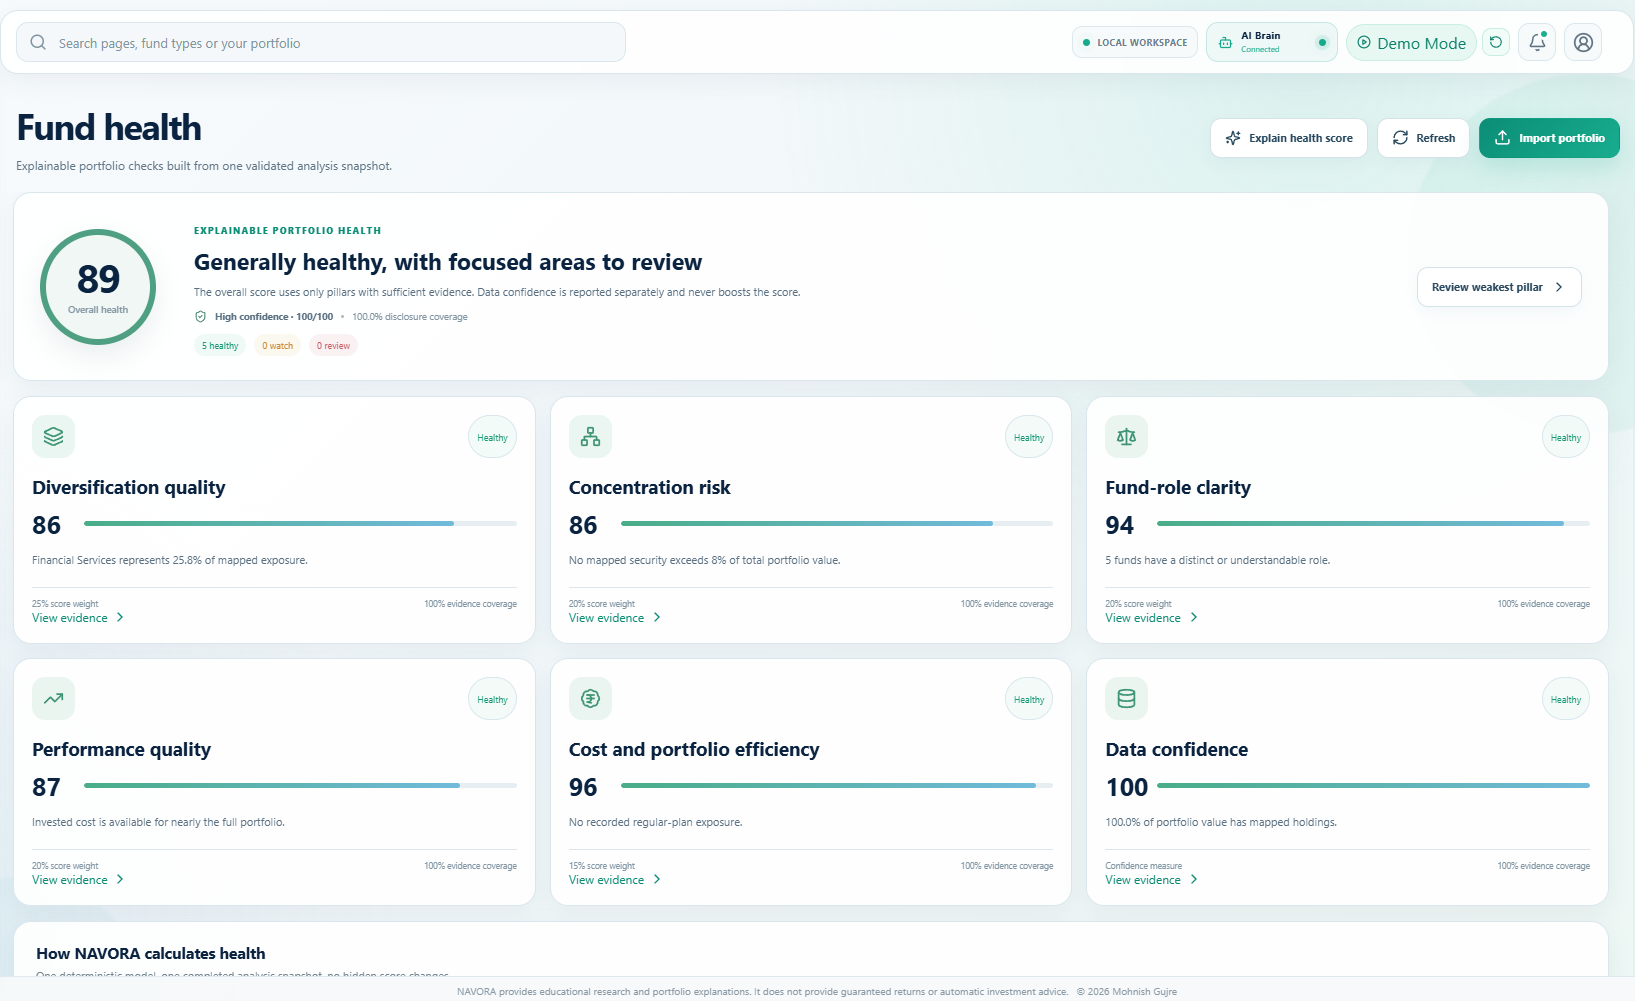
Many financial tools show a score, warning, or colored indicator without clearly explaining how it was produced. NAVORA is designed differently. Every important finding should help the user understand:
- What happened?
- Why does it matter?
- Which funds or holdings caused it?
- What information was used?
- Is anything important missing?
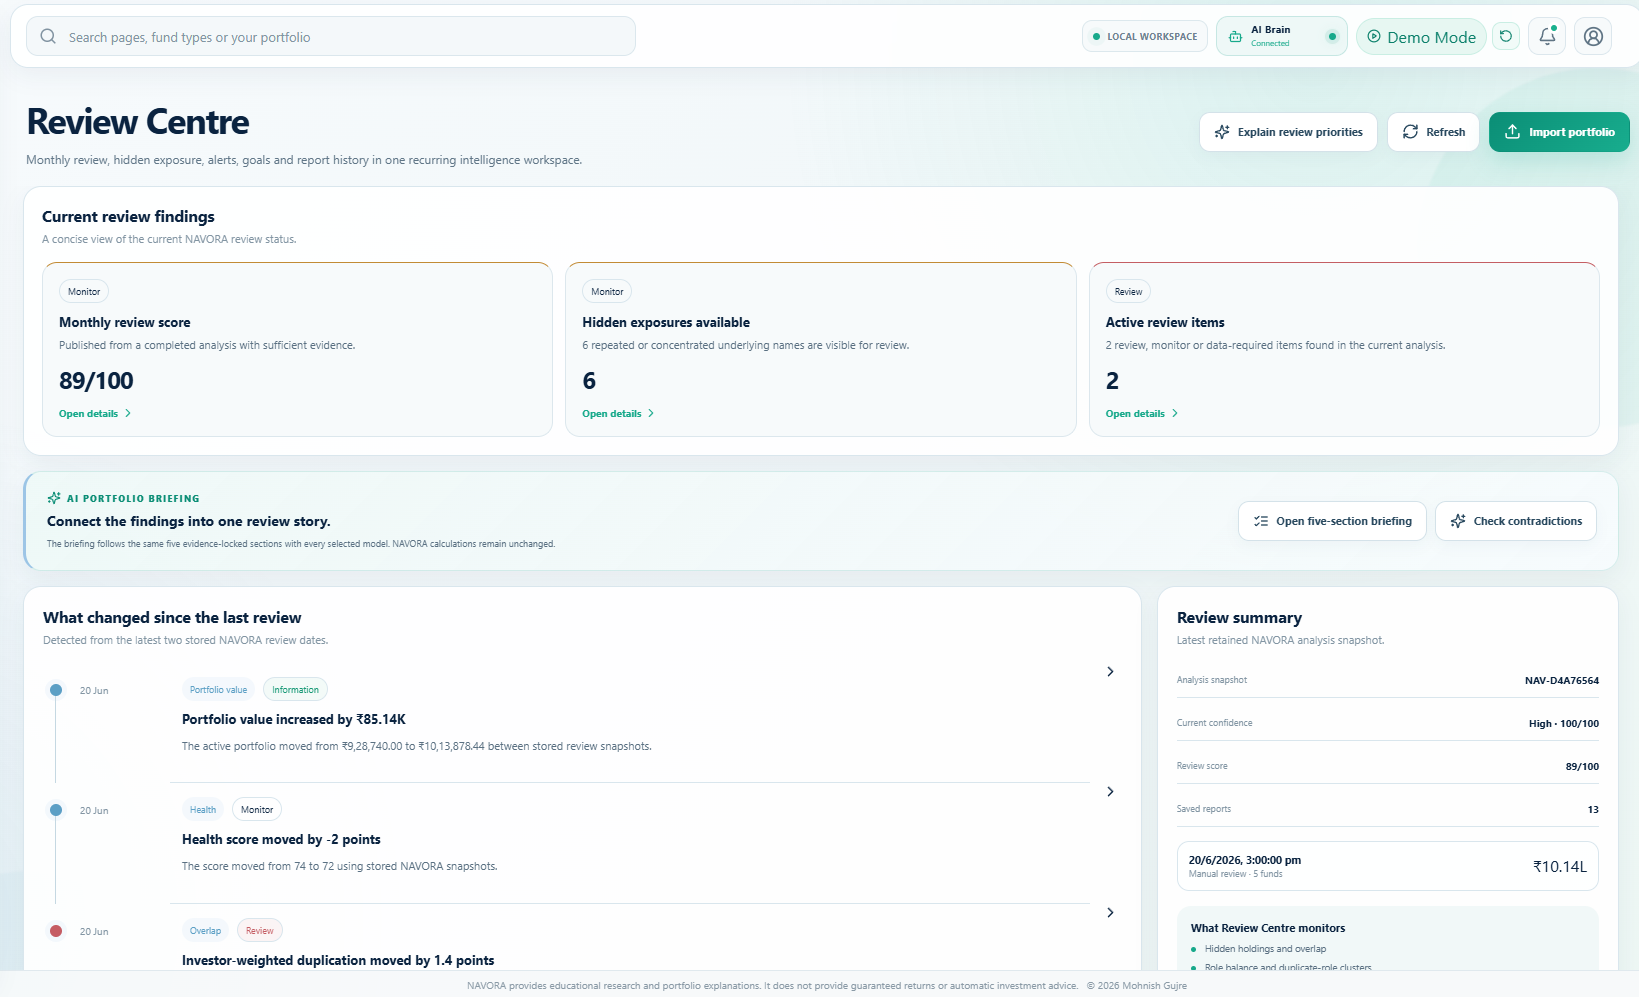
The Review Center organizes findings into simple categories such as:
- Review
- Monitor
- Information Required
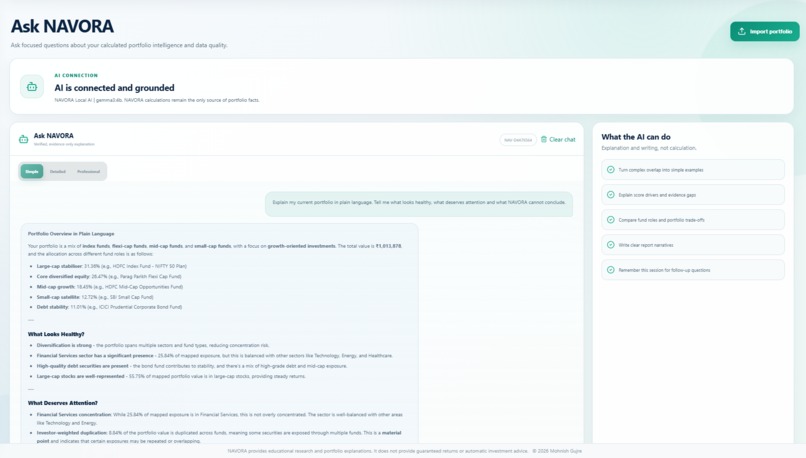
The purpose is not to tell investors what to buy or sell. It is to show what deserves attention and explain why. Users can also ask questions about their own portfolio in normal language:
- Why is my portfolio concentrated?
- Which funds are creating the most duplication?
- Which companies do I indirectly own the most?
- Are two funds doing the same job?
- What changed since my last review?
- How was this score calculated? The answers are based on the investor’s actual portfolio rather than generic mutual-fund information.
Following the Portfolio Through Time
A mutual-fund portfolio is never static. Fund managers change holdings. Sector exposure moves. Investment styles shift. A company may disappear from one fund and become a major holding in another. A portfolio that looked balanced six months ago may gradually become concentrated even if the investor made no changes.
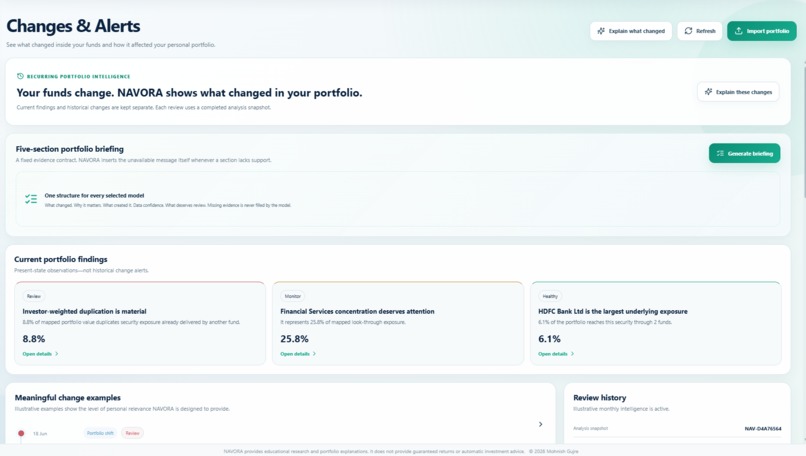
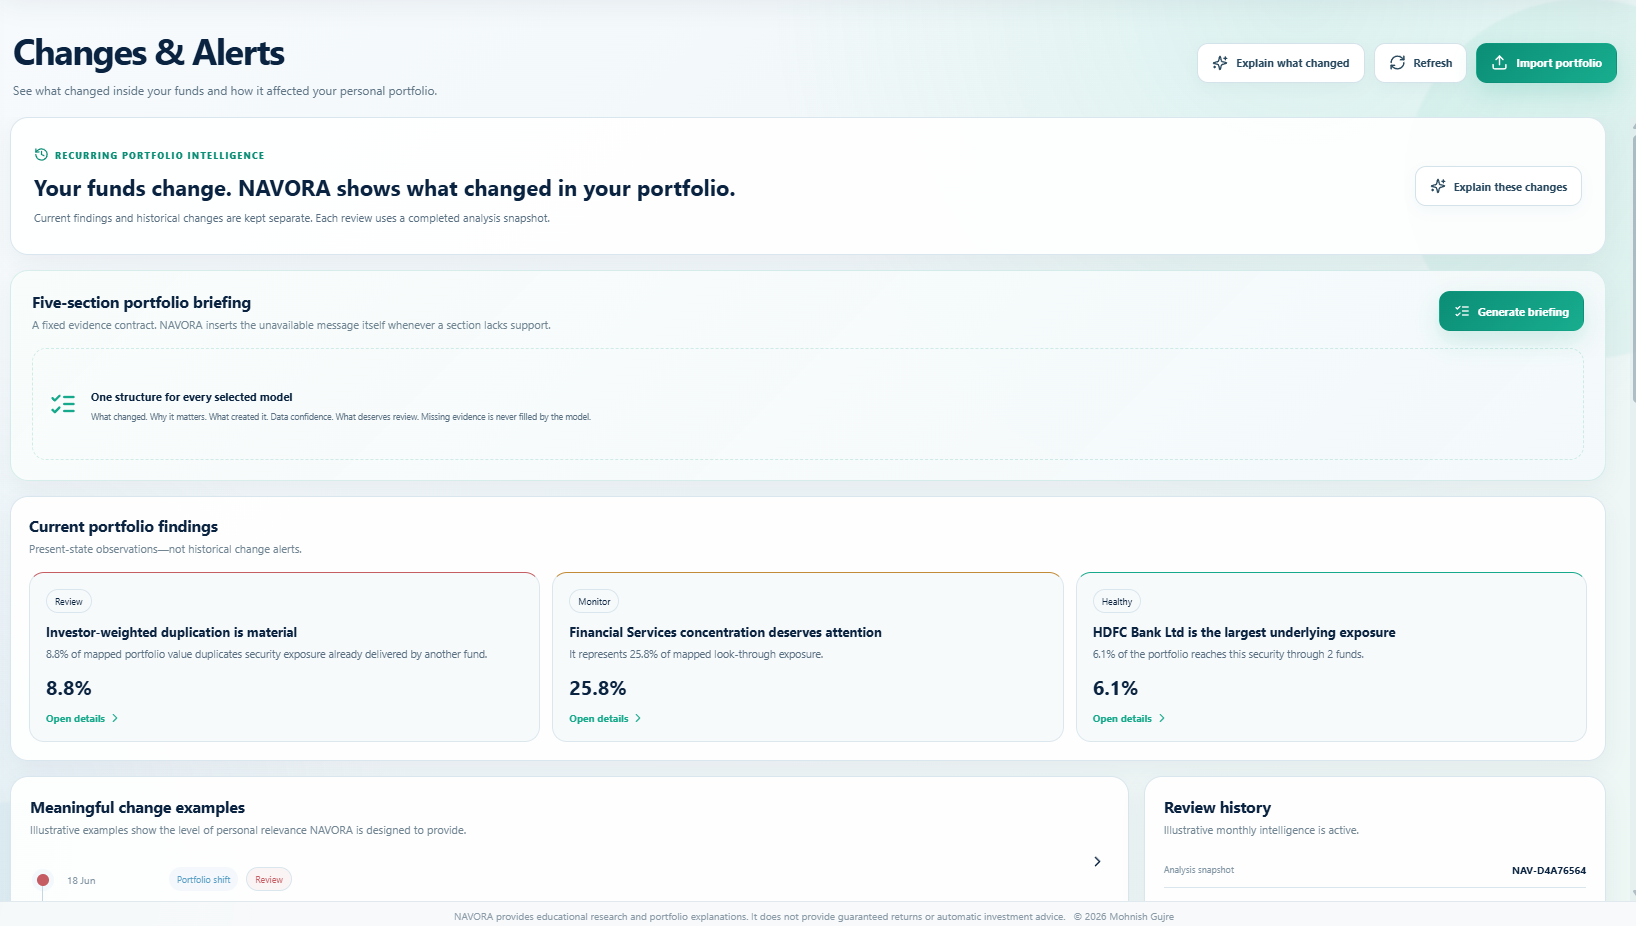
NAVORA’s Changes and Alerts section tracks these movements and helps answer:
- What entered or exited the portfolio?
- Which exposures increased or decreased?
- Did overlap become stronger?
- Did a fund’s role change?
- Is the latest information complete?
Instead of forcing investors to download multiple factsheets and compare them manually, NAVORA brings meaningful changes into one place.
This turns NAVORA from a one-time portfolio checker into a system that helps investors understand how their portfolio is evolving.
How we built it
I started by defining the questions that existing portfolio screens were not answering. I did not begin with pages, charts, or buttons. I began with the invisible portfolio.
The first task was to connect an investor’s allocation in each fund with the holdings inside those funds. Once that connection was created, NAVORA could calculate the investor’s real exposure across the complete portfolio.
From there, I built each part around a different unanswered question:
Portfolio X-Ray: What do I actually own? Overlap and Concentration: Where is my money being repeated? Fund Roles: Why is each fund in the portfolio? Changes and Alerts: What is changing beneath the surface? Review Center: What deserves closer attention? SIP Lab: How could future contributions affect the plan? Reports: How can the complete analysis be saved and shared? Ask NAVORA: How can an investor question their own portfolio naturally? Data and Sources: How reliable and current is the information?
The goal was not to fill the product with disconnected features. Every section had to contribute to one central idea: Turn several mutual funds into one understandable portfolio.
I also spent significant time on the presentation.
NAVORA handles a large amount of information, but it should not feel like a spreadsheet or a professional terminal that only specialists can understand. The interface was designed to remain calm, visual, and approachable.
Important findings are presented in simple language first. Users who want more detail can open the calculations, evidence, methodology, and source information behind them.
The same approach is followed in the reports.
A NAVORA report is not simply a screenshot of the dashboard placed inside a PDF. It is structured as a complete portfolio review, with findings, explanations, supporting figures, data quality, and the reasoning behind the conclusions.
Challenges we ran into
The first major challenge was the data itself. Mutual-fund information can come from different documents, formats, dates, and naming systems. The same company may appear under slightly different names. A scheme name may not match perfectly across sources. Some funds may publish newer information than others. Certain holdings may be missing, incorrectly classified, or difficult to map. A portfolio result can look precise while being based on incomplete information.
I did not want NAVORA to hide that uncertainty.
This led to the addition of:
disclosure coverage source freshness mapping status unresolved schemes missing information warnings data confidence
When NAVORA does not have enough reliable information, it is designed to say so clearly.
The second challenge was avoiding misleading overlap calculations.
Counting common holdings was easy. Understanding their real effect on a particular investor’s portfolio was much harder. The calculation had to consider both the size of the investor’s allocation and the weight of each company inside each fund.
The third challenge was explaining complex findings without making the product feel complex.
A portfolio may involve thousands of individual data points, but the user should not need to understand thousands of rows. NAVORA had to translate those details into a small number of meaningful answers without hiding the evidence.
The fourth challenge was maintaining consistency.
As the product grew, every new section had to feel like part of the same system. Charts, buttons, scores, tables, reports, colors, explanations, and page layouts all needed to follow the same visual language.
The final challenge was restraint.
There is always another metric, graph, score, or feature that can be added to a finance product. But more information does not always create more understanding. I repeatedly had to ask: Does this help the investor see their portfolio more clearly, or does it only make the screen busier?
Accomplishments that we're proud of
We are proud that NAVORA has grown beyond a portfolio tracker into a working portfolio intelligence system. It can open multiple mutual funds, rebuild them as one connected portfolio, calculate the investor’s real underlying exposure, identify meaningful duplication, explain the role of each fund, track changes, and show when the available data is incomplete or outdated.
We are especially proud of building investor-weighted overlap. Instead of simply counting common stocks between funds, NAVORA measures how much of the investor’s actual money is being repeated. We also created Portfolio X-Ray, Fund Roles, Changes and Alerts, Review Center, portfolio-specific conversations, and professional reports as parts of one connected experience.
The achievement we value most is simple: NAVORA turns thousands of hidden portfolio data points into answers an everyday investor can understand.
What we learned
The biggest lesson was that the number of funds is not the same as the number of ideas in a portfolio. Diversification cannot be understood by counting schemes. It can only be understood by looking at the underlying ownership and the relationships between those schemes.
I also learned that a fund should not be judged only as an individual product. Its value depends on the portfolio around it.
A fund may look excellent when viewed alone but may repeat exposures the investor already has. Another fund with lower recent returns may be providing the portfolio’s most important diversification.
I learned that transparency creates more trust than artificial certainty. Showing missing data, old disclosures, and unresolved mappings may appear less impressive than displaying a confident score.
But it is more honest and ultimately more useful.
Most importantly, I learned that financial information does not become valuable simply because it exists. It becomes valuable when separate pieces are connected into a clear picture.
What's next for NAVORA
The next step is to make NAVORA feel less like a tool that users occasionally open and more like an intelligence layer that continuously understands their portfolio.
We plan to add automatic portfolio imports, monthly disclosure updates, deeper portfolio history, smarter change detection, goal-aware SIP planning, and secure portfolio access across devices.
NAVORA will also become more conversational. Investors will be able to ask not only what their portfolio looks like today, but how it has evolved, why a risk appeared, what caused a score to change, and how a future investment could alter the portfolio.
Our larger vision is to build a living digital map of mutual-fund ownership, one that updates with the portfolio, remembers its history, explains every important change, and helps investors understand the decisions hidden beneath their fund names. An investor should not need to open several applications, read dozens of disclosures, maintain complex spreadsheets, or depend entirely on someone else to understand their own portfolio. Their portfolio should be able to explain itself.
That is what NAVORA is being built to make possible. Understand. Invest. Grow.

Log in or sign up for Devpost to join the conversation.