-
Dashboard
-
Conflict Resolver
SkySense
Real-Time Flight Conflict & Airspace Intelligence
Problem
Canada’s airspace is becoming increasingly complex as flight volumes continue to rise. Traditional tools mainly offer static flight tracking or post-incident monitoring, leaving critical gaps:
- Early detection of mid-air conflicts
- Understanding traffic congestion around high-density waypoints
- Visualizing how multiple aircraft interact dynamically within shared airspace
There is no accessible, lightweight platform that enables real-time conflict analysis, multi-aircraft visualization, or waypoint-level traffic insights.
Our Solution
Flight Analytics Dashboard is a real-time airspace analysis platform that combines a Python-based flight simulation engine with an interactive React + Leaflet visualization dashboard. The system simulates 250–1000 Canadian flights, detects multi-aircraft conflicts, identifies airspace hotspots, and lets users explore each conflict in detail on a dynamic map. Our goal was to build something lightweight, visual, and analytical, giving users a clear view of how aircraft share the sky.
Why It Matters
Air traffic management is moving toward proactive safety, requiring tools that can:
- Visualize aircraft interactions before incidents occur
- Analyze airspace congestion in real time
- Scale with rising air traffic density
- Support training, research, and automated conflict-avoidance systems
Our platform shows how simulation + analytics + visualization can work together to provide immediate insight into complex airspace behavior. This foundation can evolve into:
- Real-time integration with ADS-B feeds
- Predictive conflict resolution
- AI-assisted risk scoring
- Airspace optimization tools
How It Works
Flight Simulation & Conflict Detection (Python)
We built a custom Python engine (FlightPath.py) that:
- Simulates aircraft trajectories over time
- Detects conflicts involving two or more aircraft
- Calculates the time (in seconds after departure) when conflicts occur
- Outputs structured conflict data in conflicts.json
- Re-generates results every time the user runs an analysis
This gives us a fresh, accurate conflict snapshot on demand.
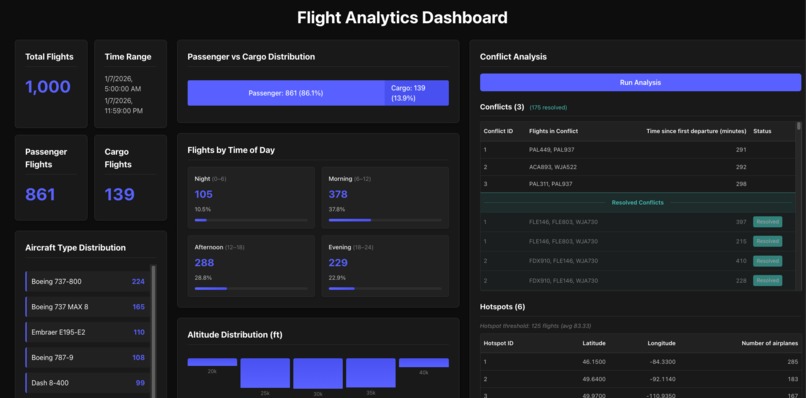
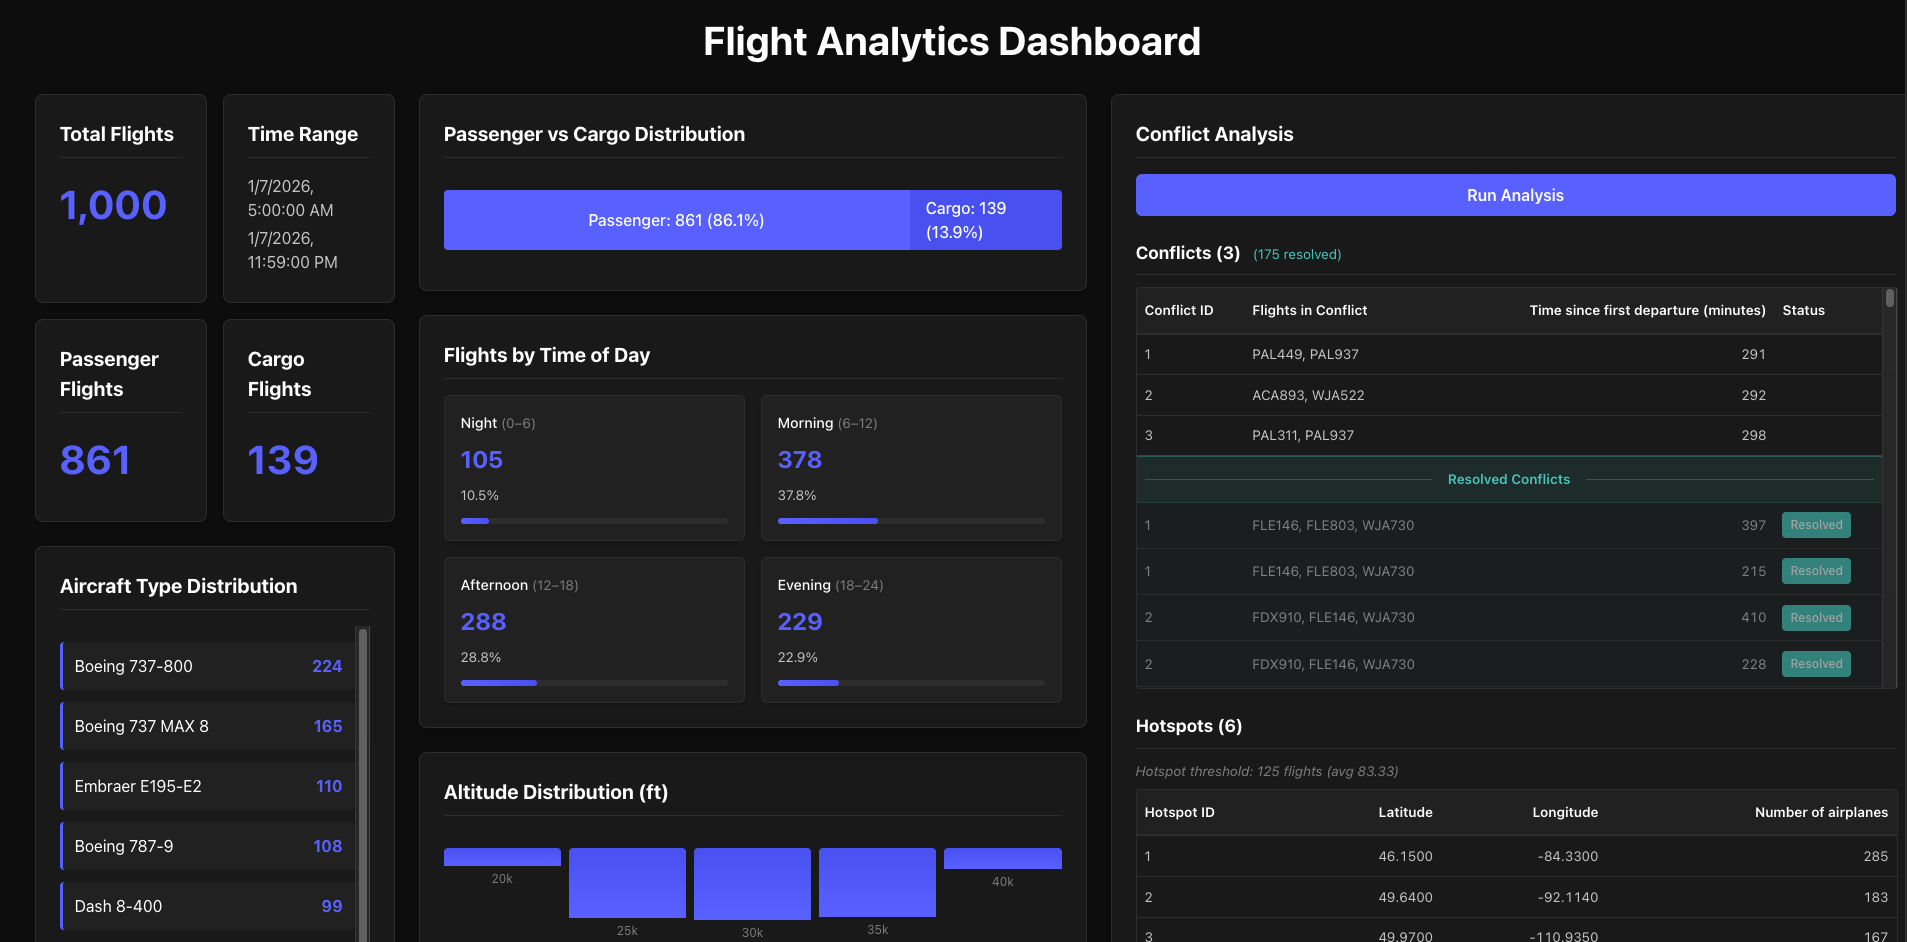
Interactive Dashboard (React + Vite)
Our dashboard visualizes the entire dataset with:
- Total flights
- Time-of-day distribution
- Altitude histograms
- Aircraft type breakdown
- Top routes
- Live hotspot identification
- Conflict table with deep-dive navigation
A single click — Run Analysis — re-simulates all trajectories and updates the results instantly.
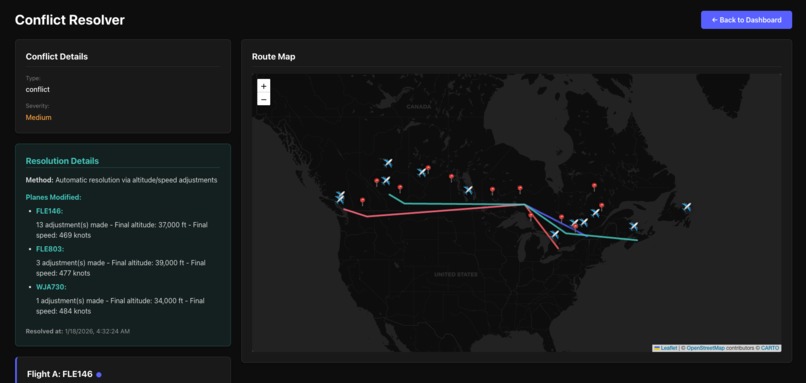
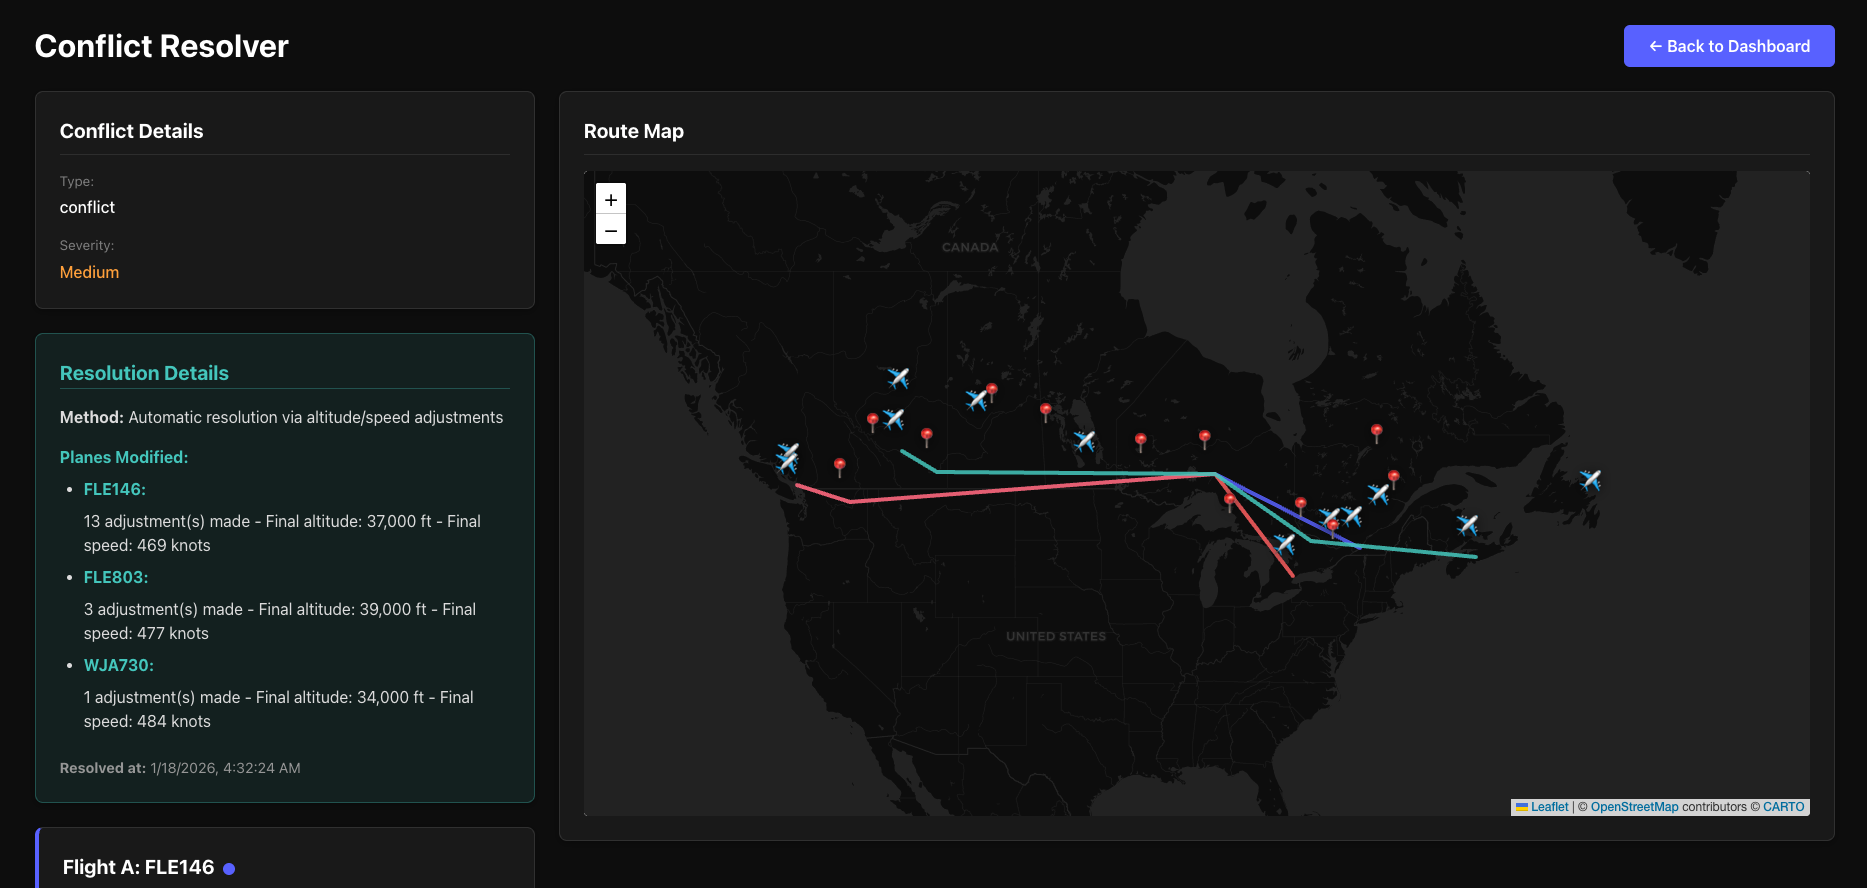
Conflict Resolver (Leaflet Map)
Clicking any conflict opens a dedicated map view that:
- Visualizes every aircraft involved (2–6+)
- Draws complete trajectories: departure airport → all waypoints → arrival airport
- Assigns each aircraft a unique color
- Shows the exact moment the conflict occurs
- Allows users to compare paths and understand why the conflict happened
Hotspot Detection
Using route parsing and a dynamically generated waypoint → list of ACID codes dictionary, our system:
- Counts traffic at each waypoint
- Determines hotspots using a dataset-adaptive threshold
- Highlights overloaded or high-risk waypoints
This works for any dataset size, from hundreds to thousands of flights.
Key Technical Features
- True multi-aircraft conflict detection (not limited to pairs)
- Live integration between Python and React via a custom Vite API endpoint
- Dataset-agnostic hotspot algorithm
- Full multi-waypoint route visualizations
- Centralized state sharing (React Context)
- Scales from 250 to 1000+ flights without structural changes
Tech Stack
- Frontend: React, Vite, Leaflet
- Backend / Simulation: Python, Javascript (custom trajectory engine)
- Data Handling: Node.js, JSON
- Version Control: GitHub


Log in or sign up for Devpost to join the conversation.