Inspiration
The maritime insurance industry moves billions of dollars based on risk assessments that are often opaque, delayed, or inaccessible. When we looked at recent events — Houthi strikes in the Red Sea, vessel seizures in the Strait of Hormuz, rerouting around the Cape of Good Hope — we realized that war risk premiums are being priced in real time by the market, but visualized nowhere. We wanted to build a tool that makes maritime risk visible, turning fragmented signals into a single, actionable score for each of the world's critical chokepoints.
What it does
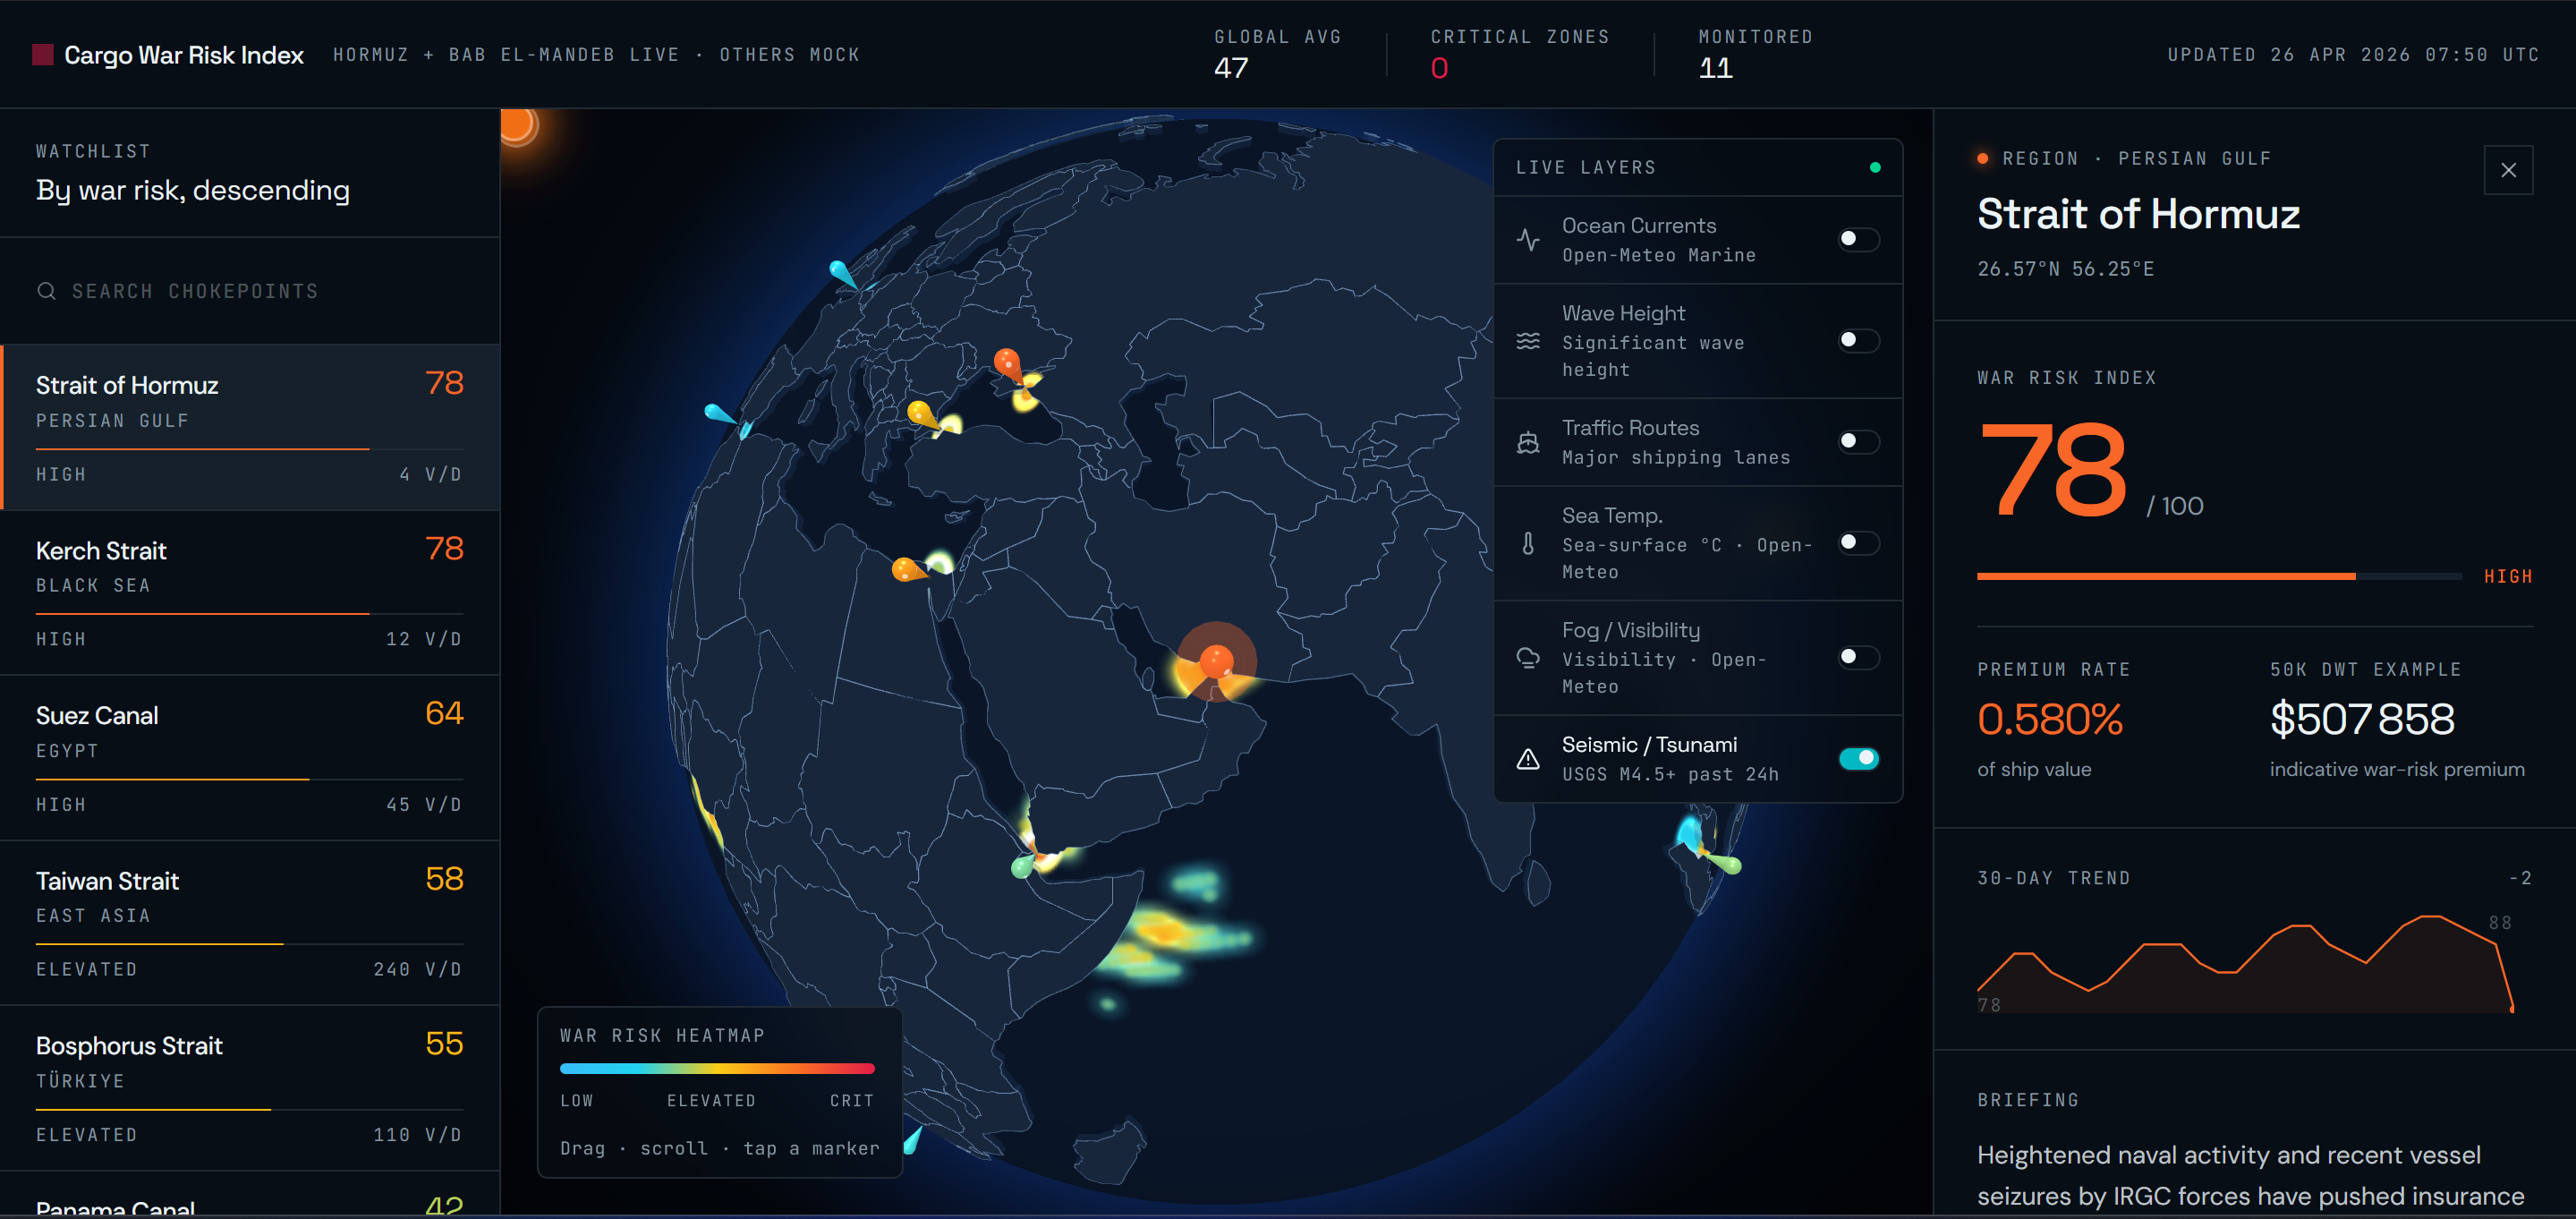
NautiQ is a real-time maritime risk visualization platform. It combines an interactive frontend focused on the world's major trade chokepoints with a scoring backend that aggregates maritime traffic signals, predictive models, and live data from Polymarket.
How we built it
The project is split into two independent layers:
Frontend — React + Vite + TanStack Router, served locally on localhost:8080. It displays an interactive chokepoint dashboard with live risk scores, 30-day trend sparklines, vessel traffic data, and geopolitical briefings. Backend — A Python pipeline (MLOriginal/maritime-ml/) that ingests raw CSV data from IMF PortWatch and HDX, builds a SQLite database, trains a PyTorch model, and outputs a live JSON feed consumed by the frontend.
To run the full stack, we launch both the Python risk feed and the Vite dev server in parallel terminals.
Challenges we ran into
Working as a team on a shared codebase surfaced some friction early on. Merge conflicts, diverging folder structures, and inconsistent environment setups across machines made collaboration harder than expected. Aligning on a clean Git workflow mid-hackathon — while also building the product — was a real challenge.
Accomplishments that we're proud of
Shipping a finished, working product in a hackathon timeframe. NautiQ goes from raw maritime traffic CSVs to a polished risk dashboard with a real ML backbone — that's a full data-to-UI pipeline built under pressure.
What we learned
We came out with a much sharper Git workflow — branching, pull requests, and resolving conflicts without stepping on each other's work. We also discovered the power of vibe coding: moving fast, iterating on the UI in real time, and letting the product shape itself as we built it.
What's next for NautiQ
The immediate priority is improving the risk model — incorporating more granular AIS vessel tracking data, refining the Polymarket weighting, and extending coverage to additional chokepoints beyond Hormuz and Bab el-Mandeb. Longer term, we'd like to expose the risk scores via a public API so insurers and freight operators can integrate NautiQ directly into their pricing tools.
Built With
- claudecode
- lovable
- python
- typescript

Log in or sign up for Devpost to join the conversation.